| Param | Original file | Final file |
|---|---|---|
| Filename | modeM0/AS1A04_203T01_9000002284_15474cztM0_level2.evt | modeM0/AS1A04_203T01_9000002284_15474cztM0_level2_quad_clean.evt |
| Size (bytes) | 493,879,680 | 69,477,120 |
| Size | 471.0 MB | 66.3 MB |
| Events in quadrant A | 3,418,267 | 423,224 |
| Events in quadrant B | 3,568,289 | 425,183 |
| Events in quadrant C | 3,414,794 | 406,431 |
| Events in quadrant D | 4,121,465 | 402,330 |
| Mode M0 | |||
|---|---|---|---|
| Quadrant | BADHDUFLAG | Total packets | Discarded packets |
| A | 0 | 14007 | 3 |
| B | 0 | 14569 | 2 |
| C | 0 | 13816 | 2 |
| D | 0 | 16381 | 2 |
| Mode SS | |||
|---|---|---|---|
| Quadrant | BADHDUFLAG | Total packets | Discarded packets |
| A | 0 | 130 | 0 |
| B | 0 | 130 | 0 |
| C | 0 | 130 | 0 |
| D | 0 | 130 | 0 |
| Mode M9 | |||
|---|---|---|---|
| Quadrant | BADHDUFLAG | Total packets | Discarded packets |
| A | 0 | 16 | 0 |
| B | 0 | 16 | 0 |
| C | 0 | 16 | 0 |
| D | 0 | 17 | 0 |
| Quadrant | Total seconds | Saturated seconds | Saturation percentage |
|---|---|---|---|
| A | 6397 | 148 | 2.313584% |
| B | 6397 | 158 | 2.469908% |
| C | 6397 | 149 | 2.329217% |
| D | 6397 | 209 | 3.267156% |
Noise dominated data is calculated using 1-second bins in cleaned event files. If a bin has >2000 counts, and if more than 50% of those come from <1% of pixels, then it is considered to be noise-dominated and hence unusable.
| Quadrant | # 1 sec bins | Bins with >0 counts | Bins with >2000 counts | High rate bins dominated by noise | Noise dominated (total time) | Noise dominated (detector-on time) | Marked lightcurve |
|---|---|---|---|---|---|---|---|
| A | 7633 | 6398 | 4 | 4 | 0.05% | 0.06% | 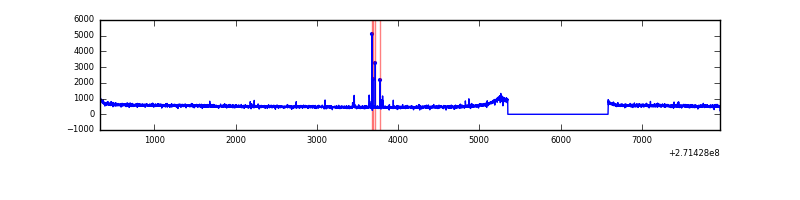 |
| B | 7633 | 6398 | 2 | 2 | 0.03% | 0.03% | 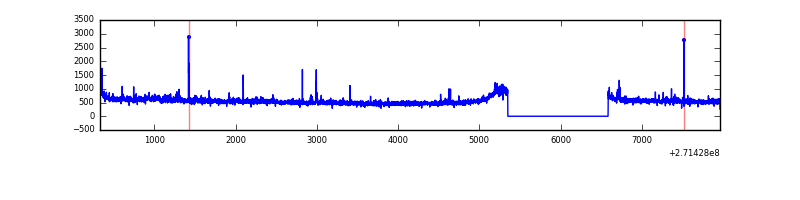 |
| C | 7633 | 6398 | 0 | 0 | 0.00% | 0.00% | 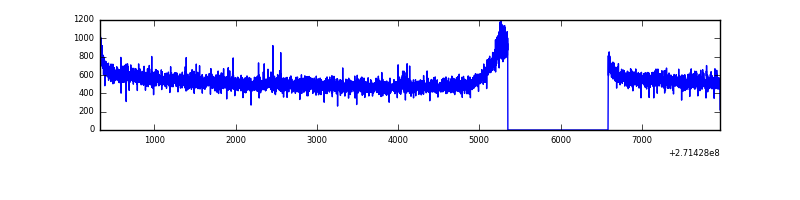 |
| D | 7633 | 6398 | 81 | 81 | 1.06% | 1.27% | 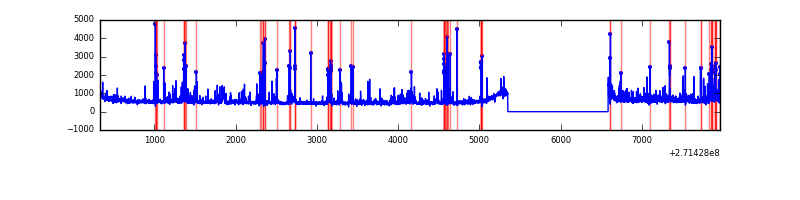 |
Top three noisy pixels from each quadrant. If the there are fewer than three noisy pixels in the level2.evt file, extra rows are filled as -1
| Pixel properties | Quadrant properties | ||||||
|---|---|---|---|---|---|---|---|
| Quadrant | DetID | PixID | Counts | Sigma | Mean | Median | Sigma |
| A | 15 | 69 | 24675 | 134.71 | 882 | 866 | 176.7 |
| A | 0 | 226 | 7799 | 39.23 | 882 | 866 | 176.7 |
| A | 12 | 194 | 6819 | 33.68 | 882 | 866 | 176.7 |
| B | 3 | 209 | 44960 | 267.42 | 873 | 853 | 164.9 |
| B | 0 | 229 | 32275 | 190.51 | 873 | 853 | 164.9 |
| B | 0 | 230 | 21849 | 127.3 | 873 | 853 | 164.9 |
| C | 14 | 238 | 129373 | 661.39 | 838 | 847 | 194.3 |
| C | 3 | 233 | 11360 | 54.1 | 838 | 847 | 194.3 |
| C | 13 | 61 | 6012 | 26.58 | 838 | 847 | 194.3 |
| D | 1 | 52 | 518315 | 2477.1 | 854 | 832 | 208.9 |
| D | 5 | 222 | 135535 | 644.8 | 854 | 832 | 208.9 |
| D | 13 | 172 | 70848 | 335.15 | 854 | 832 | 208.9 |
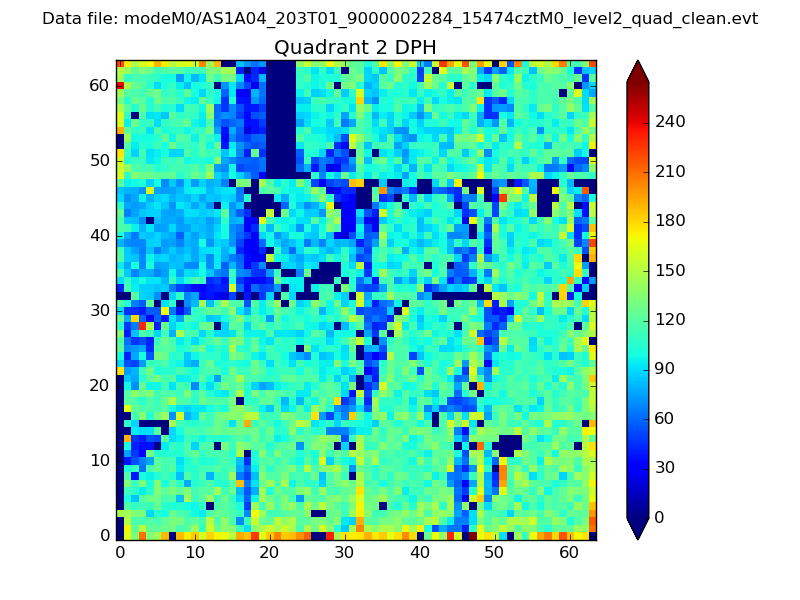
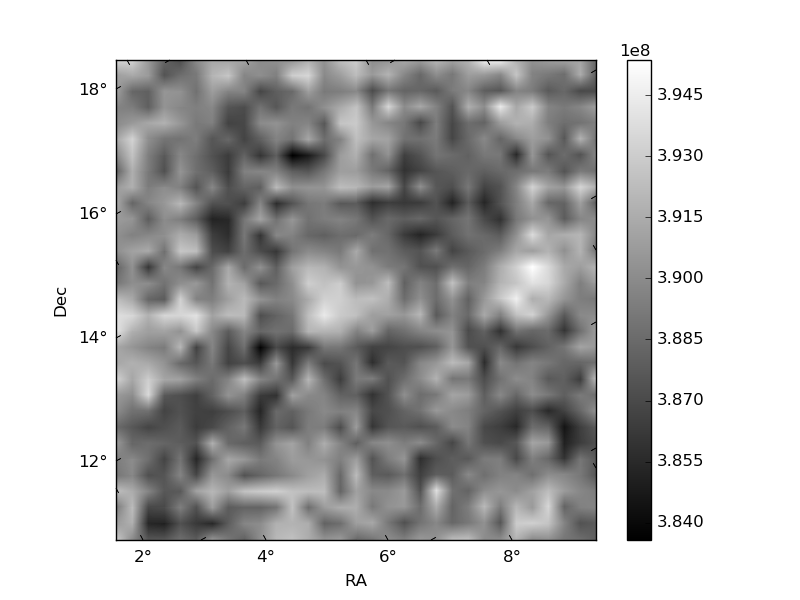
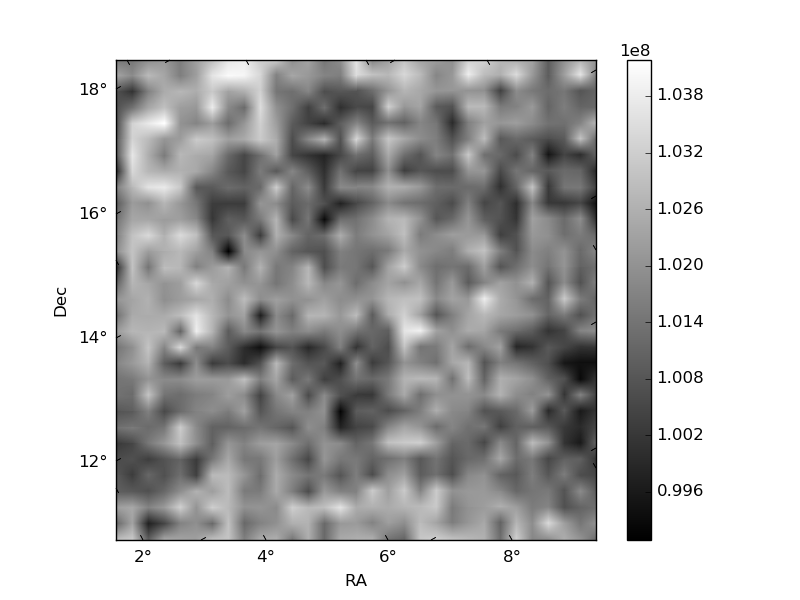
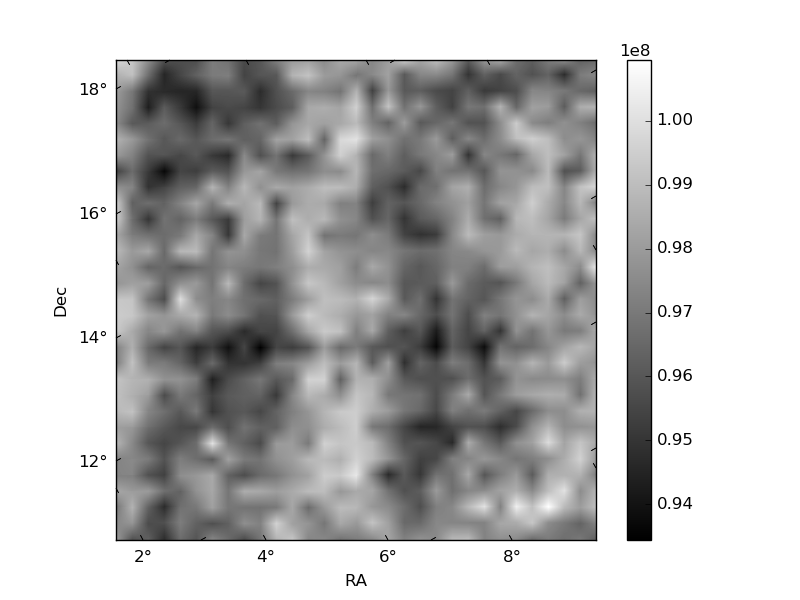
Histogram calculated using DETX and DETY for each event in the final _common_clean file
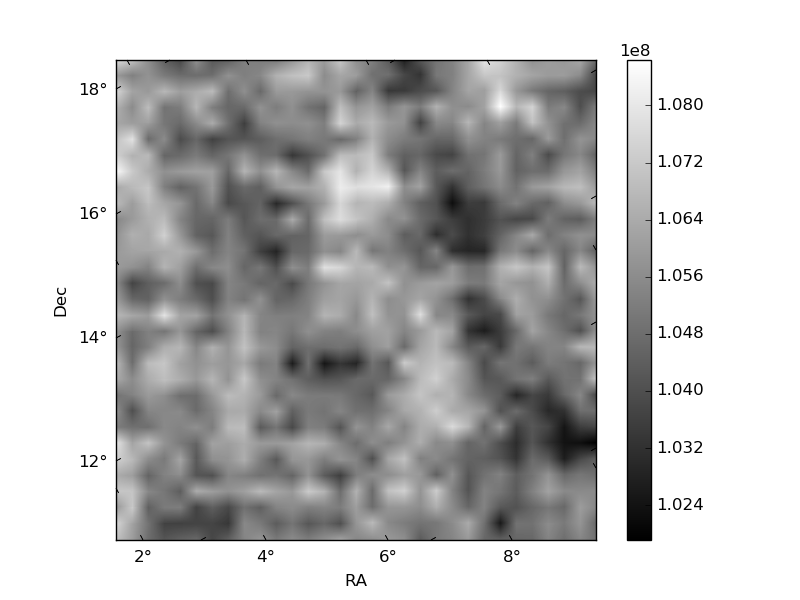
| Quadrant A | 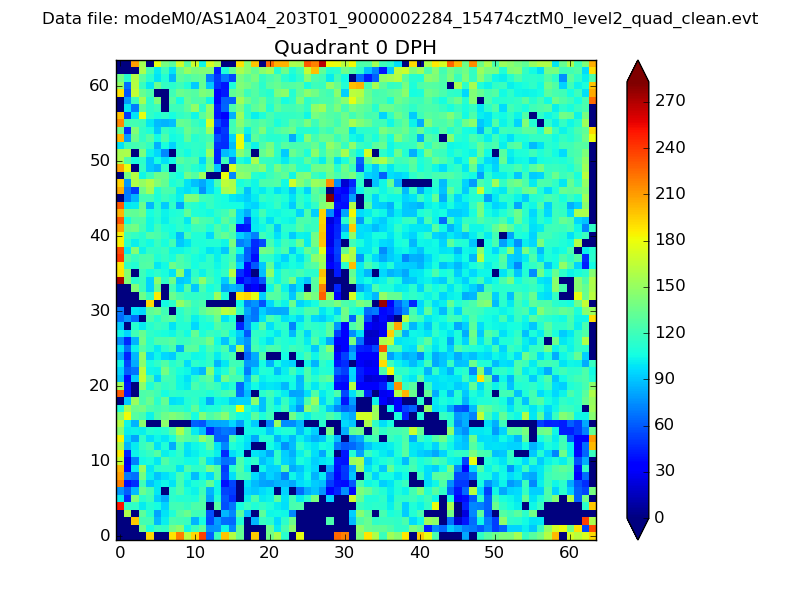 |
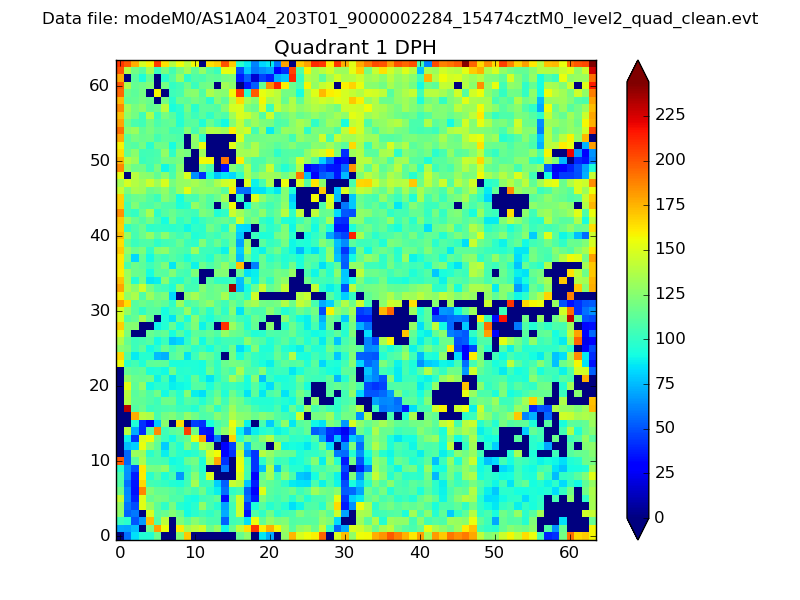 |
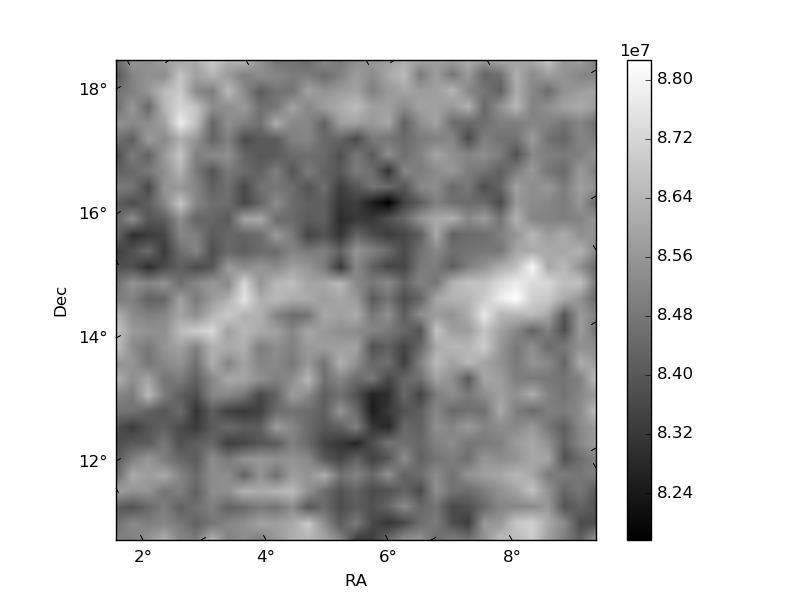
Quadrant B |
|---|---|---|---|
| Quadrant D | 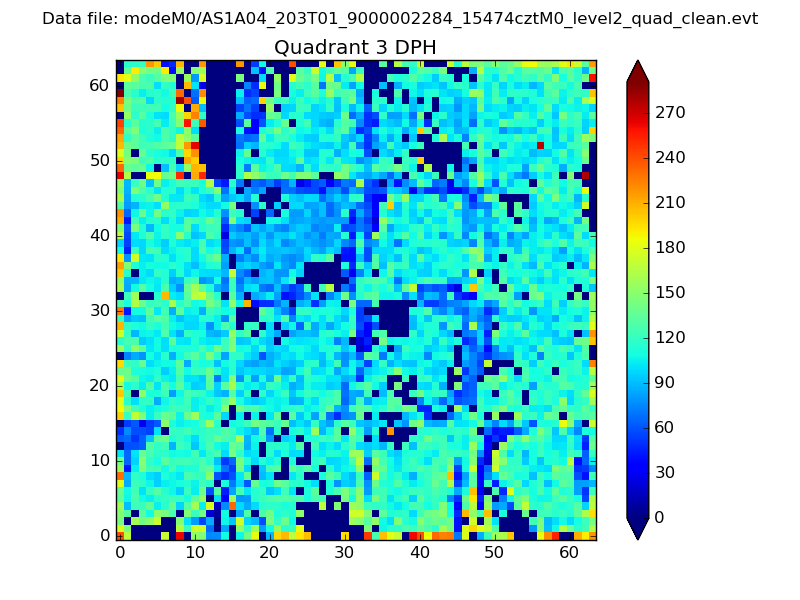 |
 |
Quadrant C |
| Plot type | Count rate plots | Images |
|---|---|---|
| Comparison with Poisson distribution Blue bars denote a histogram of data divided into 1 sec bins. Red curve is a Poisson curve with rate = median count rate of data. |
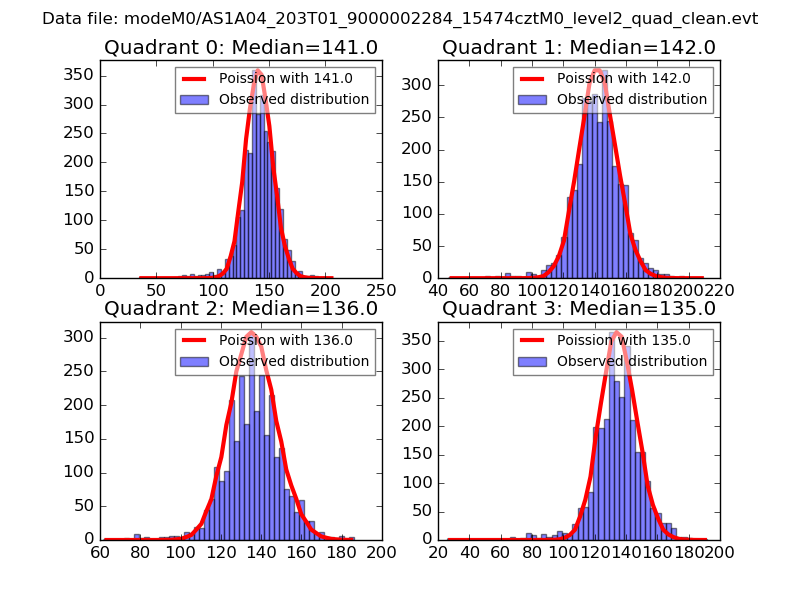 |
 |
| Quadrant-wise count rates Data is divided into 100 sec bins |
 |
|
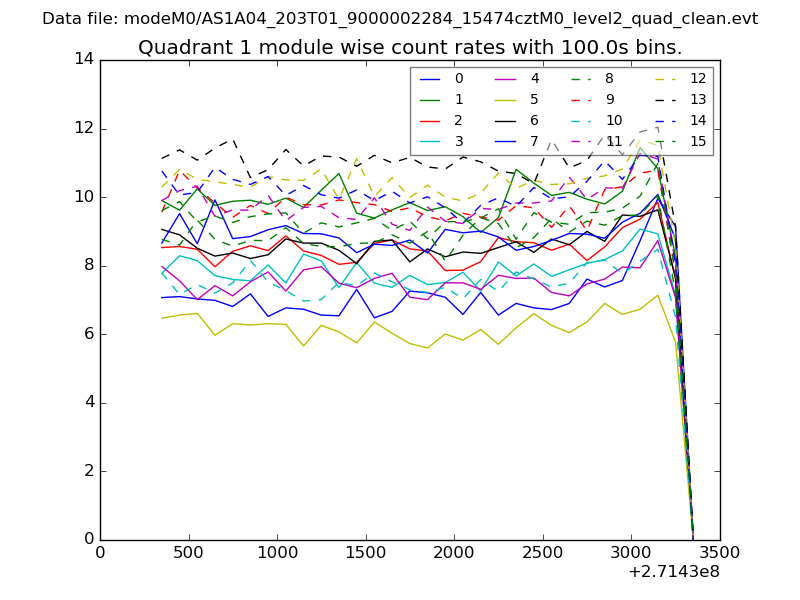
| Module-wise count rates for Quadrant A Data is divided into 100 sec bins |
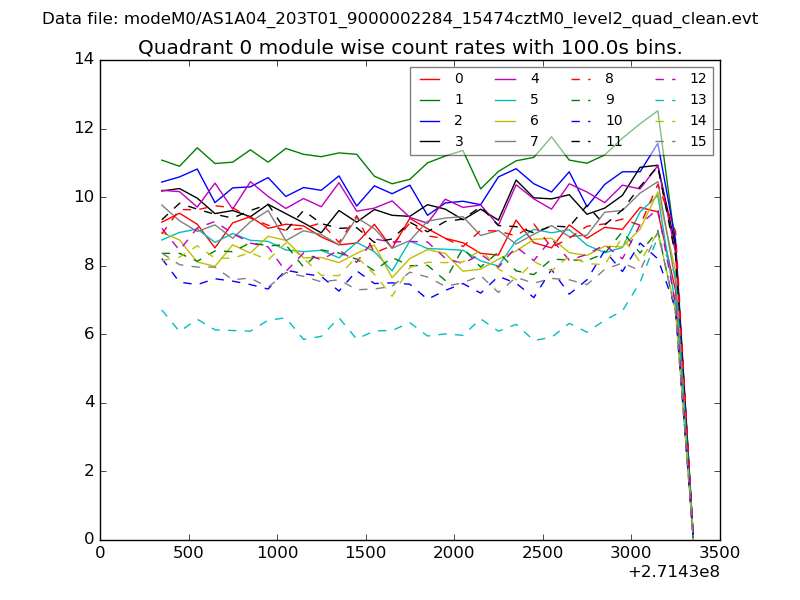 |
 |
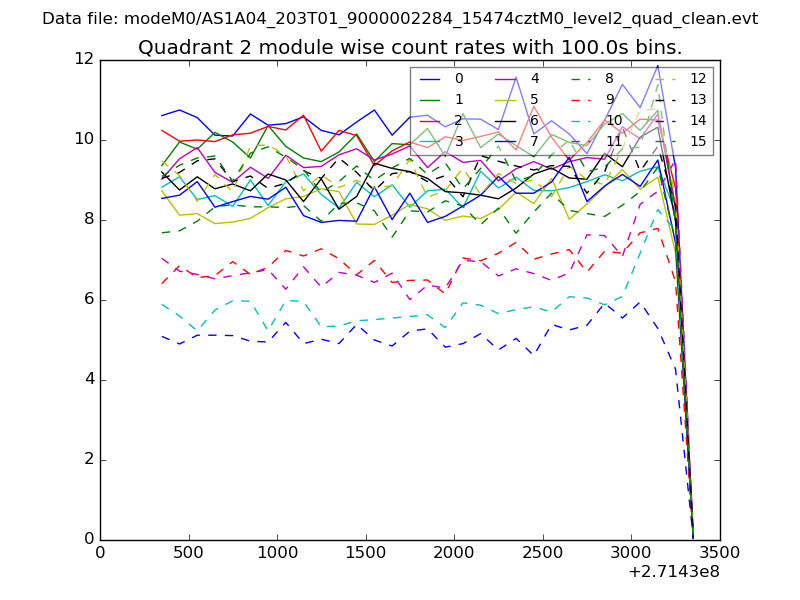
| Module-wise count rates for Quadrant B Data is divided into 100 sec bins |
 |
 |
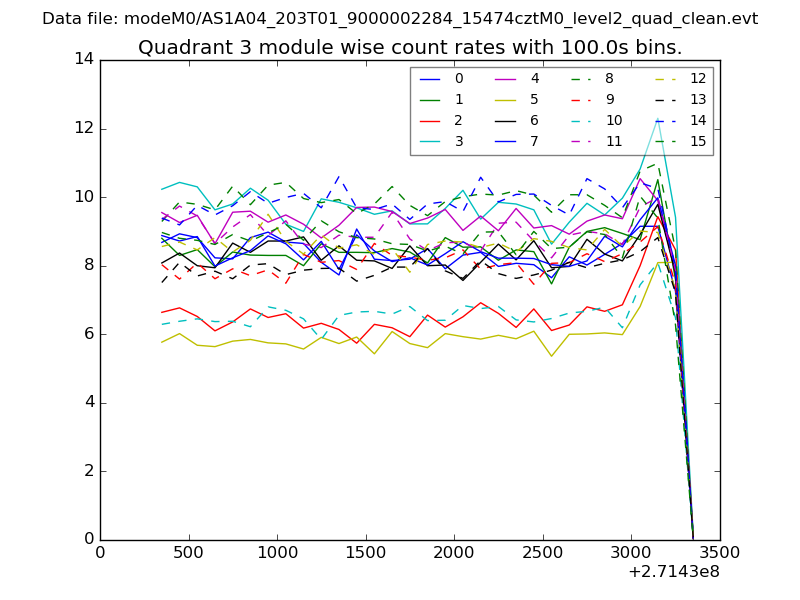
| Module-wise count rates for Quadrant C Data is divided into 100 sec bins |
 |
 |
| Module-wise count rates for Quadrant D Data is divided into 100 sec bins |
 |
 |
| Parameter | Plot |
|---|---|
| CZT HV Monitor | 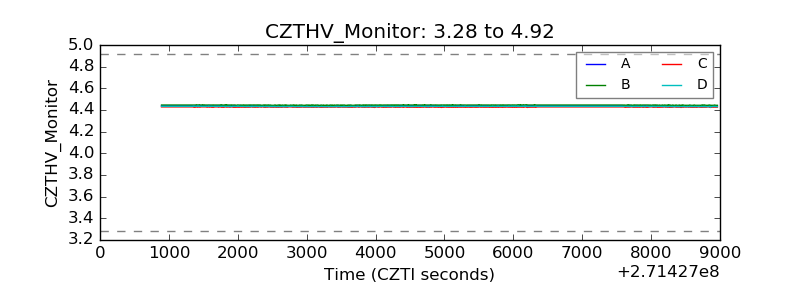 |
| D_VDD | 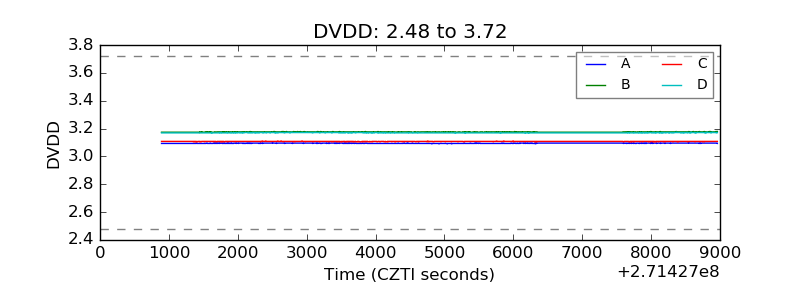 |
| Temperature 1 | 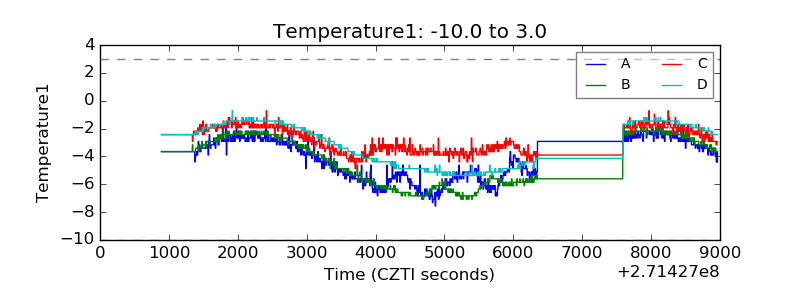 |
| Veto HV Monitor | 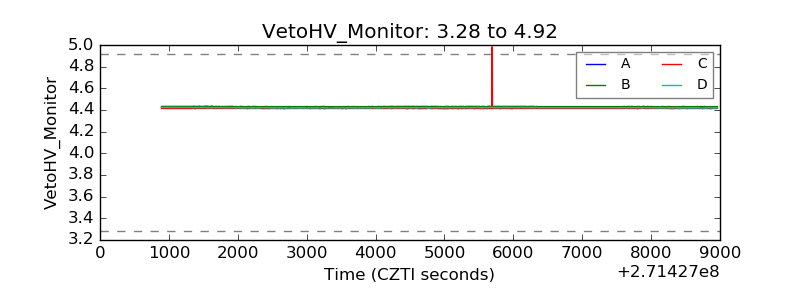 |
| Veto LLD | 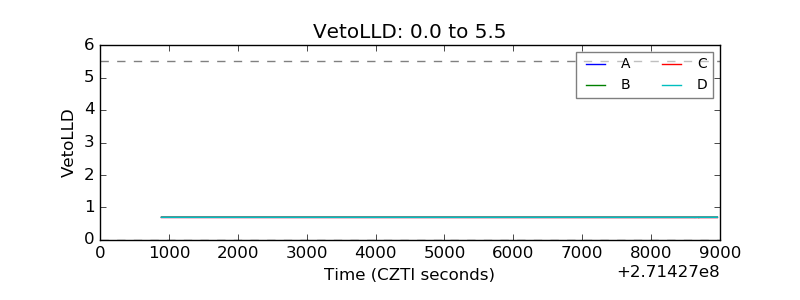 |
| Alpha Counter | 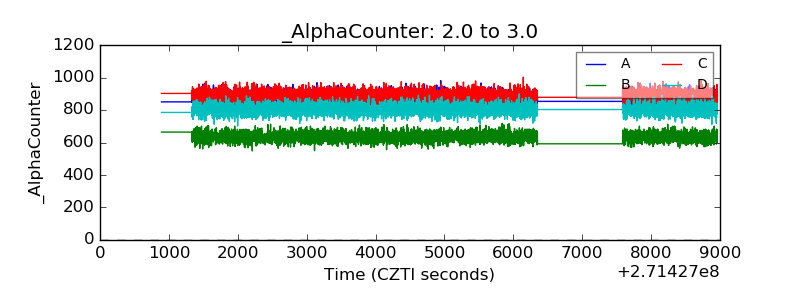 |
| _CPM_Rate | 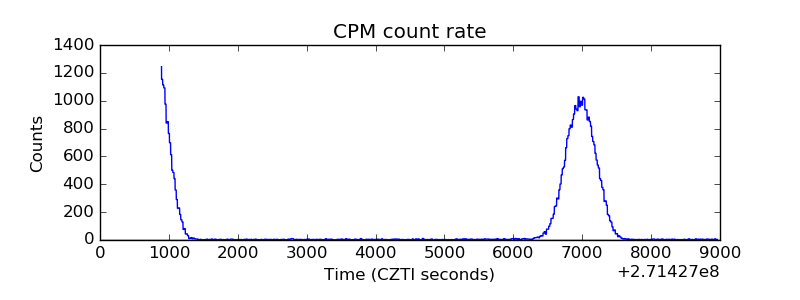 |
| CZT Counter | 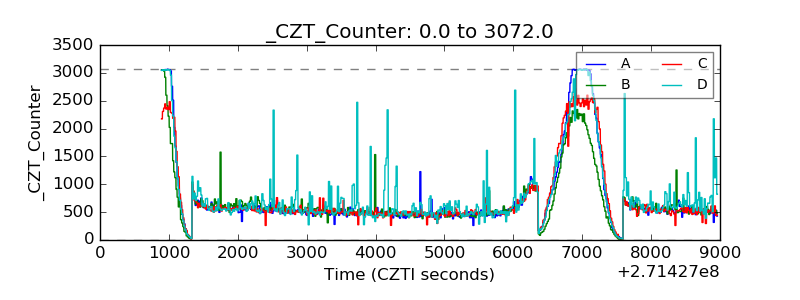 |
| +2.5 Volts monitor |  |
| +5 Volts monitor |  |
| _ROLL_ROT | 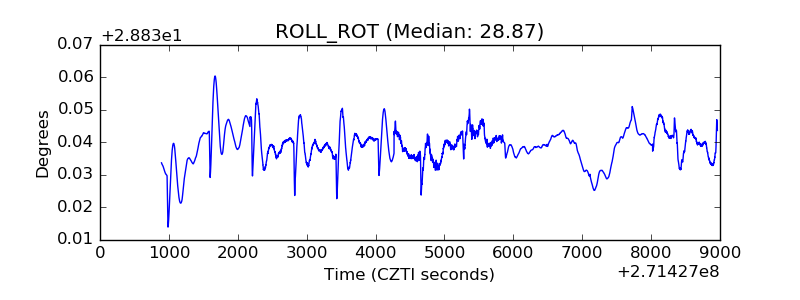 |
| _Roll_DEC | 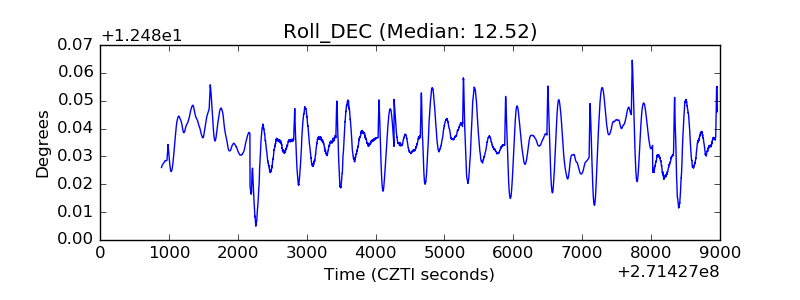 |
| _Roll_RA | 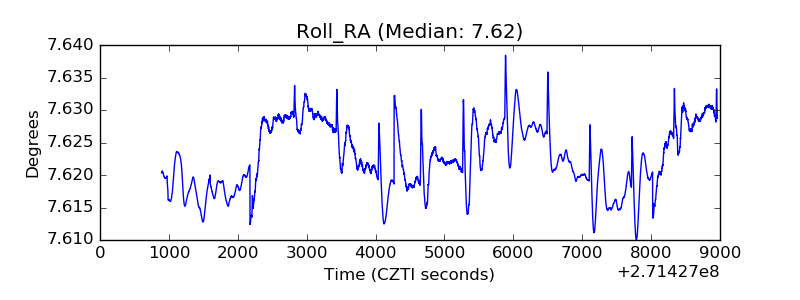 |
| Veto Counter | 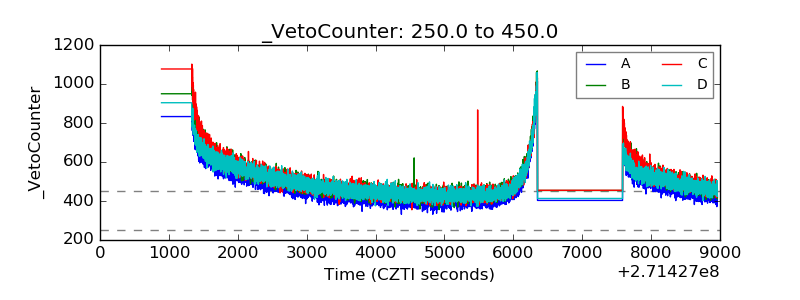 |