| Param | Original file | Final file |
|---|---|---|
| Filename | modeM0/AS1T02_077T01_9000002282cztM0_level2.fits | modeM0/AS1T02_077T01_9000002282cztM0_level2_quad_clean.evt |
| Size (bytes) | 145,834,560 | 136,428,480 |
| Size | 139.1 MB | 130.1 MB |
| Events in quadrant A | 920,652 | 826,404 |
| Events in quadrant B | 875,340 | 828,028 |
| Events in quadrant C | 896,884 | 806,494 |
| Events in quadrant D | 786,666 | 732,481 |
| Mode M9 | |||
|---|---|---|---|
| Quadrant | BADHDUFLAG | Total packets | Discarded packets |
| A | 0 | 34 | 0 |
| B | 0 | 34 | 0 |
| C | 0 | 34 | 0 |
| D | 0 | 34 | 0 |
| Mode SS | |||
|---|---|---|---|
| Quadrant | BADHDUFLAG | Total packets | Discarded packets |
| A | 0 | 276 | 0 |
| B | 0 | 276 | 0 |
| C | 0 | 276 | 0 |
| D | 0 | 276 | 0 |
| Mode M0 | |||
|---|---|---|---|
| Quadrant | BADHDUFLAG | Total packets | Discarded packets |
| A | 0 | 32225 | 0 |
| B | 0 | 30384 | 0 |
| C | 0 | 29464 | 0 |
| D | 0 | 32116 | 0 |
| Quadrant | Total seconds | Saturated seconds | Saturation percentage |
|---|---|---|---|
| A | 13571 | 287 | 2.114804% |
| B | 13571 | 169 | 1.245302% |
| C | 13571 | 105 | 0.773709% |
| D | 13571 | 233 | 1.716896% |
Noise dominated data is calculated using 1-second bins in cleaned event files. If a bin has >2000 counts, and if more than 50% of those come from <1% of pixels, then it is considered to be noise-dominated and hence unusable.
| Quadrant | # 1 sec bins | Bins with >0 counts | Bins with >2000 counts | High rate bins dominated by noise | Noise dominated (total time) | Noise dominated (detector-on time) | Marked lightcurve |
|---|---|---|---|---|---|---|---|
| A | 16085 | 13569 | 0 | 0 | 0.00% | 0.00% | 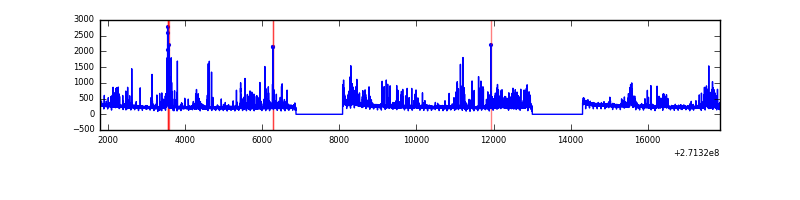 |
| B | 16085 | 13569 | 0 | 0 | 0.00% | 0.00% | 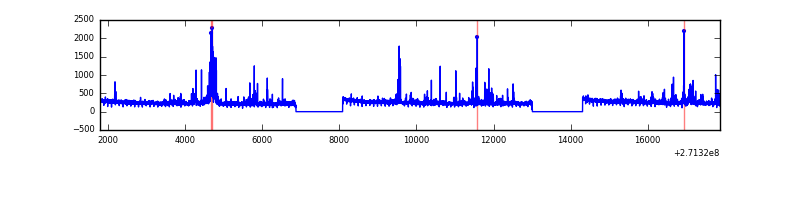 |
| C | 16085 | 13569 | 0 | 0 | 0.00% | 0.00% |  |
| D | 16085 | 13566 | 0 | 0 | 0.00% | 0.00% |  |
Top three noisy pixels from each quadrant. If the there are fewer than three noisy pixels in the level2.evt file, extra rows are filled as -1
| Pixel properties | Quadrant properties | ||||||
|---|---|---|---|---|---|---|---|
| Quadrant | DetID | PixID | Counts | Sigma | Mean | Median | Sigma |
| A | 0 | 29 | 914 | 11.85 | 239 | 229 | 57.8 |
| A | 0 | 30 | 710 | 8.32 | 239 | 229 | 57.8 |
| A | 7 | 110 | 704 | 8.22 | 239 | 229 | 57.8 |
| B | 2 | 9 | 681 | 9.62 | 232 | 224 | 47.5 |
| B | 5 | 128 | 592 | 7.75 | 232 | 224 | 47.5 |
| B | 5 | 225 | 576 | 7.41 | 232 | 224 | 47.5 |
| C | 1 | 81 | 674 | 7.36 | 236 | 224 | 61.1 |
| C | 1 | 80 | 649 | 6.96 | 236 | 224 | 61.1 |
| C | 12 | 250 | 647 | 6.92 | 236 | 224 | 61.1 |
| D | 15 | 46 | 601 | 6.5 | 225 | 208 | 60.5 |
| D | 6 | 231 | 569 | 5.97 | 225 | 208 | 60.5 |
| D | 6 | 67 | 559 | 5.81 | 225 | 208 | 60.5 |
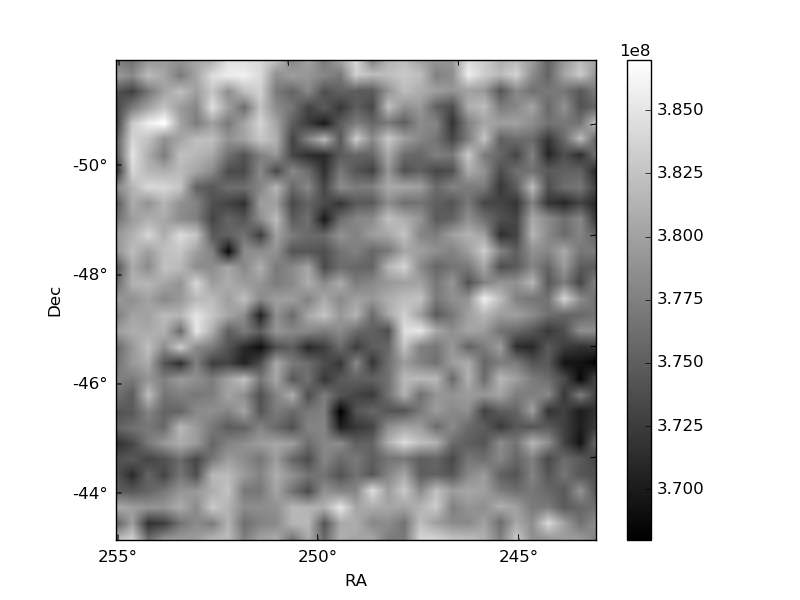
Histogram calculated using DETX and DETY for each event in the final _common_clean file
| Quadrant A | 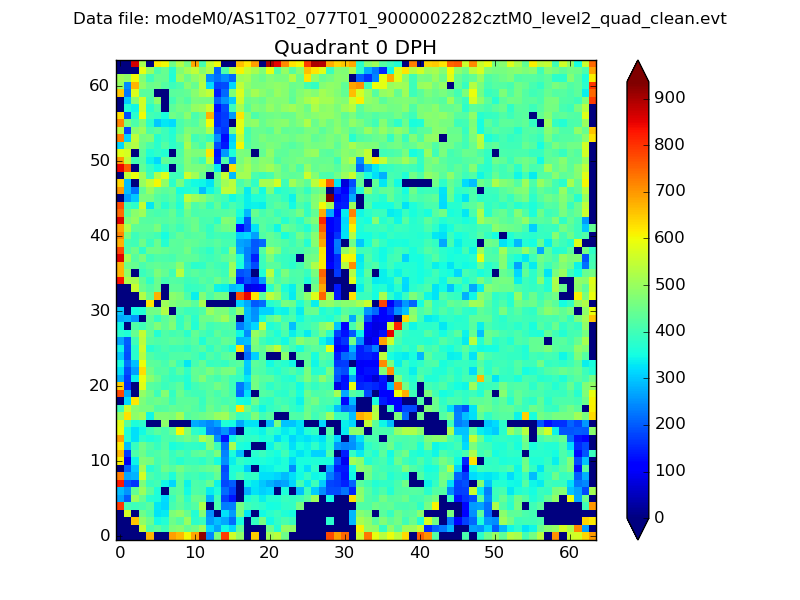 |
 |
Quadrant B |
|---|---|---|---|
| Quadrant D | 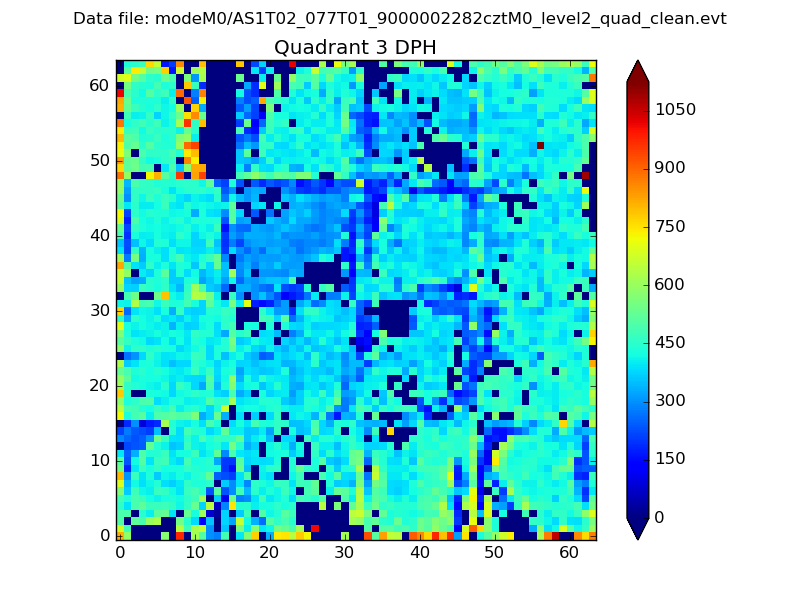 |
 |
Quadrant C |
| Plot type | Count rate plots | Images |
|---|---|---|
| Comparison with Poisson distribution Blue bars denote a histogram of data divided into 1 sec bins. Red curve is a Poisson curve with rate = median count rate of data. |
 |
 |
| Quadrant-wise count rates Data is divided into 100 sec bins |
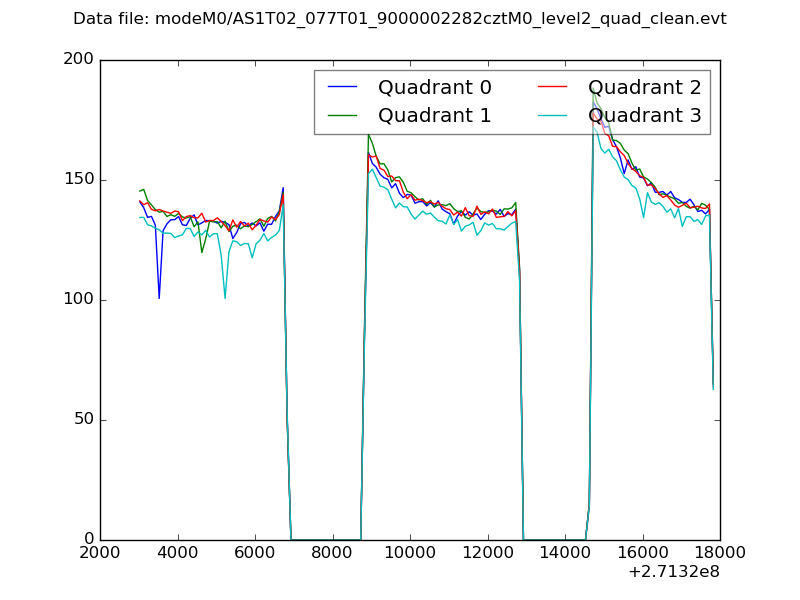 |
|
| Module-wise count rates for Quadrant A Data is divided into 100 sec bins |
 |
 |
| Module-wise count rates for Quadrant B Data is divided into 100 sec bins |
 |
 |
| Module-wise count rates for Quadrant C Data is divided into 100 sec bins |
 |
 |
| Module-wise count rates for Quadrant D Data is divided into 100 sec bins |
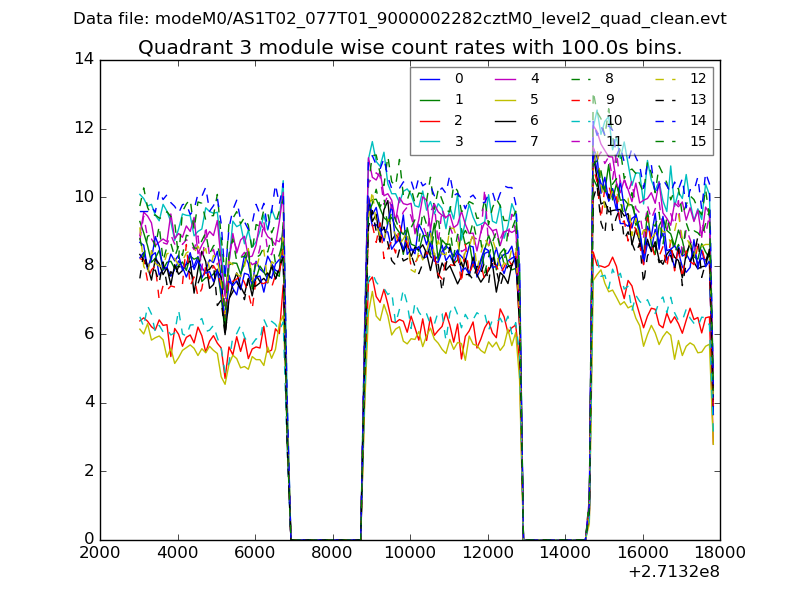 |
 |
| Parameter | Plot |
|---|---|
| CZT HV Monitor |  |
| D_VDD | 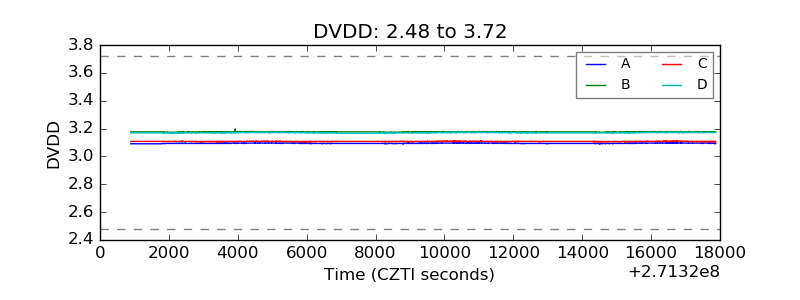 |
| Temperature 1 |  |
| Veto HV Monitor |  |
| Veto LLD |  |
| Alpha Counter |  |
| _CPM_Rate |  |
| CZT Counter |  |
| +2.5 Volts monitor |  |
| +5 Volts monitor |  |
| _ROLL_ROT |  |
| _Roll_DEC | 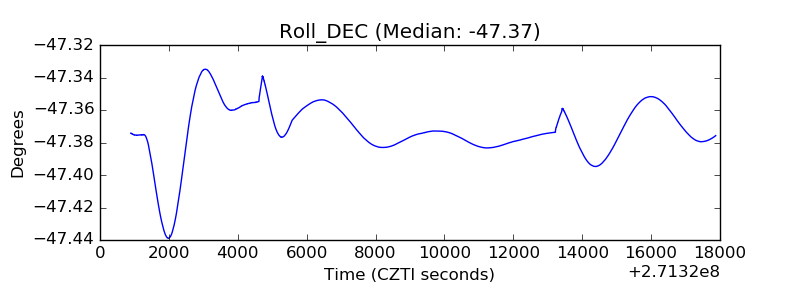 |
| _Roll_RA |  |
| Veto Counter |  |