| Param | Original file | Final file |
|---|---|---|
| Filename | modeM0/AS1T02_077T01_9000002282_15454cztM0_level2.evt | modeM0/AS1T02_077T01_9000002282_15454cztM0_level2_quad_clean.evt |
| Size (bytes) | 102,271,680 | 4,466,880 |
| Size | 97.5 MB | 4.3 MB |
| Events in quadrant A | 777,520 | 9,102 |
| Events in quadrant B | 739,755 | 9,392 |
| Events in quadrant C | 767,230 | 9,141 |
| Events in quadrant D | 720,819 | 8,633 |
| Mode M9 | |||
|---|---|---|---|
| Quadrant | BADHDUFLAG | Total packets | Discarded packets |
| A | 0 | 9 | 0 |
| B | 0 | 9 | 0 |
| C | 0 | 9 | 0 |
| D | 0 | 9 | 0 |
| Mode SS | |||
|---|---|---|---|
| Quadrant | BADHDUFLAG | Total packets | Discarded packets |
| A | 0 | 28 | 0 |
| B | 0 | 28 | 0 |
| C | 0 | 28 | 0 |
| D | 0 | 28 | 0 |
| Mode M0 | |||
|---|---|---|---|
| Quadrant | BADHDUFLAG | Total packets | Discarded packets |
| A | 0 | 3104 | 2 |
| B | 0 | 2957 | 1 |
| C | 0 | 3111 | 1 |
| D | 0 | 2866 | 1 |
| Quadrant | Total seconds | Saturated seconds | Saturation percentage |
|---|---|---|---|
| A | 1303 | 25 | 1.918649% |
| B | 1303 | 16 | 1.227936% |
| C | 1303 | 14 | 1.074444% |
| D | 1303 | 18 | 1.381427% |
Noise dominated data is calculated using 1-second bins in cleaned event files. If a bin has >2000 counts, and if more than 50% of those come from <1% of pixels, then it is considered to be noise-dominated and hence unusable.
| Quadrant | # 1 sec bins | Bins with >0 counts | Bins with >2000 counts | High rate bins dominated by noise | Noise dominated (total time) | Noise dominated (detector-on time) | Marked lightcurve |
|---|---|---|---|---|---|---|---|
| A | 1304 | 1304 | 5 | 5 | 0.38% | 0.38% | 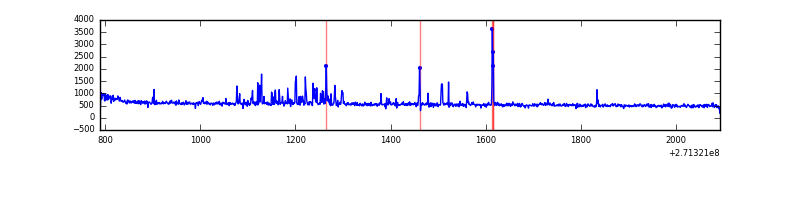 |
| B | 1304 | 1304 | 0 | 0 | 0.00% | 0.00% | 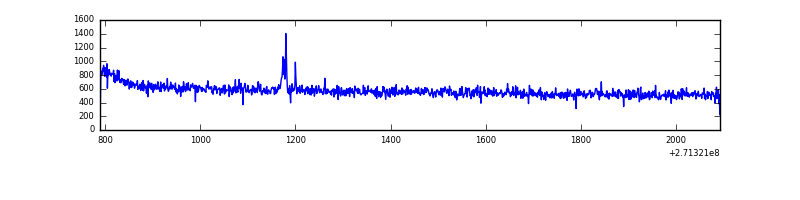 |
| C | 1304 | 1304 | 0 | 0 | 0.00% | 0.00% | 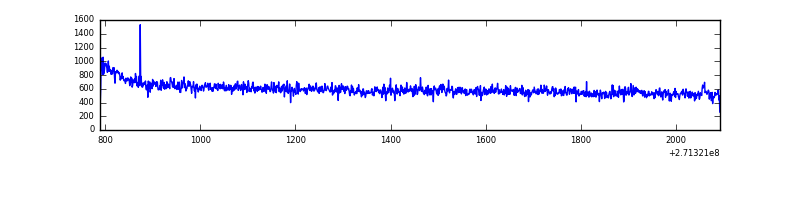 |
| D | 1304 | 1304 | 2 | 2 | 0.15% | 0.15% | 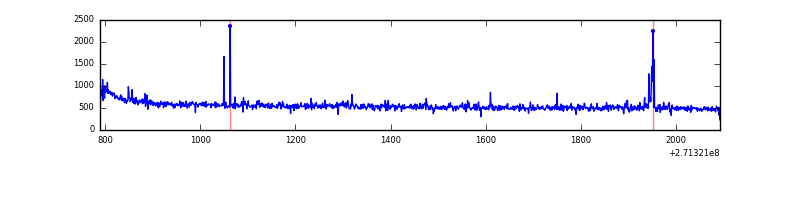 |
Top three noisy pixels from each quadrant. If the there are fewer than three noisy pixels in the level2.evt file, extra rows are filled as -1
| Pixel properties | Quadrant properties | ||||||
|---|---|---|---|---|---|---|---|
| Quadrant | DetID | PixID | Counts | Sigma | Mean | Median | Sigma |
| A | 14 | 238 | 39760 | 1030.98 | 185 | 181 | 38.4 |
| A | 14 | 237 | 14198 | 365.12 | 185 | 181 | 38.4 |
| A | 7 | 16 | 10256 | 262.44 | 185 | 181 | 38.4 |
| B | 0 | 214 | 9159 | 247.45 | 185 | 181 | 36.3 |
| B | 0 | 189 | 5434 | 144.78 | 185 | 181 | 36.3 |
| B | 12 | 111 | 3993 | 105.07 | 185 | 181 | 36.3 |
| C | 3 | 233 | 45124 | 1041.68 | 183 | 184 | 43.1 |
| C | 9 | 54 | 2158 | 45.74 | 183 | 184 | 43.1 |
| C | 14 | 225 | 1467 | 29.73 | 183 | 184 | 43.1 |
| D | 10 | 70 | 9249 | 198.83 | 183 | 177 | 45.6 |
| D | 5 | 222 | 6915 | 147.68 | 183 | 177 | 45.6 |
| D | 15 | 0 | 4721 | 99.59 | 183 | 177 | 45.6 |
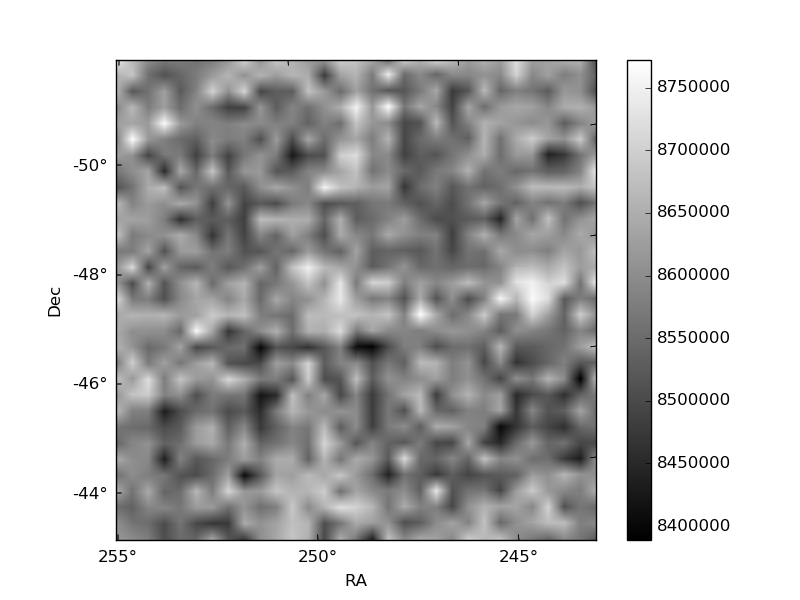
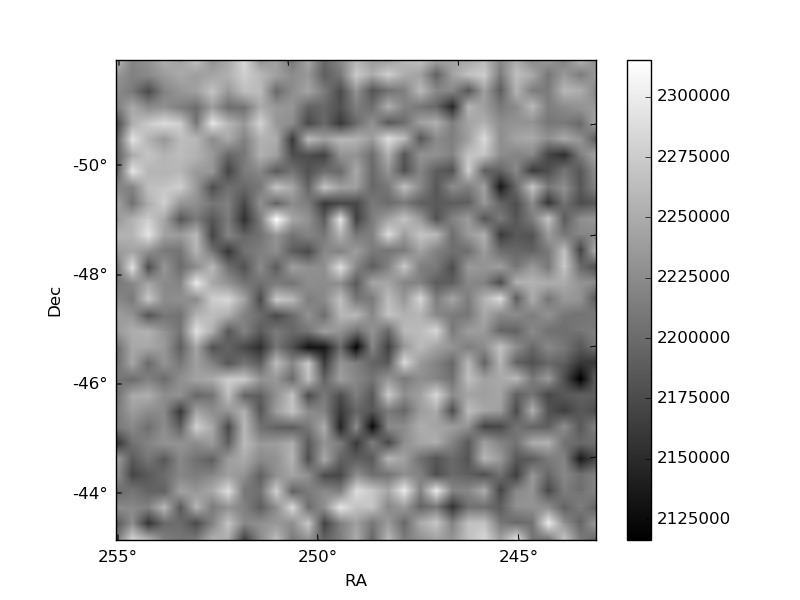
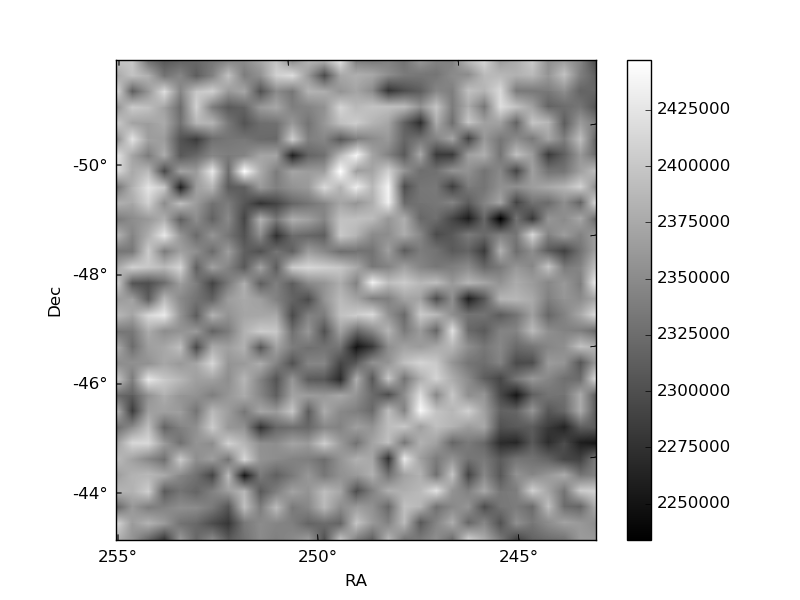
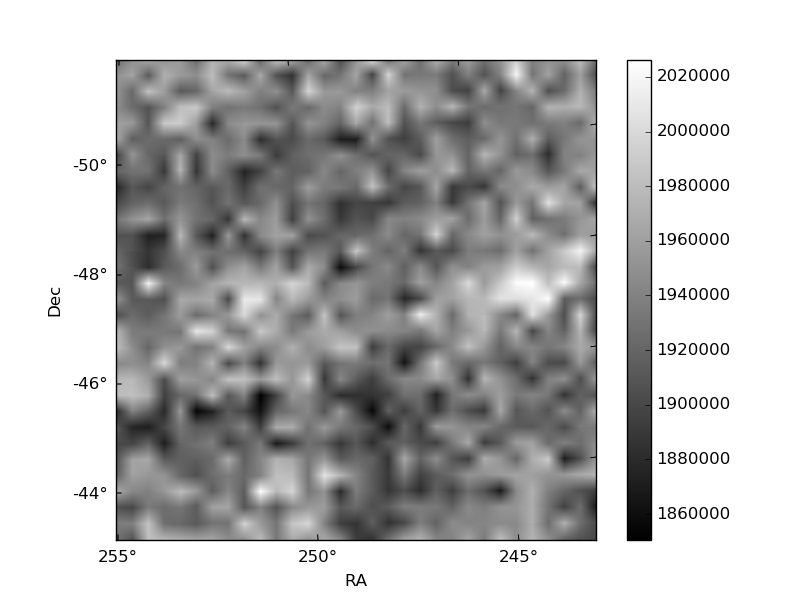
Histogram calculated using DETX and DETY for each event in the final _common_clean file
| Quadrant A | 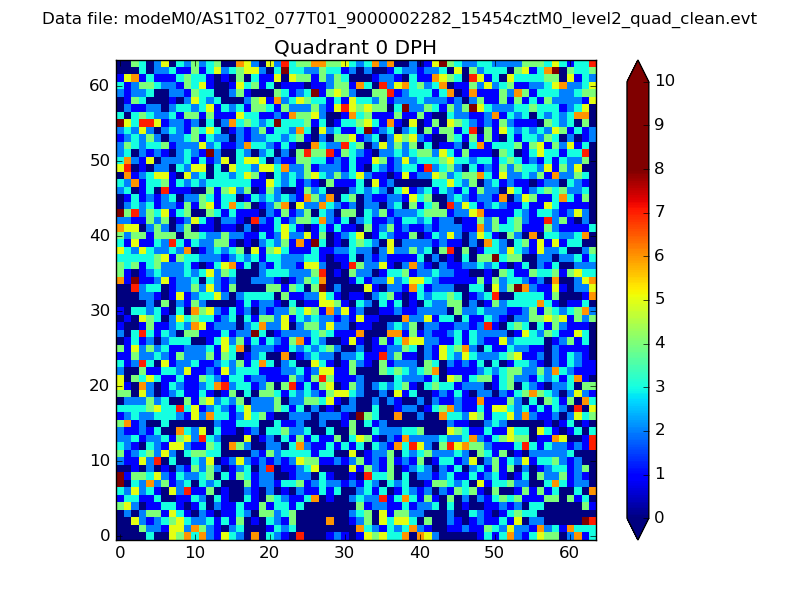 |
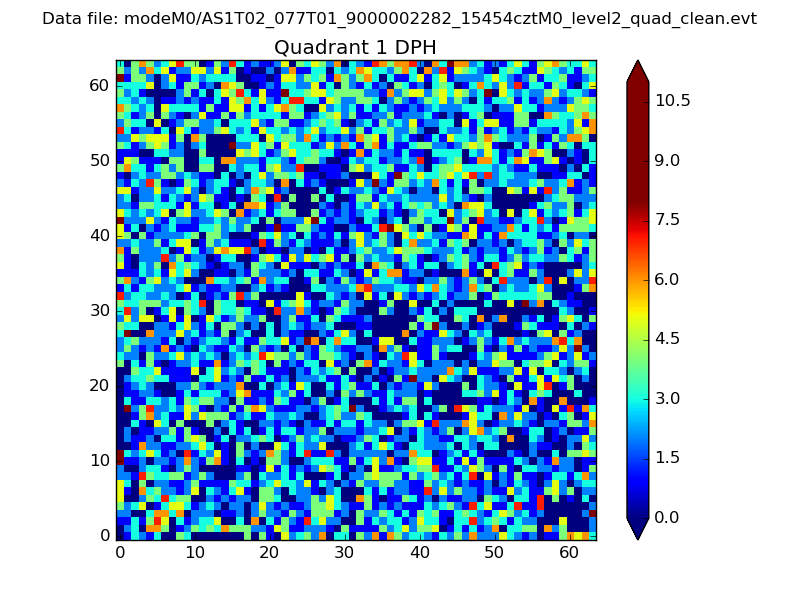 |
Quadrant B |
|---|---|---|---|
| Quadrant D | 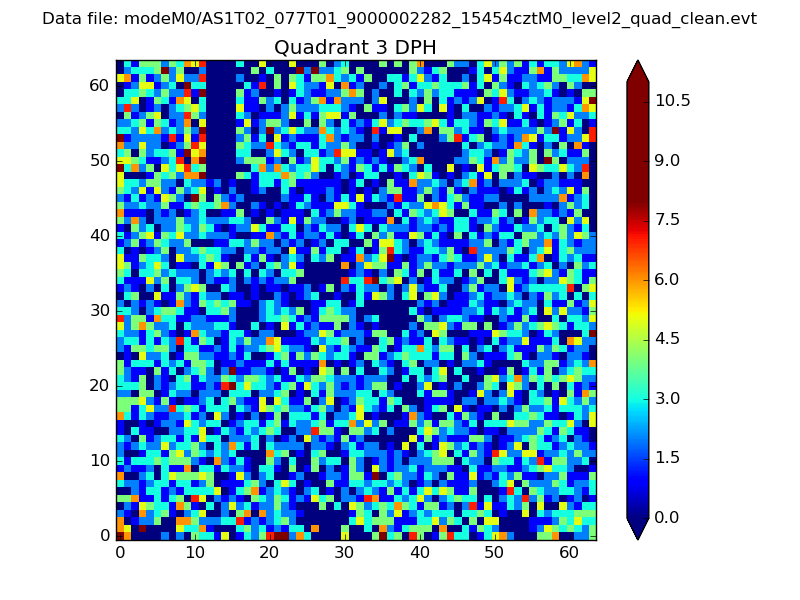 |
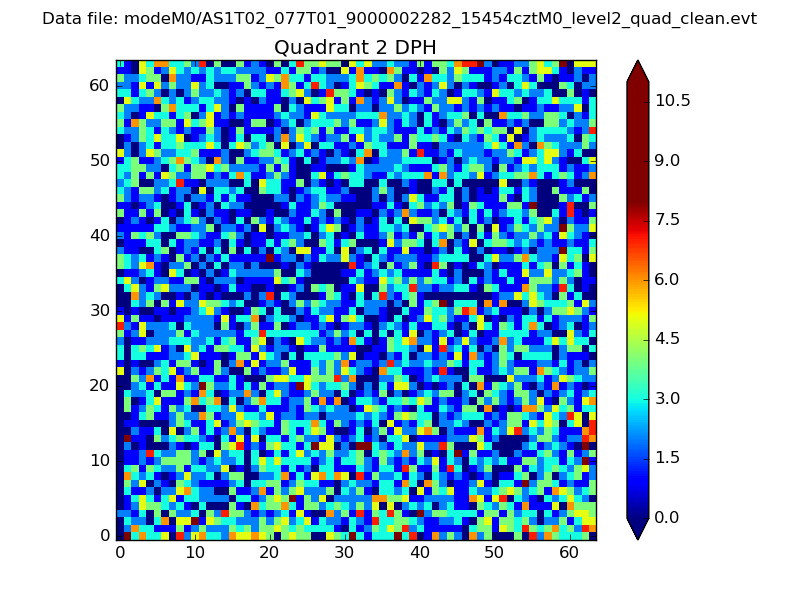 |
Quadrant C |
| Plot type | Count rate plots | Images |
|---|---|---|
| Comparison with Poisson distribution Blue bars denote a histogram of data divided into 1 sec bins. Red curve is a Poisson curve with rate = median count rate of data. |
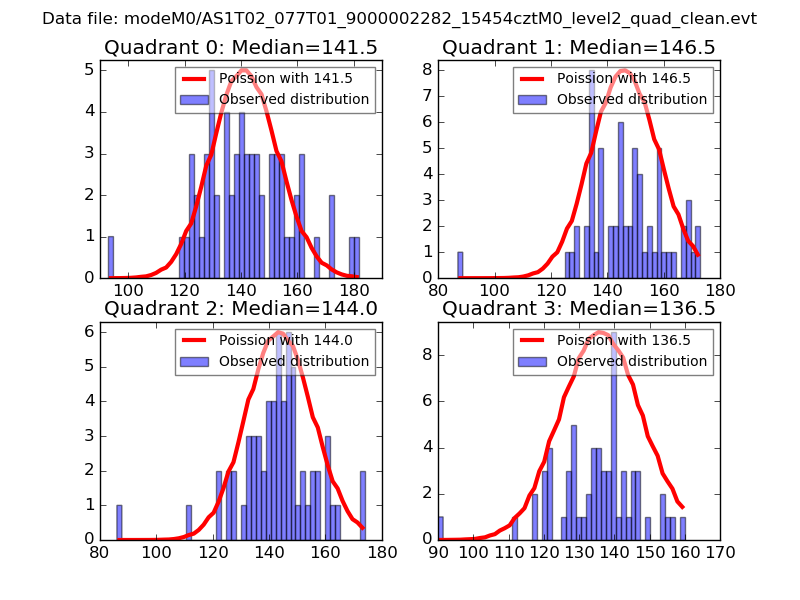 |
 |
| Quadrant-wise count rates Data is divided into 100 sec bins |
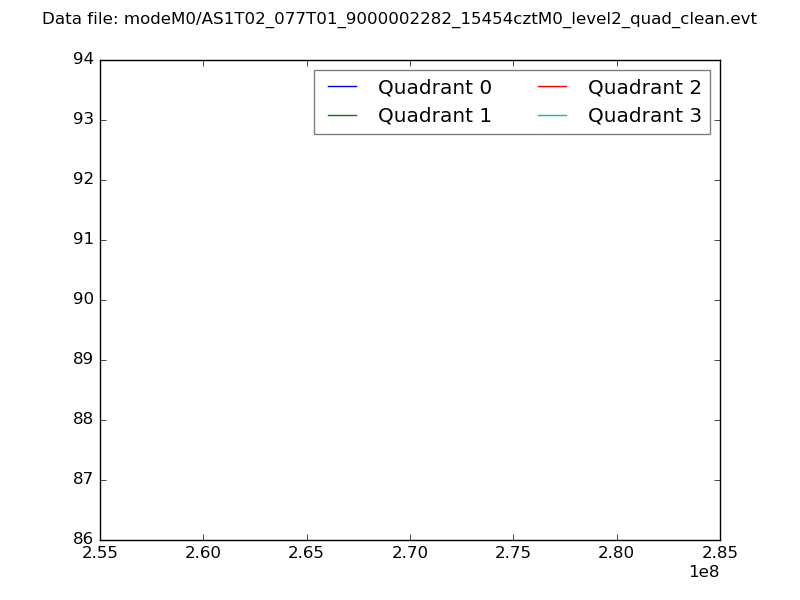 |
|
| Module-wise count rates for Quadrant A Data is divided into 100 sec bins |
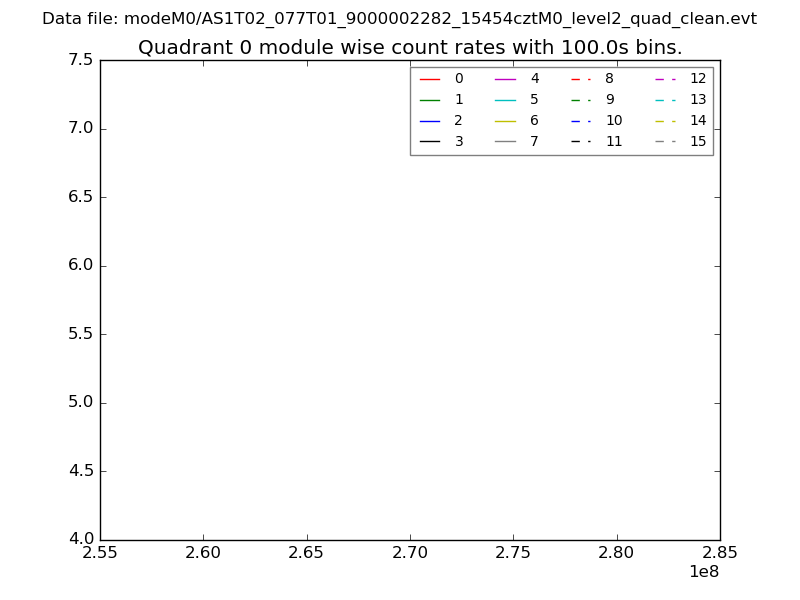 |
 |
| Module-wise count rates for Quadrant B Data is divided into 100 sec bins |
 |
 |
| Module-wise count rates for Quadrant C Data is divided into 100 sec bins |
 |
 |
| Module-wise count rates for Quadrant D Data is divided into 100 sec bins |
 |
 |
| Parameter | Plot |
|---|---|
| CZT HV Monitor | 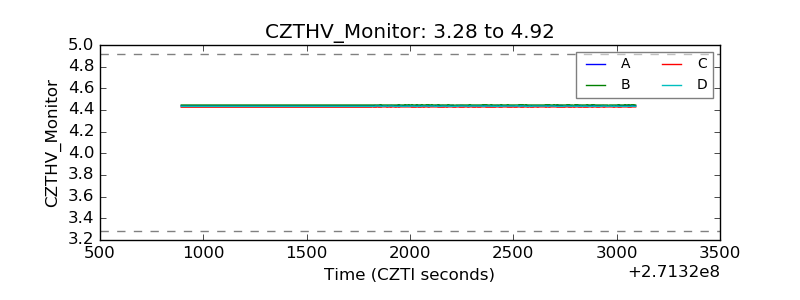 |
| D_VDD | 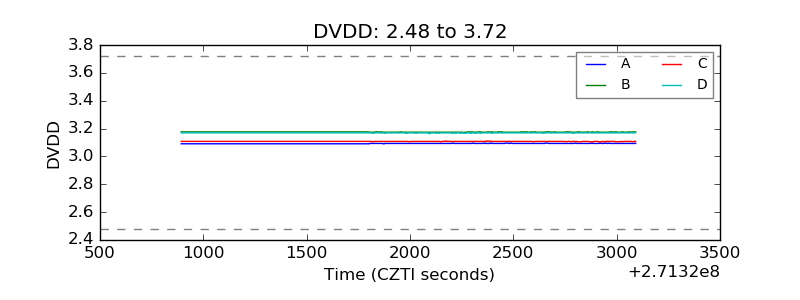 |
| Temperature 1 | 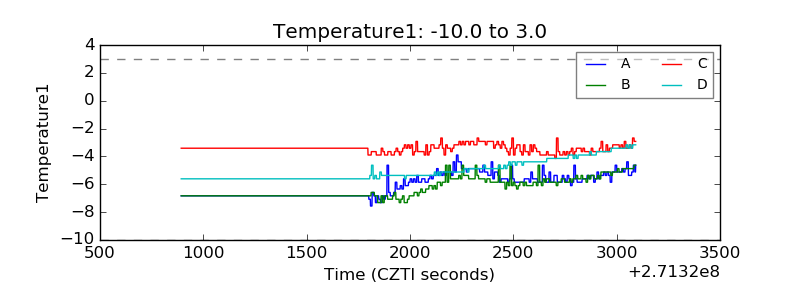 |
| Veto HV Monitor | 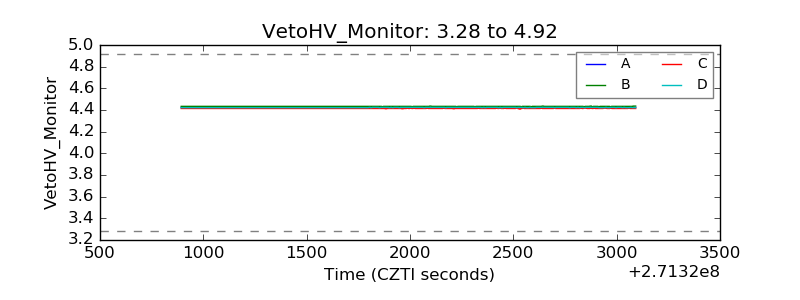 |
| Veto LLD | 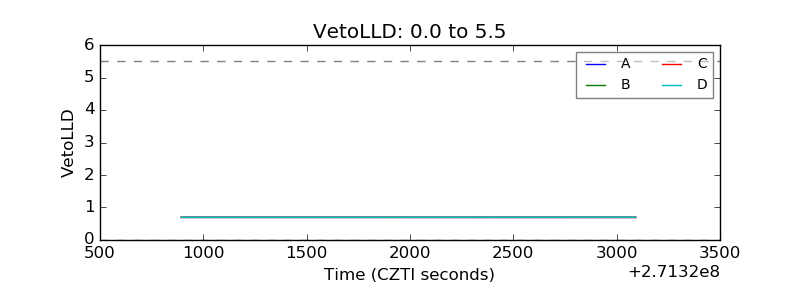 |
| Alpha Counter | 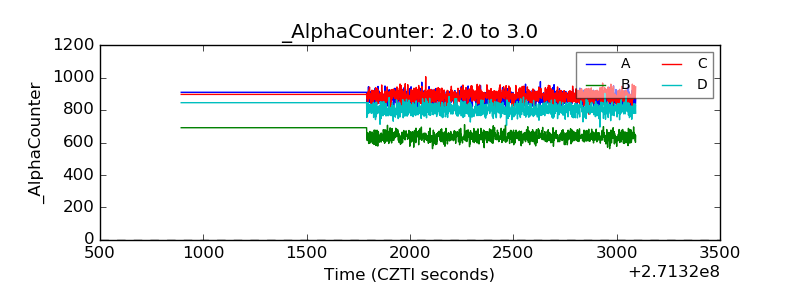 |
| _CPM_Rate | 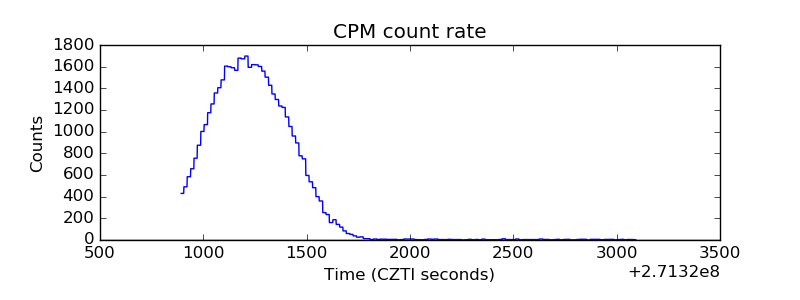 |
| CZT Counter | 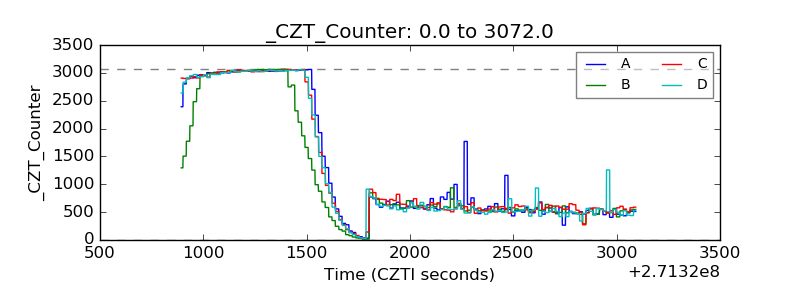 |
| +2.5 Volts monitor |  |
| +5 Volts monitor |  |
| _ROLL_ROT | 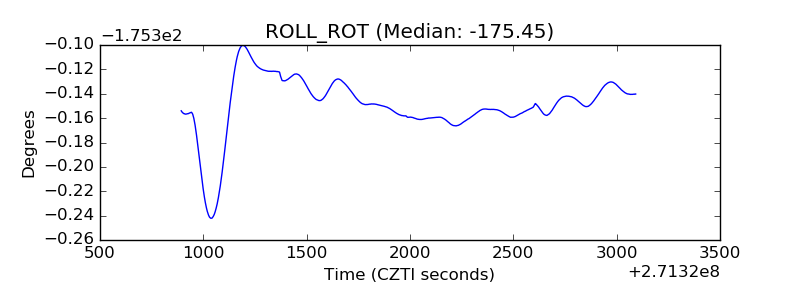 |
| _Roll_DEC |  |
| _Roll_RA | 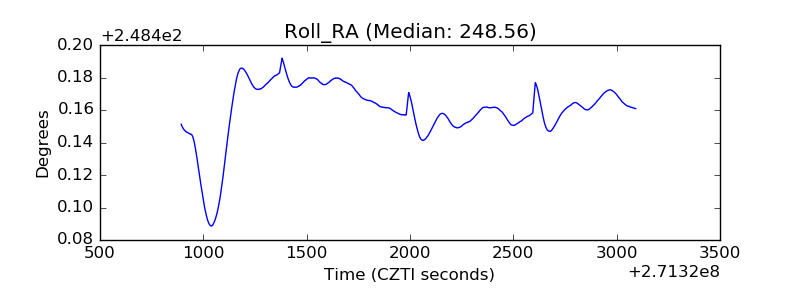 |
| Veto Counter | 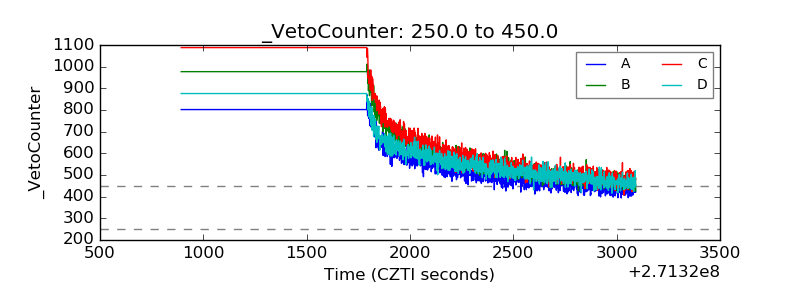 |