| Param | Original file | Final file |
|---|---|---|
| Filename | modeM0/AS1T02_077T01_9000002282_15456cztM0_level2.evt | modeM0/AS1T02_077T01_9000002282_15456cztM0_level2_quad_clean.evt |
| Size (bytes) | 500,184,000 | 91,019,520 |
| Size | 477.0 MB | 86.8 MB |
| Events in quadrant A | 3,732,022 | 580,012 |
| Events in quadrant B | 3,545,989 | 588,698 |
| Events in quadrant C | 3,371,460 | 589,833 |
| Events in quadrant D | 4,068,675 | 555,818 |
| Mode M9 | |||
|---|---|---|---|
| Quadrant | BADHDUFLAG | Total packets | Discarded packets |
| A | 0 | 14 | 0 |
| B | 0 | 14 | 0 |
| C | 0 | 14 | 0 |
| D | 0 | 15 | 0 |
| Mode SS | |||
|---|---|---|---|
| Quadrant | BADHDUFLAG | Total packets | Discarded packets |
| A | 0 | 130 | 0 |
| B | 0 | 130 | 0 |
| C | 0 | 130 | 0 |
| D | 0 | 130 | 0 |
| Mode M0 | |||
|---|---|---|---|
| Quadrant | BADHDUFLAG | Total packets | Discarded packets |
| A | 0 | 15129 | 3 |
| B | 0 | 14480 | 2 |
| C | 0 | 14072 | 2 |
| D | 0 | 16113 | 2 |
| Quadrant | Total seconds | Saturated seconds | Saturation percentage |
|---|---|---|---|
| A | 6331 | 186 | 2.937924% |
| B | 6331 | 118 | 1.863845% |
| C | 6331 | 75 | 1.184647% |
| D | 6331 | 155 | 2.448270% |
Noise dominated data is calculated using 1-second bins in cleaned event files. If a bin has >2000 counts, and if more than 50% of those come from <1% of pixels, then it is considered to be noise-dominated and hence unusable.
| Quadrant | # 1 sec bins | Bins with >0 counts | Bins with >2000 counts | High rate bins dominated by noise | Noise dominated (total time) | Noise dominated (detector-on time) | Marked lightcurve |
|---|---|---|---|---|---|---|---|
| A | 7542 | 6332 | 61 | 61 | 0.81% | 0.96% | 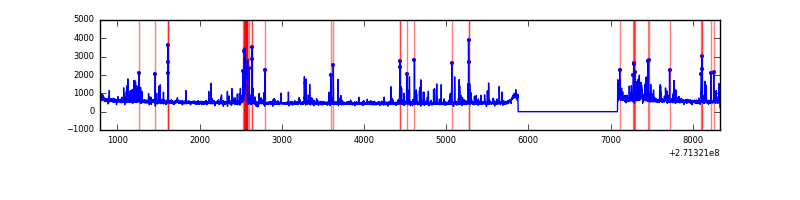 |
| B | 7542 | 6332 | 37 | 37 | 0.49% | 0.58% | 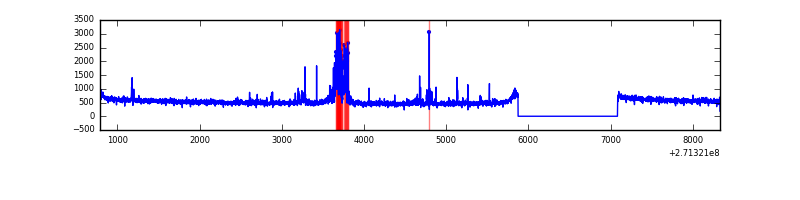 |
| C | 7542 | 6332 | 1 | 1 | 0.01% | 0.02% | 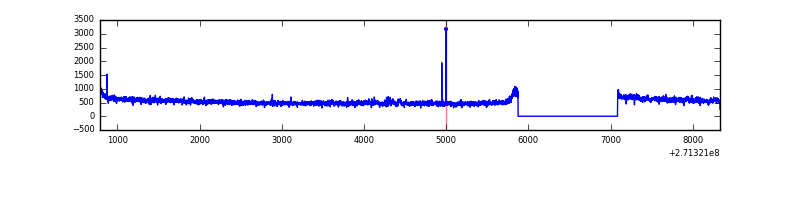 |
| D | 7542 | 6332 | 96 | 96 | 1.27% | 1.52% | 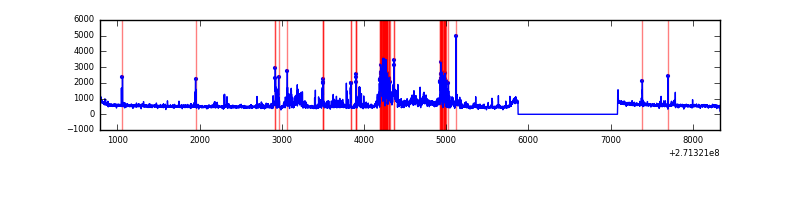 |
Top three noisy pixels from each quadrant. If the there are fewer than three noisy pixels in the level2.evt file, extra rows are filled as -1
| Pixel properties | Quadrant properties | ||||||
|---|---|---|---|---|---|---|---|
| Quadrant | DetID | PixID | Counts | Sigma | Mean | Median | Sigma |
| A | 14 | 238 | 260697 | 1581.35 | 828 | 813 | 164.3 |
| A | 9 | 143 | 136827 | 827.62 | 828 | 813 | 164.3 |
| A | 14 | 237 | 96650 | 583.15 | 828 | 813 | 164.3 |
| B | 4 | 142 | 200076 | 1290.96 | 825 | 808 | 154.4 |
| B | 0 | 189 | 34069 | 215.48 | 825 | 808 | 154.4 |
| B | 0 | 229 | 22811 | 142.55 | 825 | 808 | 154.4 |
| C | 3 | 233 | 207416 | 1130.39 | 807 | 816 | 182.8 |
| C | 10 | 22 | 9960 | 50.03 | 807 | 816 | 182.8 |
| C | 13 | 61 | 5868 | 27.64 | 807 | 816 | 182.8 |
| D | 5 | 222 | 669577 | 3380.04 | 810 | 785 | 197.9 |
| D | 1 | 52 | 240580 | 1211.91 | 810 | 785 | 197.9 |
| D | 7 | 38 | 25063 | 122.7 | 810 | 785 | 197.9 |
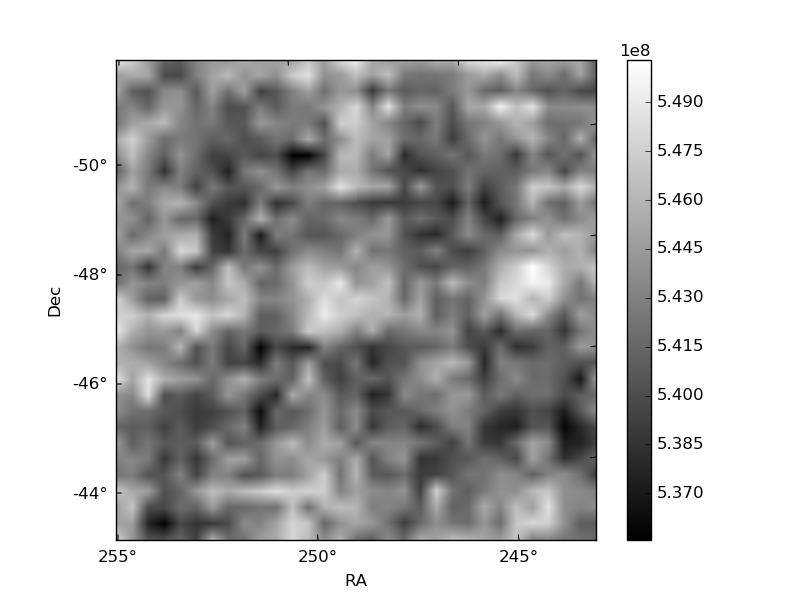
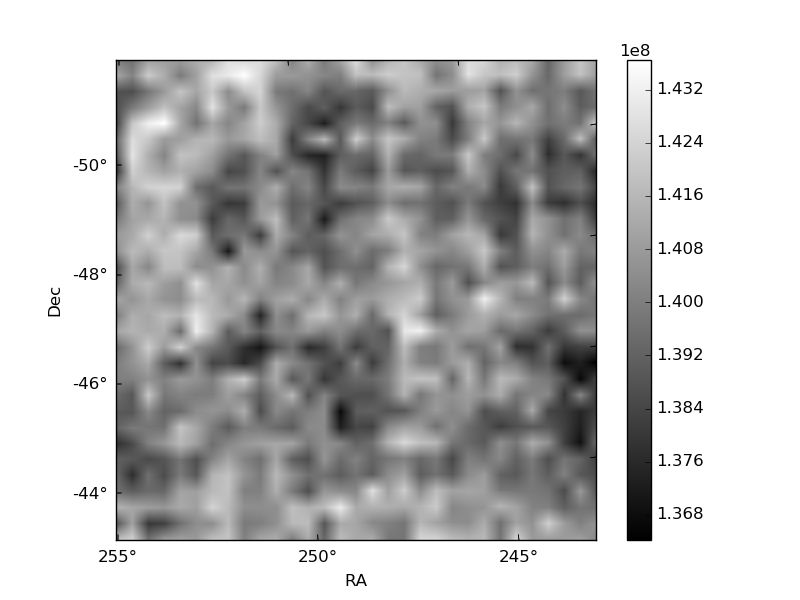
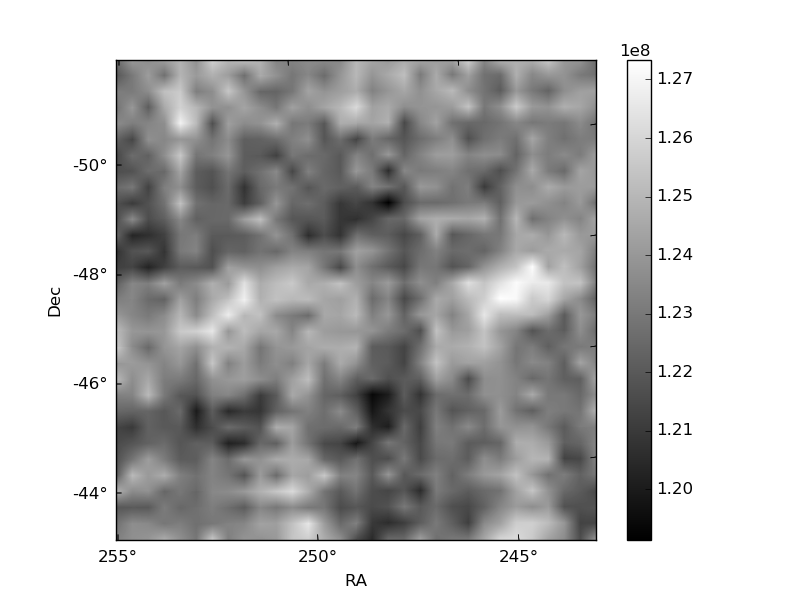
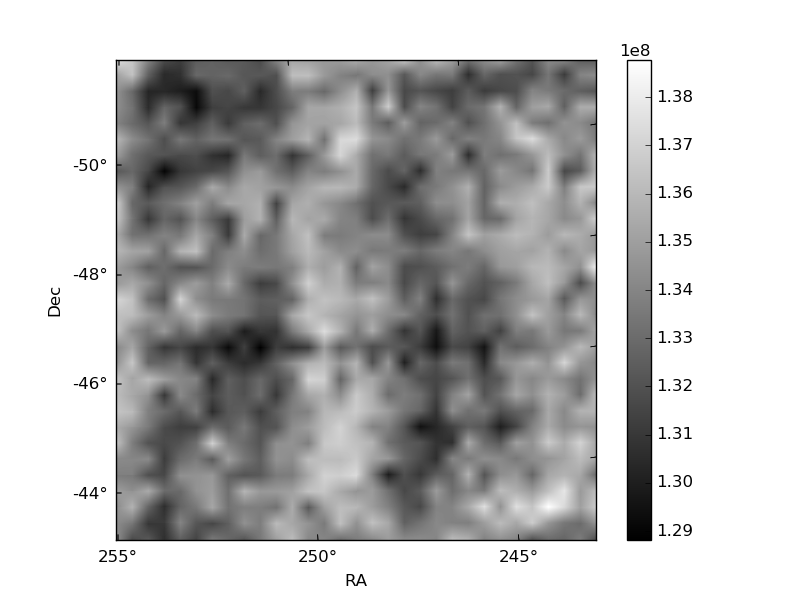
Histogram calculated using DETX and DETY for each event in the final _common_clean file
| Quadrant A |  |
 |
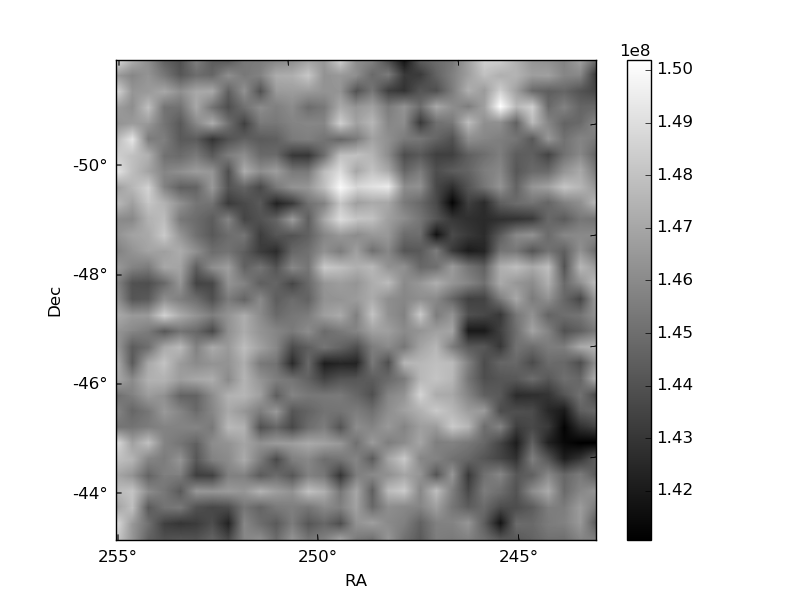
Quadrant B |
|---|---|---|---|
| Quadrant D |  |
 |
Quadrant C |
| Plot type | Count rate plots | Images |
|---|---|---|
| Comparison with Poisson distribution Blue bars denote a histogram of data divided into 1 sec bins. Red curve is a Poisson curve with rate = median count rate of data. |
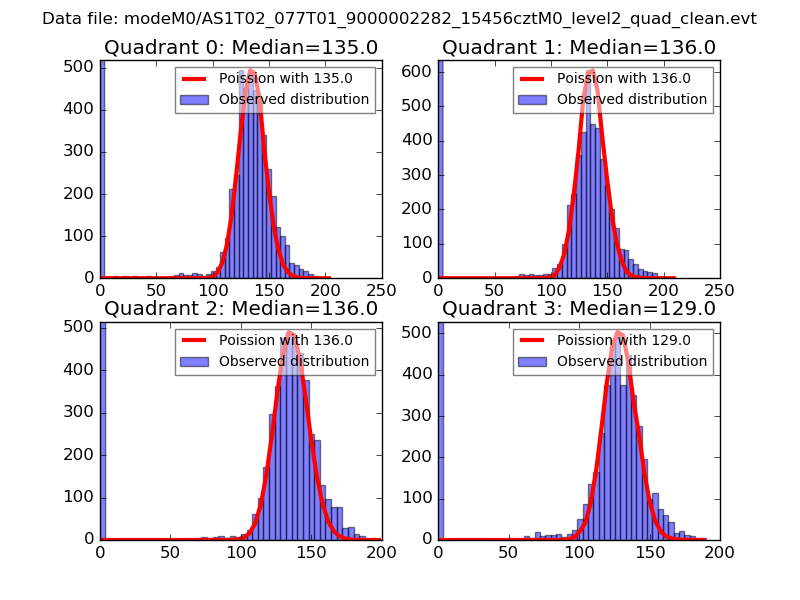 |
 |
| Quadrant-wise count rates Data is divided into 100 sec bins |
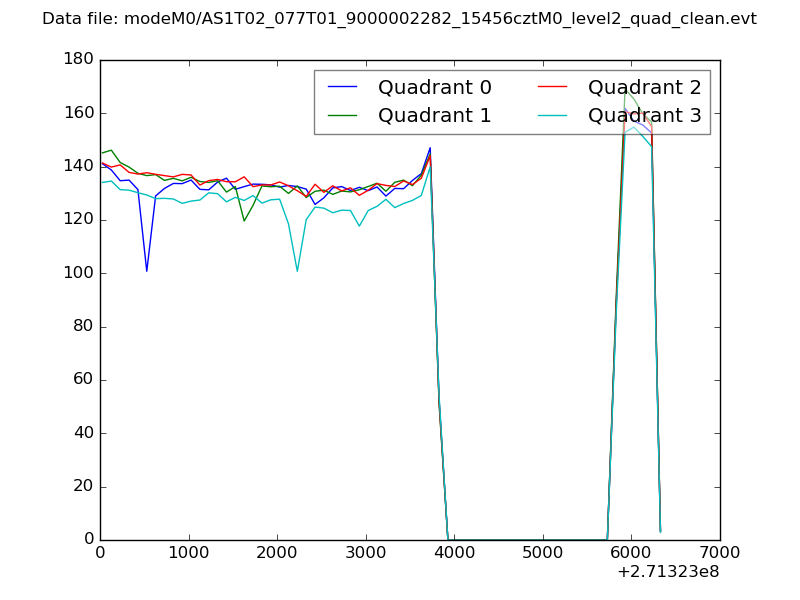 |
|
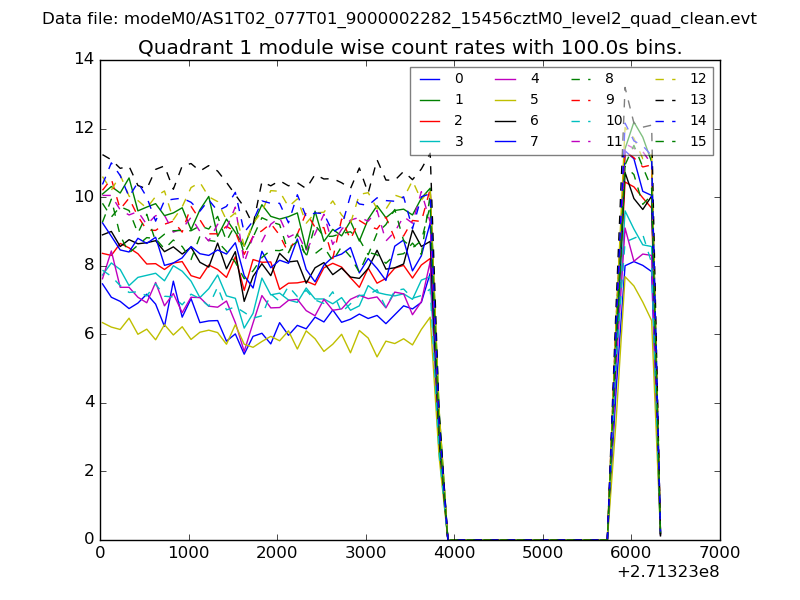
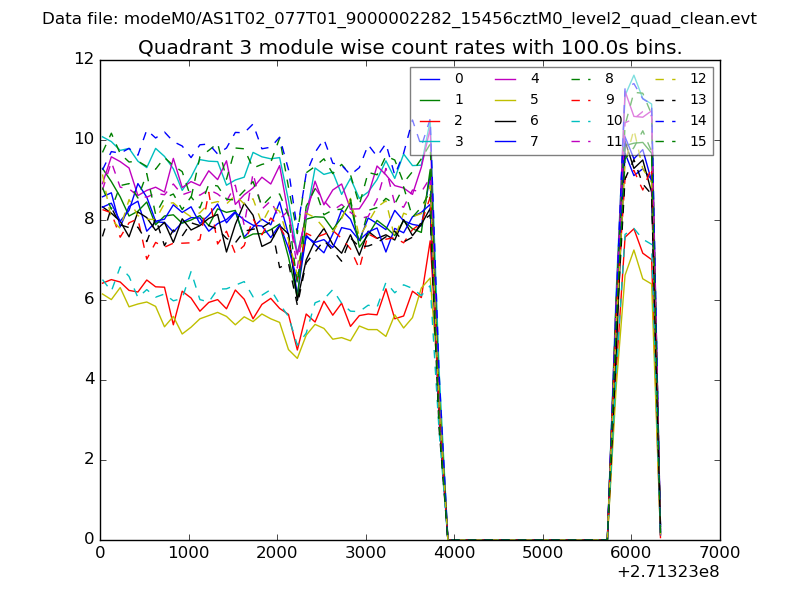
| Module-wise count rates for Quadrant A Data is divided into 100 sec bins |
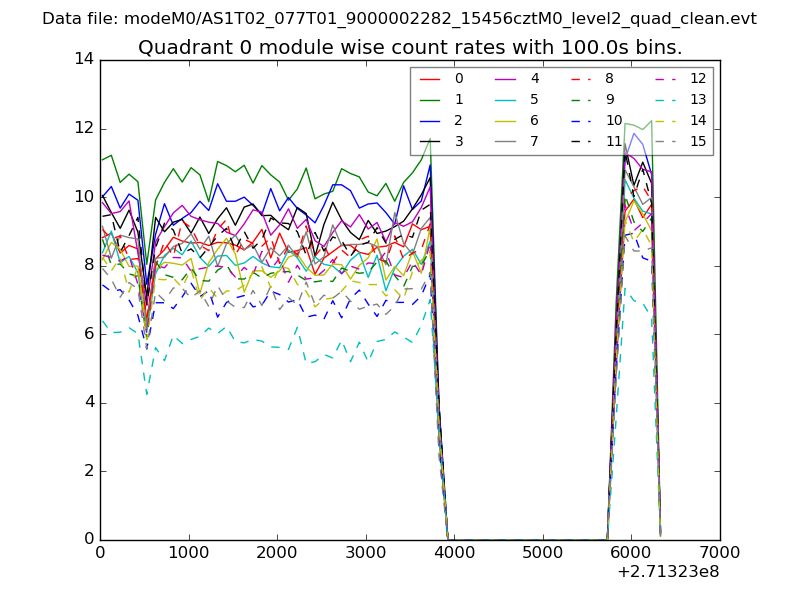 |
 |
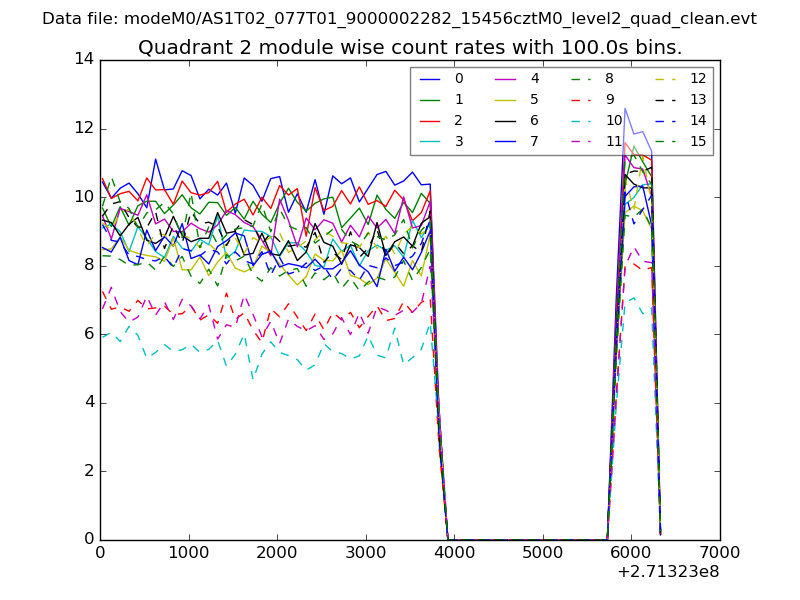
| Module-wise count rates for Quadrant B Data is divided into 100 sec bins |
 |
 |
| Module-wise count rates for Quadrant C Data is divided into 100 sec bins |
 |
 |
| Module-wise count rates for Quadrant D Data is divided into 100 sec bins |
 |
 |
| Parameter | Plot |
|---|---|
| CZT HV Monitor | 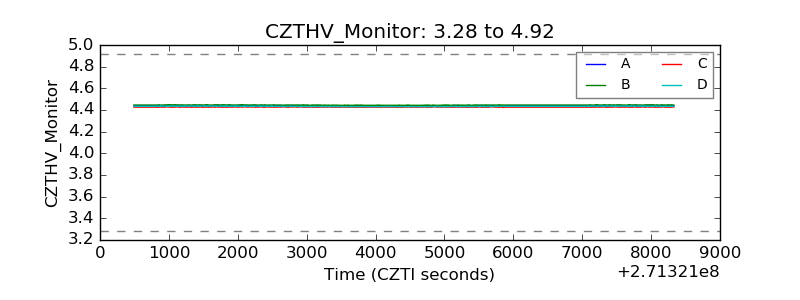 |
| D_VDD | 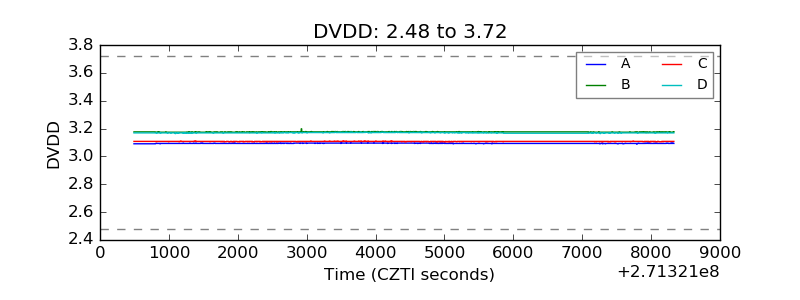 |
| Temperature 1 | 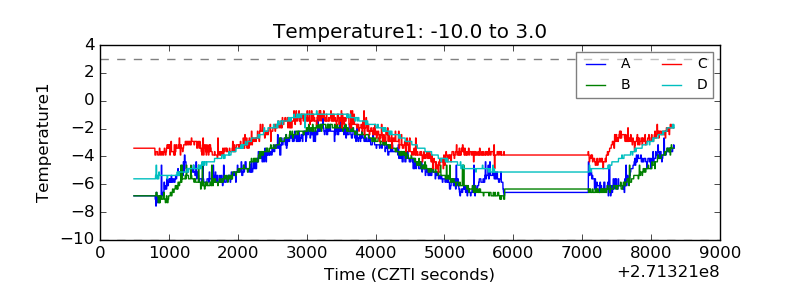 |
| Veto HV Monitor |  |
| Veto LLD | 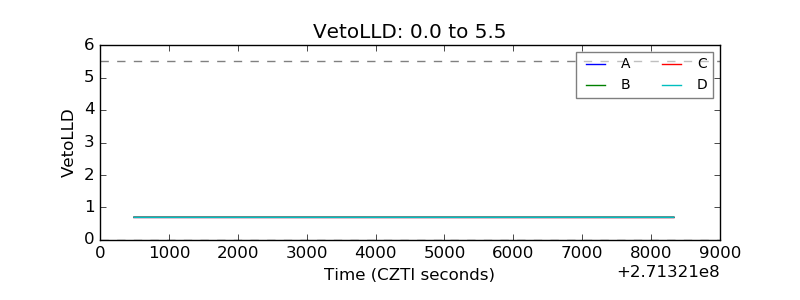 |
| Alpha Counter | 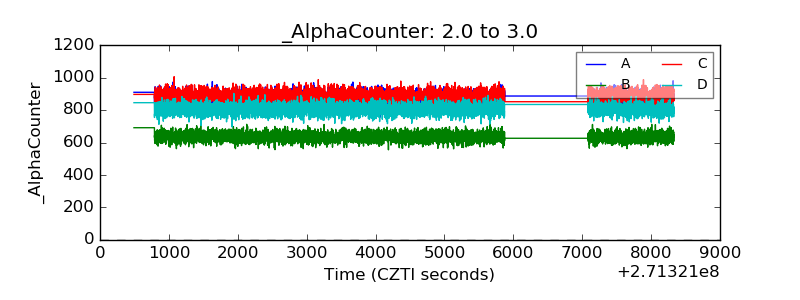 |
| _CPM_Rate | 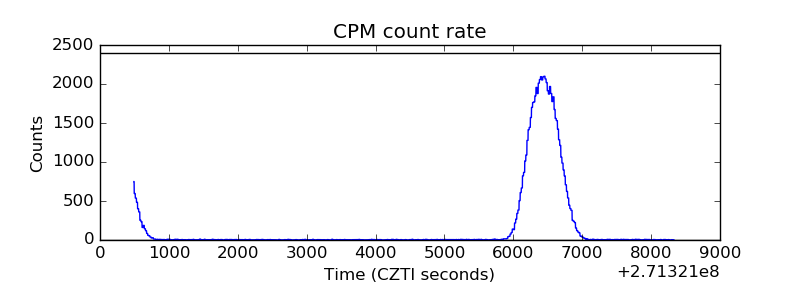 |
| CZT Counter |  |
| +2.5 Volts monitor |  |
| +5 Volts monitor | 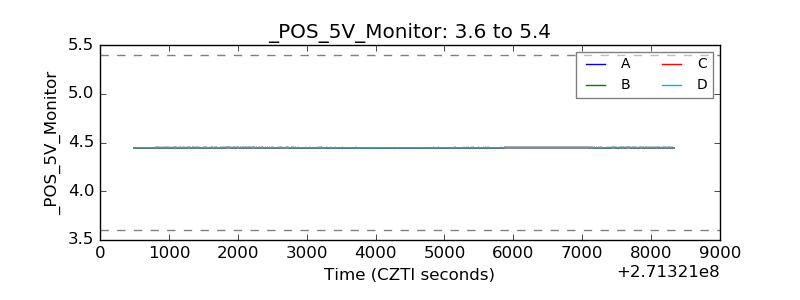 |
| _ROLL_ROT | 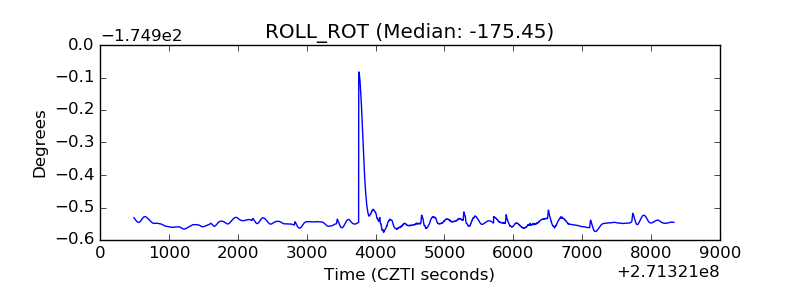 |
| _Roll_DEC |  |
| _Roll_RA | 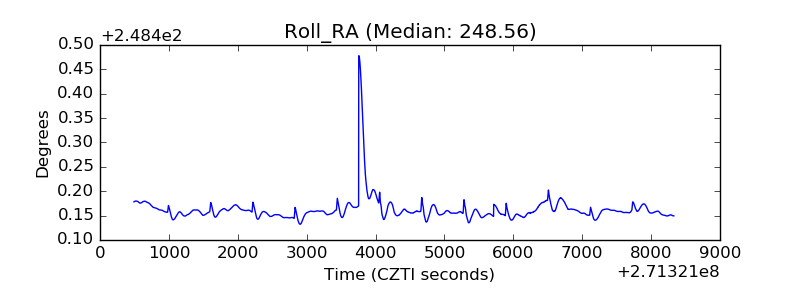 |
| Veto Counter | 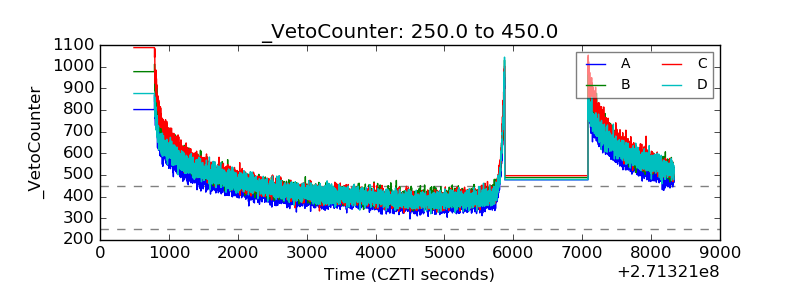 |