| Param | Original file | Final file |
|---|---|---|
| Filename | modeM0/AS1T02_082T01_9000002286cztM0_level2.fits | modeM0/AS1T02_082T01_9000002286cztM0_level2_quad_clean.evt |
| Size (bytes) | 408,939,840 | 415,336,320 |
| Size | 390.0 MB | 396.1 MB |
| Events in quadrant A | 2,462,020 | 2,483,755 |
| Events in quadrant B | 2,370,800 | 2,465,107 |
| Events in quadrant C | 2,421,430 | 2,414,619 |
| Events in quadrant D | 2,112,054 | 2,196,856 |
| Mode M0 | |||
|---|---|---|---|
| Quadrant | BADHDUFLAG | Total packets | Discarded packets |
| A | 0 | 97347 | 0 |
| B | 0 | 99572 | 0 |
| C | 0 | 94144 | 0 |
| D | 0 | 102607 | 0 |
| Mode SS | |||
|---|---|---|---|
| Quadrant | BADHDUFLAG | Total packets | Discarded packets |
| A | 0 | 892 | 0 |
| B | 0 | 892 | 0 |
| C | 0 | 892 | 0 |
| D | 0 | 892 | 0 |
| Mode M9 | |||
|---|---|---|---|
| Quadrant | BADHDUFLAG | Total packets | Discarded packets |
| A | 0 | 52 | 0 |
| B | 0 | 52 | 0 |
| C | 0 | 52 | 0 |
| D | 0 | 52 | 0 |
| Quadrant | Total seconds | Saturated seconds | Saturation percentage |
|---|---|---|---|
| A | 43974 | 901 | 2.048938% |
| B | 43974 | 1035 | 2.353664% |
| C | 43974 | 575 | 1.307591% |
| D | 43974 | 853 | 1.939783% |
Noise dominated data is calculated using 1-second bins in cleaned event files. If a bin has >2000 counts, and if more than 50% of those come from <1% of pixels, then it is considered to be noise-dominated and hence unusable.
| Quadrant | # 1 sec bins | Bins with >0 counts | Bins with >2000 counts | High rate bins dominated by noise | Noise dominated (total time) | Noise dominated (detector-on time) | Marked lightcurve |
|---|---|---|---|---|---|---|---|
| A | 48979 | 43969 | 0 | 0 | 0.00% | 0.00% |  |
| B | 48979 | 43970 | 0 | 0 | 0.00% | 0.00% |  |
| C | 48979 | 43972 | 0 | 0 | 0.00% | 0.00% | 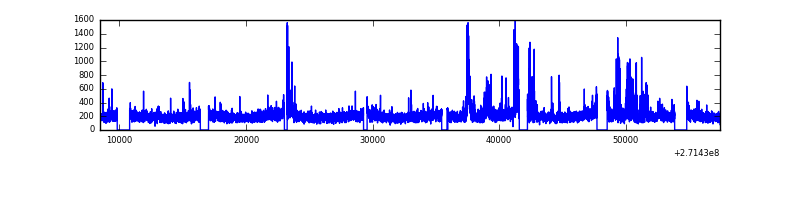 |
| D | 48979 | 43971 | 0 | 0 | 0.00% | 0.00% | 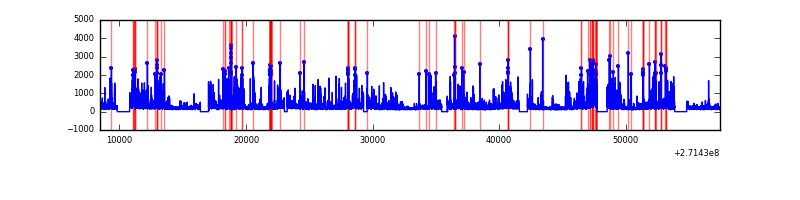 |
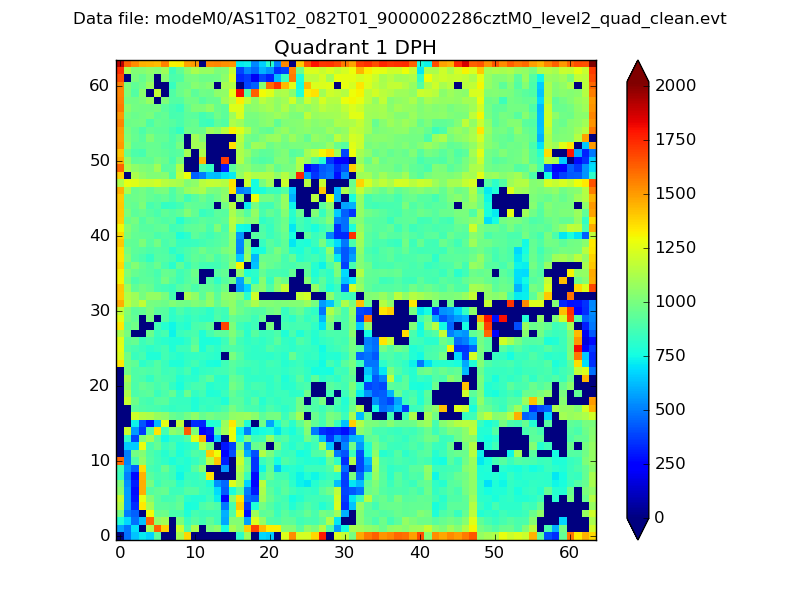
Top three noisy pixels from each quadrant. If the there are fewer than three noisy pixels in the level2.evt file, extra rows are filled as -1
| Pixel properties | Quadrant properties | ||||||
|---|---|---|---|---|---|---|---|
| Quadrant | DetID | PixID | Counts | Sigma | Mean | Median | Sigma |
| A | 0 | 29 | 2378 | 11.04 | 641 | 599 | 161.1 |
| A | 7 | 110 | 2000 | 8.7 | 641 | 599 | 161.1 |
| A | 9 | 19 | 1945 | 8.36 | 641 | 599 | 161.1 |
| B | 2 | 9 | 1891 | 10.43 | 627 | 598 | 123.9 |
| B | 3 | 80 | 1668 | 8.63 | 627 | 598 | 123.9 |
| B | 14 | 254 | 1661 | 8.58 | 627 | 598 | 123.9 |
| C | 12 | 241 | 1716 | 6.81 | 640 | 596 | 164.4 |
| C | 3 | 126 | 1667 | 6.51 | 640 | 596 | 164.4 |
| C | 3 | 158 | 1614 | 6.19 | 640 | 596 | 164.4 |
| D | 3 | 14 | 1594 | 6.41 | 603 | 547 | 163.5 |
| D | 6 | 231 | 1523 | 5.97 | 603 | 547 | 163.5 |
| D | 10 | 189 | 1482 | 5.72 | 603 | 547 | 163.5 |
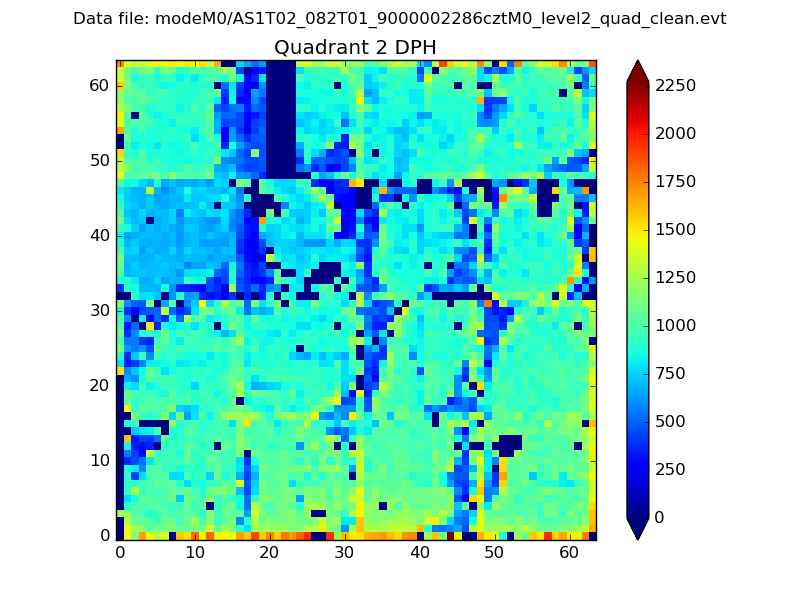
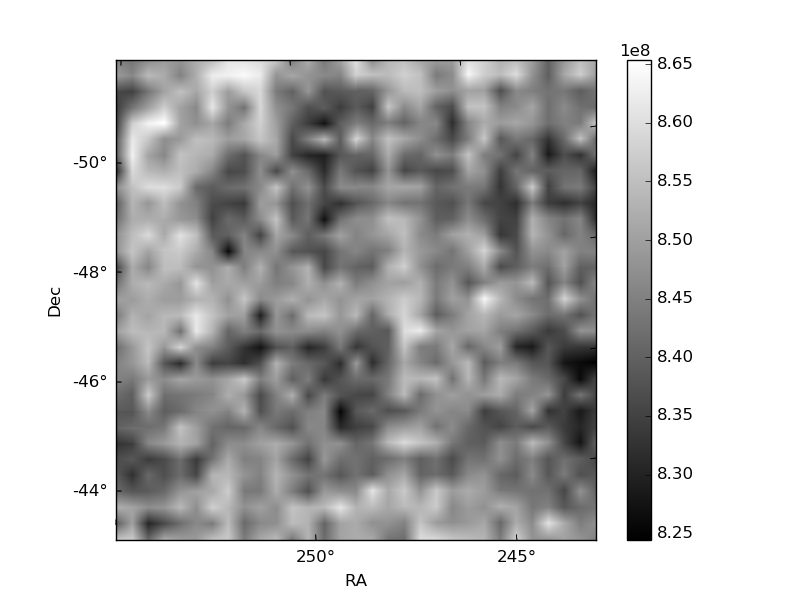
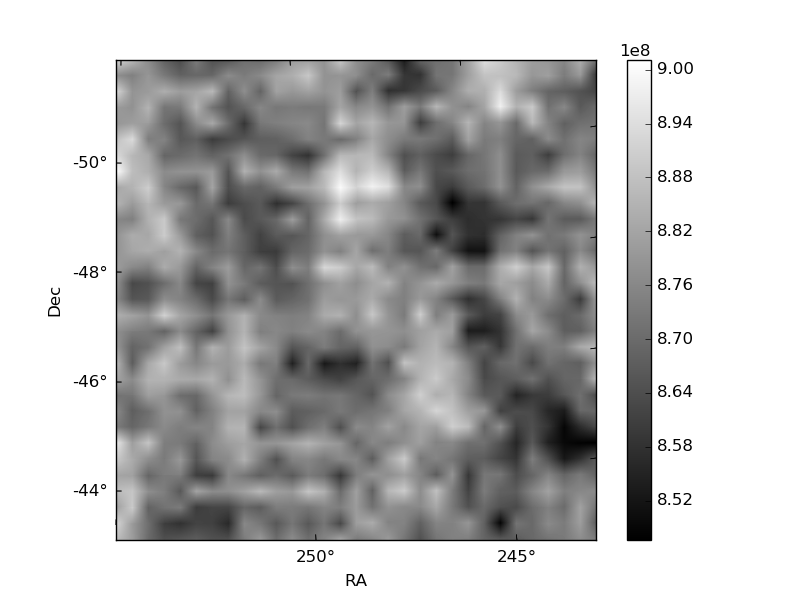
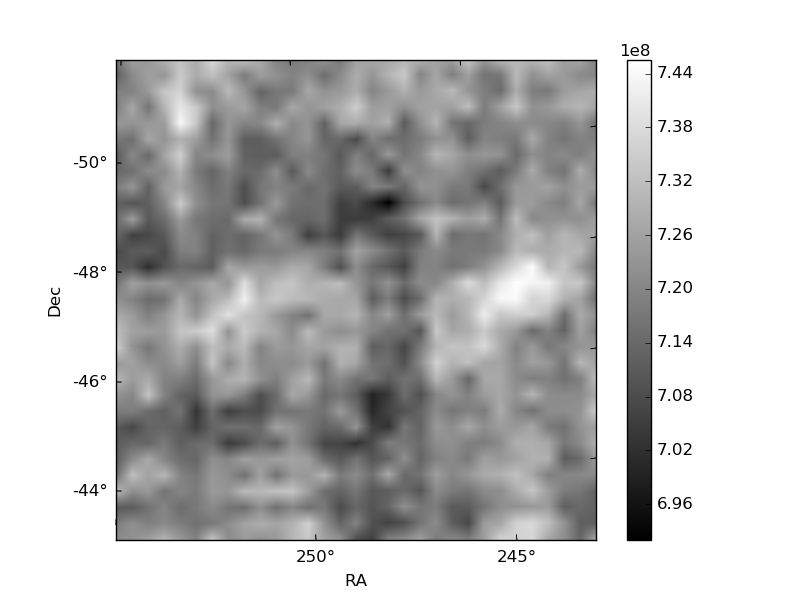
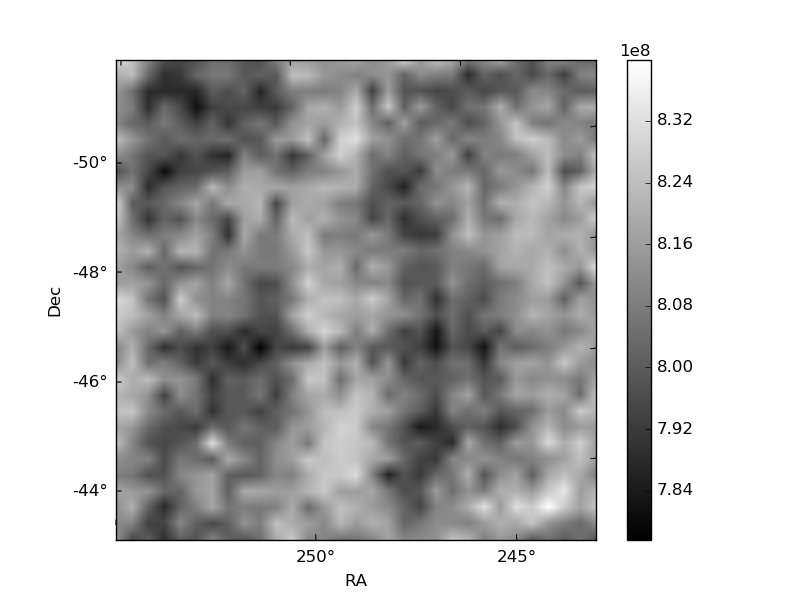
Histogram calculated using DETX and DETY for each event in the final _common_clean file
| Quadrant A | 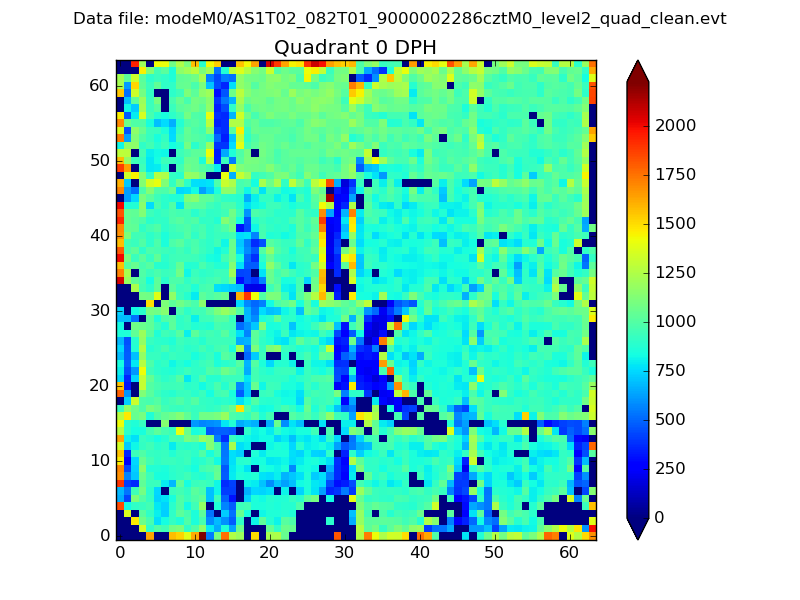 |
 |
Quadrant B |
|---|---|---|---|
| Quadrant D | 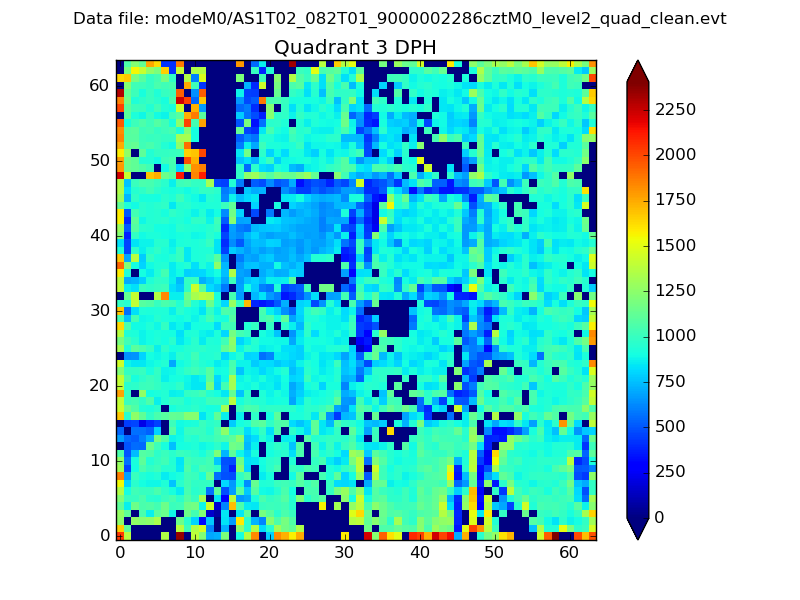 |
 |
Quadrant C |
| Plot type | Count rate plots | Images |
|---|---|---|
| Comparison with Poisson distribution Blue bars denote a histogram of data divided into 1 sec bins. Red curve is a Poisson curve with rate = median count rate of data. |
 |
 |
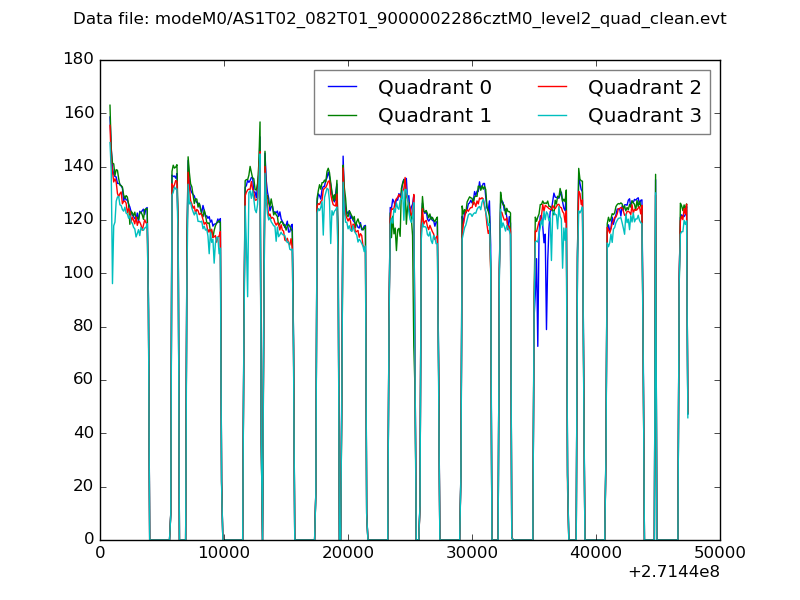
| Quadrant-wise count rates Data is divided into 100 sec bins |
 |
|
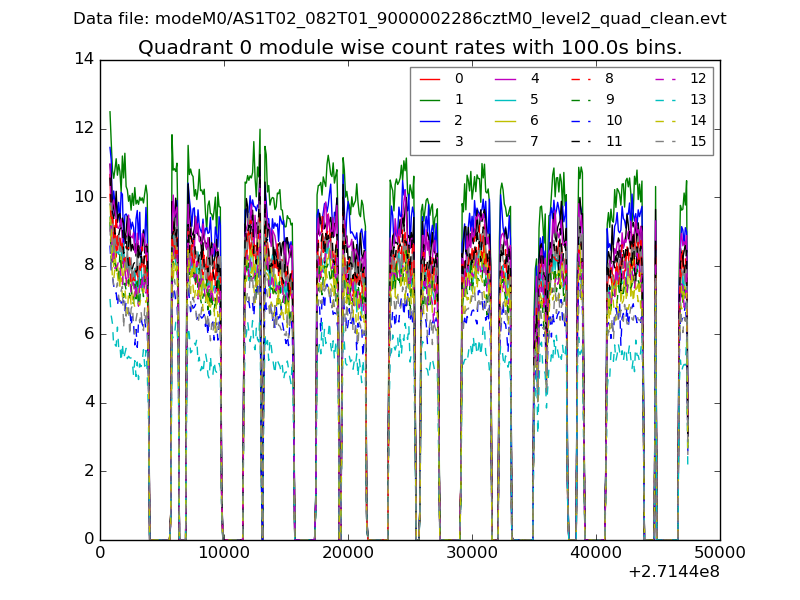
| Module-wise count rates for Quadrant A Data is divided into 100 sec bins |
 |
 |
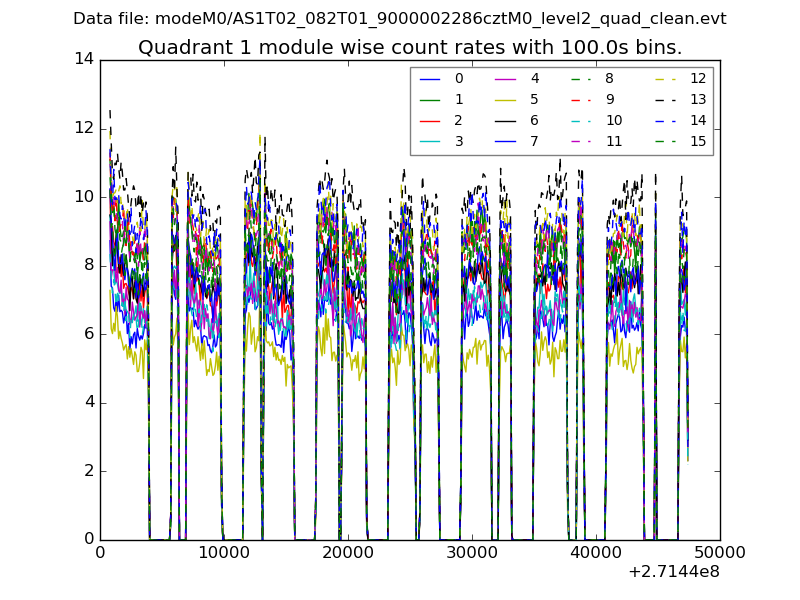
| Module-wise count rates for Quadrant B Data is divided into 100 sec bins |
 |
 |
| Module-wise count rates for Quadrant C Data is divided into 100 sec bins |
 |
 |
| Module-wise count rates for Quadrant D Data is divided into 100 sec bins |
 |
 |
| Parameter | Plot |
|---|---|
| CZT HV Monitor |  |
| D_VDD | 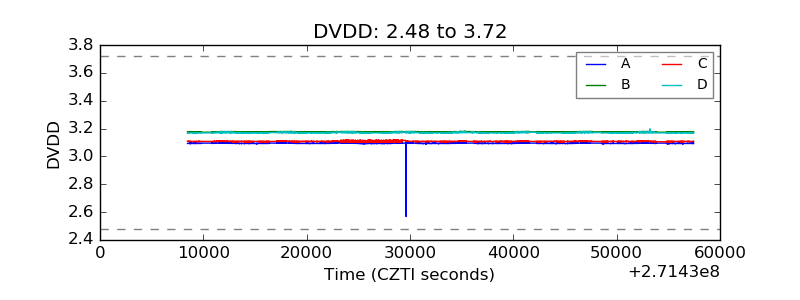 |
| Temperature 1 |  |
| Veto HV Monitor |  |
| Veto LLD | 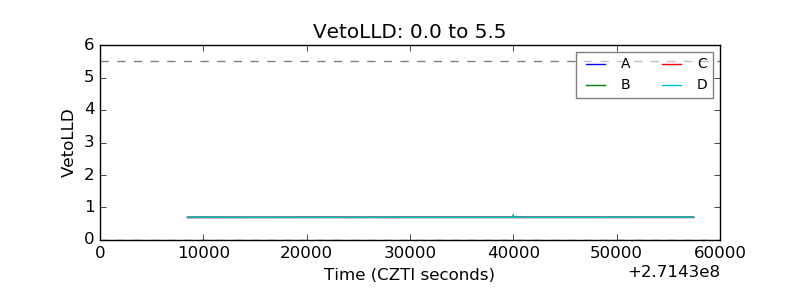 |
| Alpha Counter |  |
| _CPM_Rate |  |
| CZT Counter |  |
| +2.5 Volts monitor |  |
| +5 Volts monitor |  |
| _ROLL_ROT | 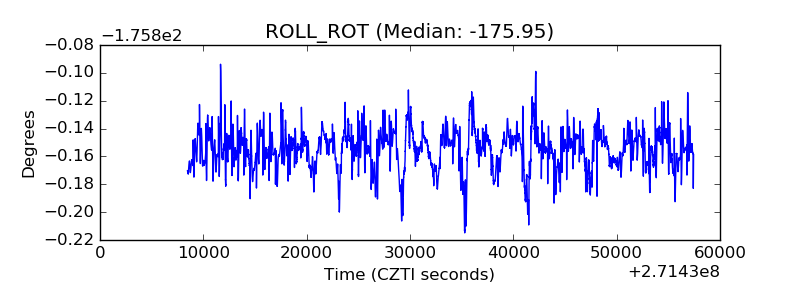 |
| _Roll_DEC | 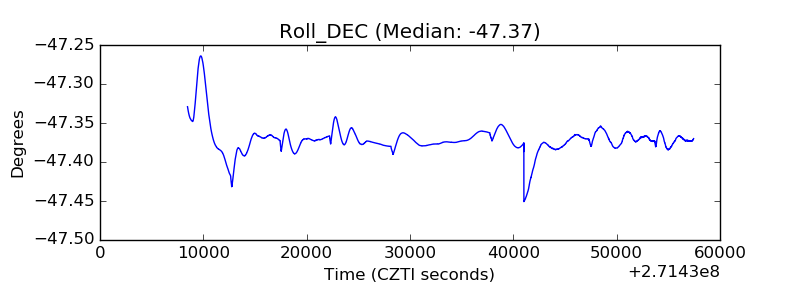 |
| _Roll_RA | 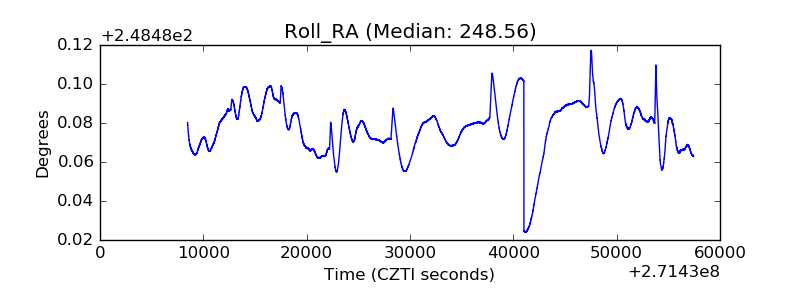 |
| Veto Counter | 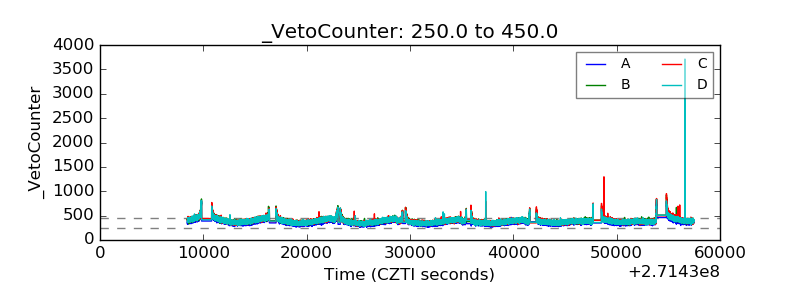 |