| Param | Original file | Final file |
|---|---|---|
| Filename | modeM0/AS1T02_082T01_9000002286_15475cztM0_level2.evt | modeM0/AS1T02_082T01_9000002286_15475cztM0_level2_quad_clean.evt |
| Size (bytes) | 217,831,680 | 32,333,760 |
| Size | 207.7 MB | 30.8 MB |
| Events in quadrant A | 1,456,940 | 198,811 |
| Events in quadrant B | 1,479,033 | 200,982 |
| Events in quadrant C | 1,459,459 | 194,351 |
| Events in quadrant D | 2,008,364 | 183,349 |
| Mode M0 | |||
|---|---|---|---|
| Quadrant | BADHDUFLAG | Total packets | Discarded packets |
| A | 0 | 6009 | 2 |
| B | 0 | 6064 | 1 |
| C | 0 | 6006 | 1 |
| D | 0 | 7812 | 1 |
| Mode SS | |||
|---|---|---|---|
| Quadrant | BADHDUFLAG | Total packets | Discarded packets |
| A | 0 | 58 | 0 |
| B | 0 | 58 | 0 |
| C | 0 | 58 | 0 |
| D | 0 | 58 | 0 |
| Mode M9 | |||
|---|---|---|---|
| Quadrant | BADHDUFLAG | Total packets | Discarded packets |
| A | 0 | 10 | 0 |
| B | 0 | 10 | 0 |
| C | 0 | 10 | 0 |
| D | 0 | 10 | 0 |
| Quadrant | Total seconds | Saturated seconds | Saturation percentage |
|---|---|---|---|
| A | 2816 | 78 | 2.769886% |
| B | 2816 | 73 | 2.592330% |
| C | 2816 | 74 | 2.627841% |
| D | 2816 | 189 | 6.711648% |
Noise dominated data is calculated using 1-second bins in cleaned event files. If a bin has >2000 counts, and if more than 50% of those come from <1% of pixels, then it is considered to be noise-dominated and hence unusable.
| Quadrant | # 1 sec bins | Bins with >0 counts | Bins with >2000 counts | High rate bins dominated by noise | Noise dominated (total time) | Noise dominated (detector-on time) | Marked lightcurve |
|---|---|---|---|---|---|---|---|
| A | 3802 | 2817 | 3 | 3 | 0.08% | 0.11% | 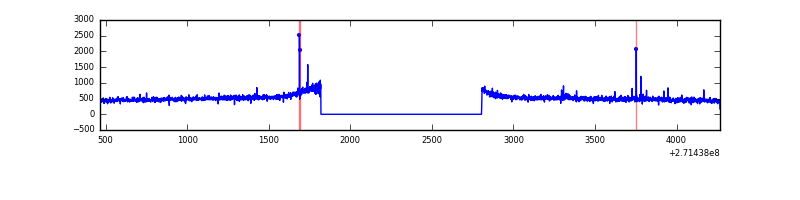 |
| B | 3802 | 2818 | 0 | 0 | 0.00% | 0.00% | 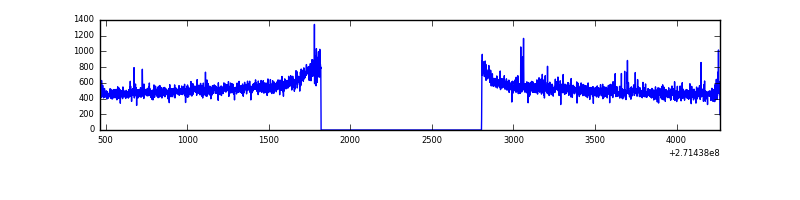 |
| C | 3802 | 2818 | 0 | 0 | 0.00% | 0.00% | 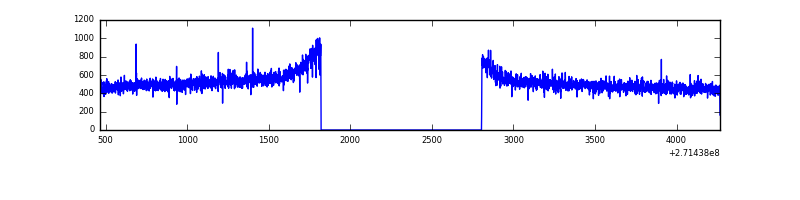 |
| D | 3802 | 2818 | 104 | 104 | 2.74% | 3.69% | 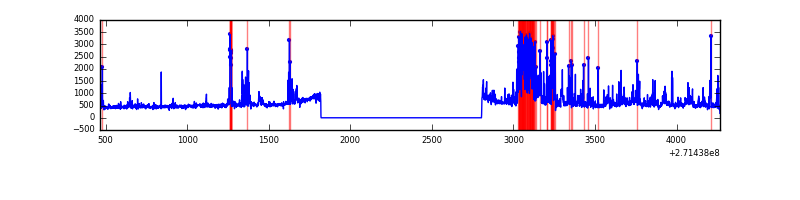 |
Top three noisy pixels from each quadrant. If the there are fewer than three noisy pixels in the level2.evt file, extra rows are filled as -1
| Pixel properties | Quadrant properties | ||||||
|---|---|---|---|---|---|---|---|
| Quadrant | DetID | PixID | Counts | Sigma | Mean | Median | Sigma |
| A | 13 | 248 | 9547 | 119.16 | 374 | 365 | 77.1 |
| A | 9 | 143 | 7909 | 97.9 | 374 | 365 | 77.1 |
| A | 0 | 226 | 3446 | 39.98 | 374 | 365 | 77.1 |
| B | 3 | 209 | 9687 | 128.56 | 371 | 361 | 72.5 |
| B | 12 | 111 | 8128 | 107.07 | 371 | 361 | 72.5 |
| B | 11 | 111 | 7032 | 91.96 | 371 | 361 | 72.5 |
| C | 14 | 238 | 55114 | 654.56 | 355 | 356 | 83.7 |
| C | 3 | 233 | 12309 | 142.88 | 355 | 356 | 83.7 |
| C | 14 | 225 | 5674 | 63.57 | 355 | 356 | 83.7 |
| D | 12 | 221 | 330269 | 3703.9 | 358 | 346 | 89.1 |
| D | 1 | 52 | 164980 | 1848.27 | 358 | 346 | 89.1 |
| D | 5 | 222 | 62439 | 697.09 | 358 | 346 | 89.1 |
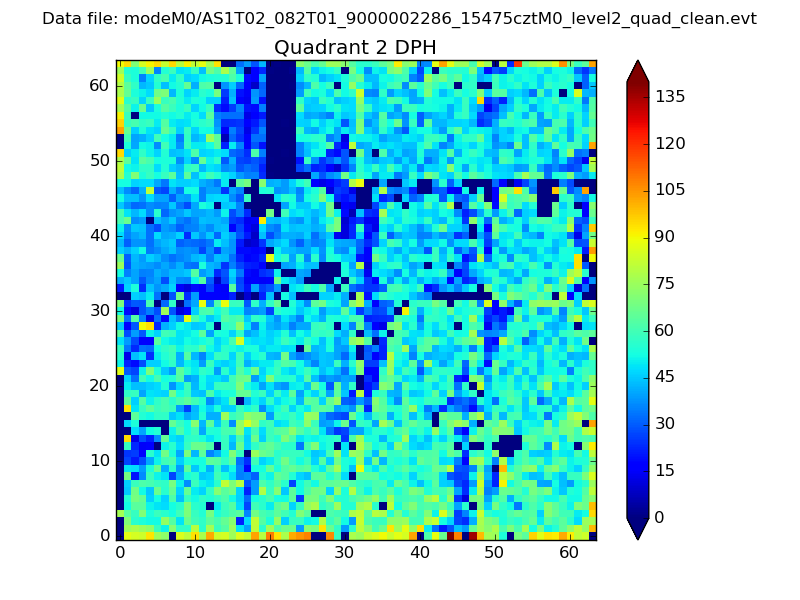
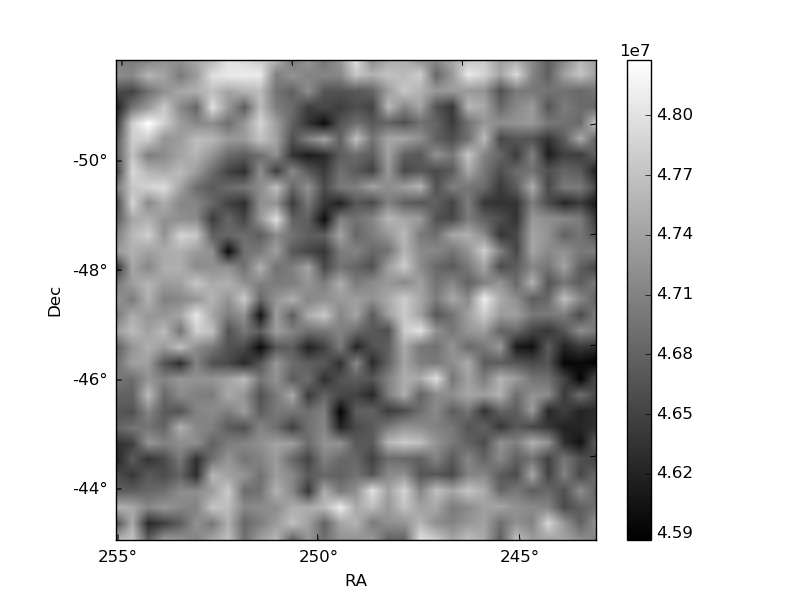
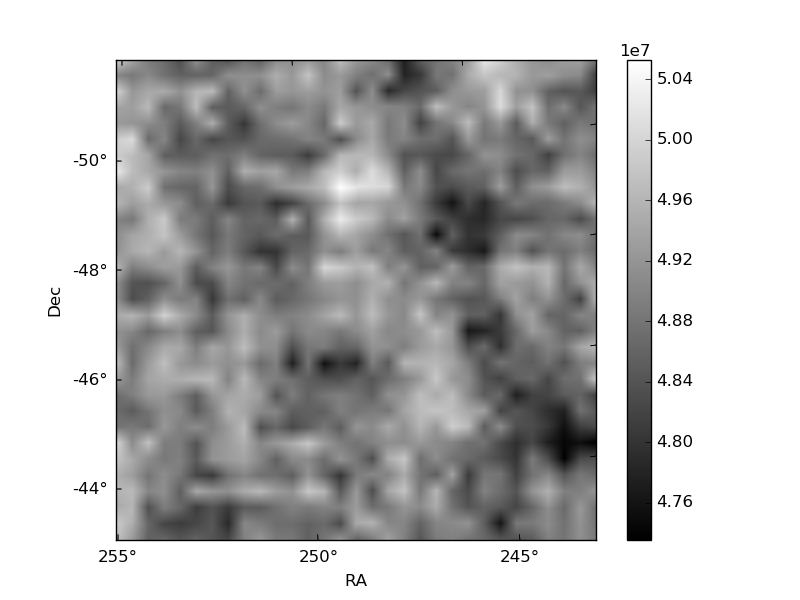
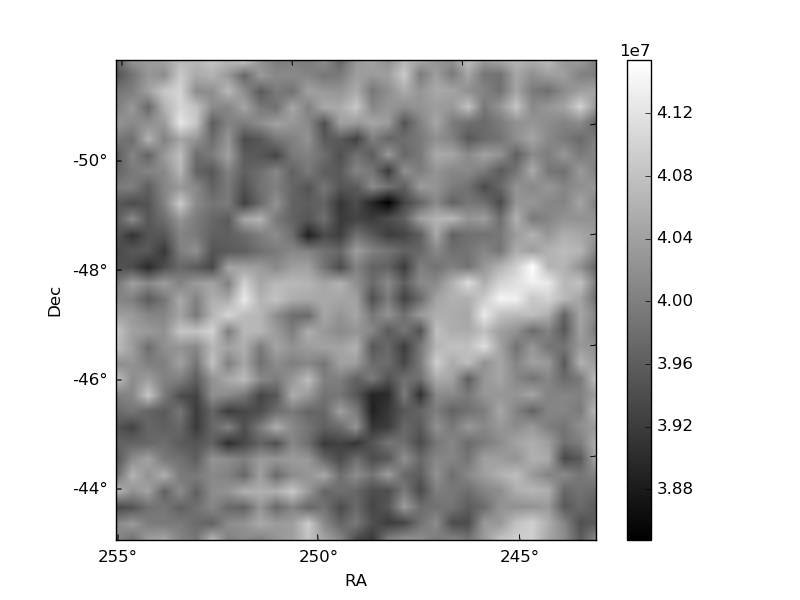
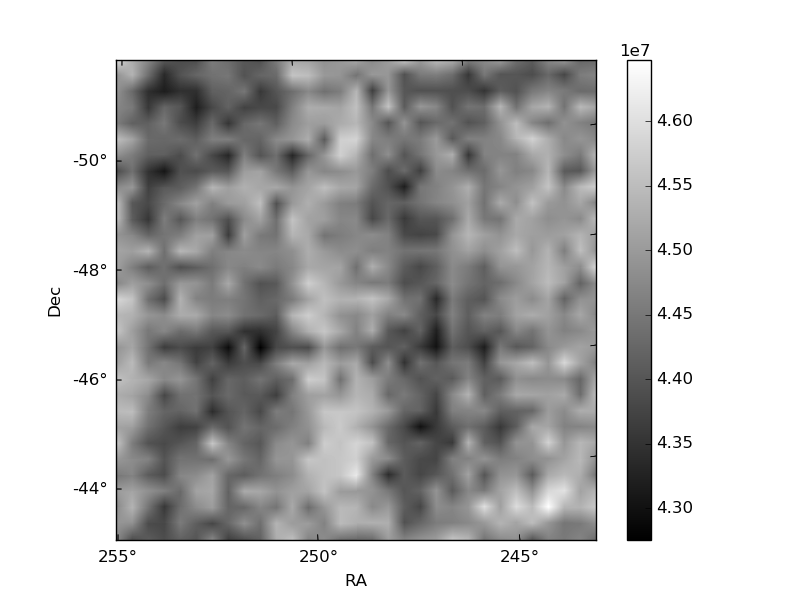
Histogram calculated using DETX and DETY for each event in the final _common_clean file
| Quadrant A | 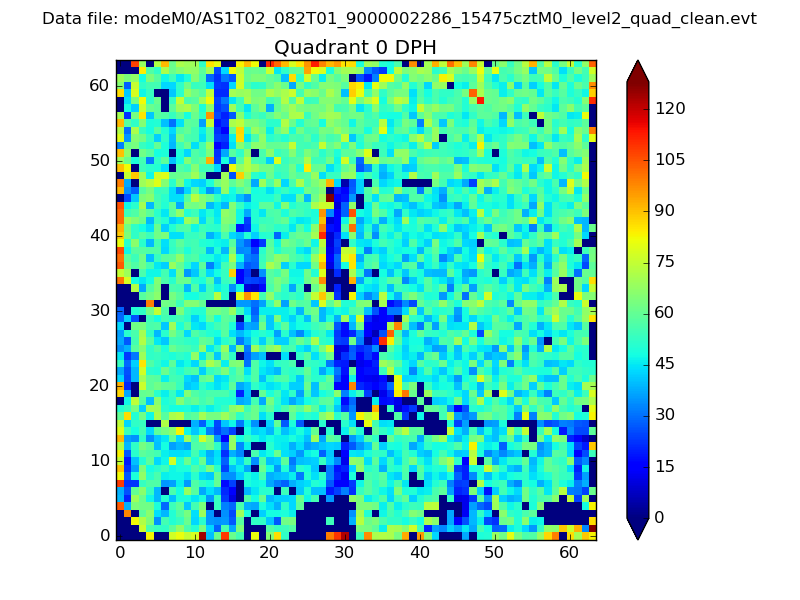 |
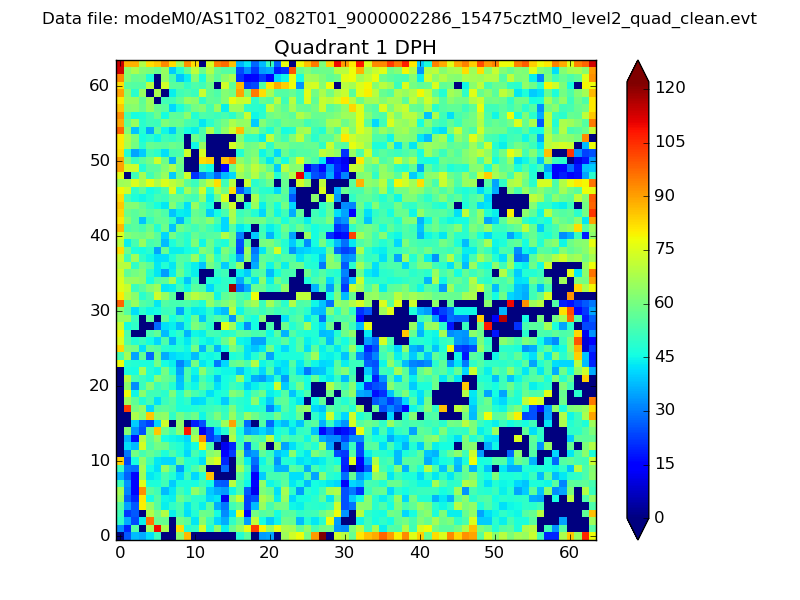 |
Quadrant B |
|---|---|---|---|
| Quadrant D | 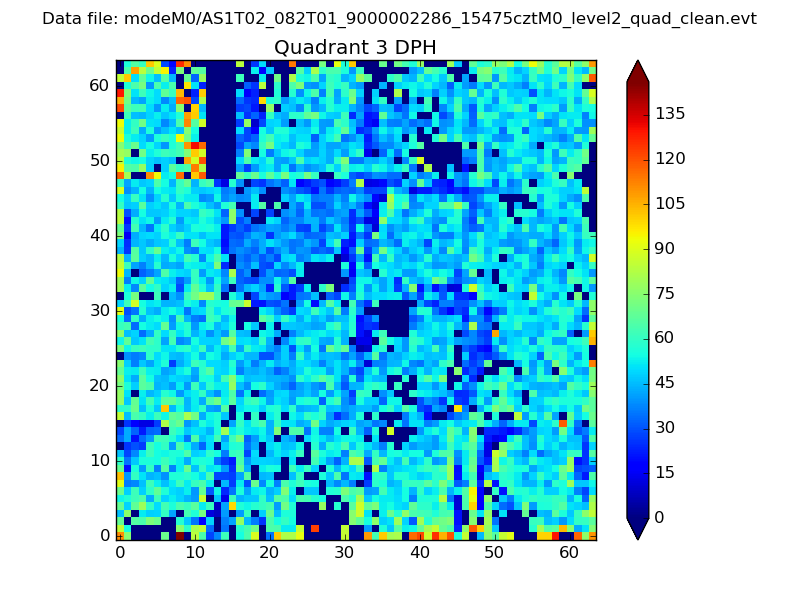 |
 |
Quadrant C |
| Plot type | Count rate plots | Images |
|---|---|---|
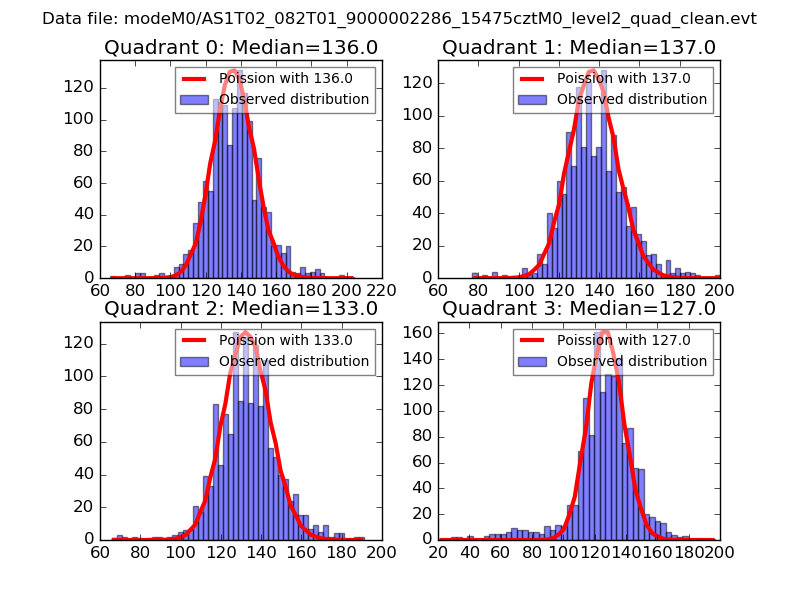
| Comparison with Poisson distribution Blue bars denote a histogram of data divided into 1 sec bins. Red curve is a Poisson curve with rate = median count rate of data. |
 |
 |
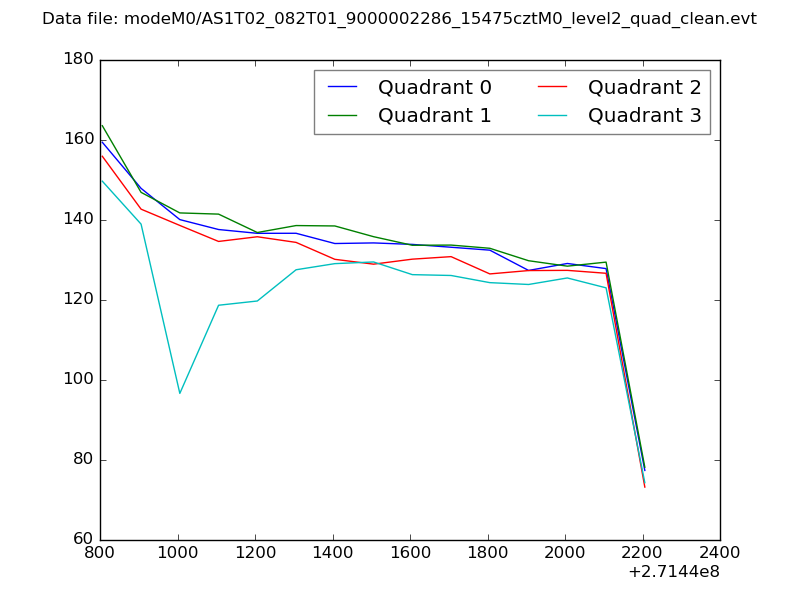
| Quadrant-wise count rates Data is divided into 100 sec bins |
 |
|
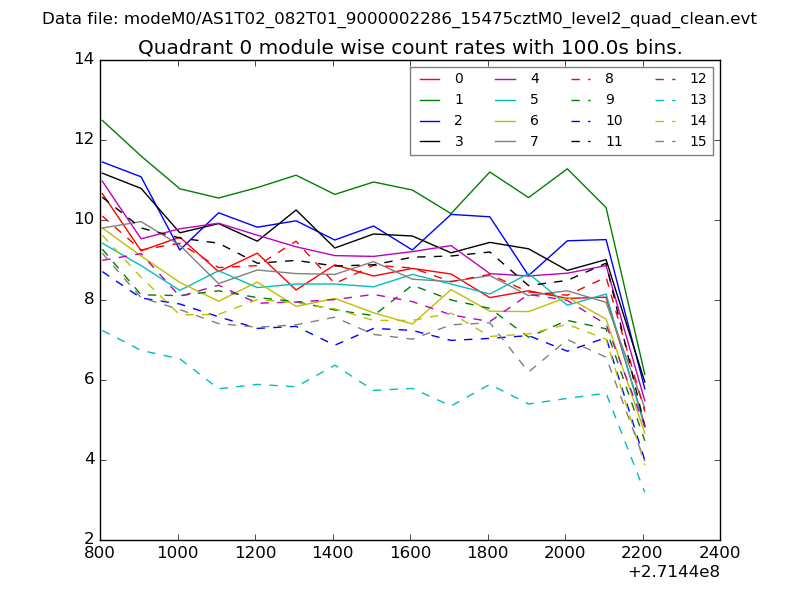
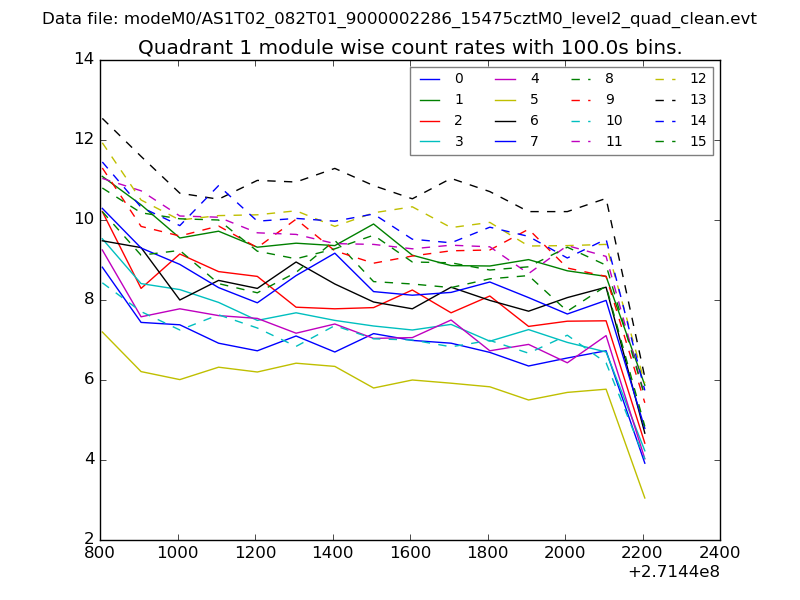
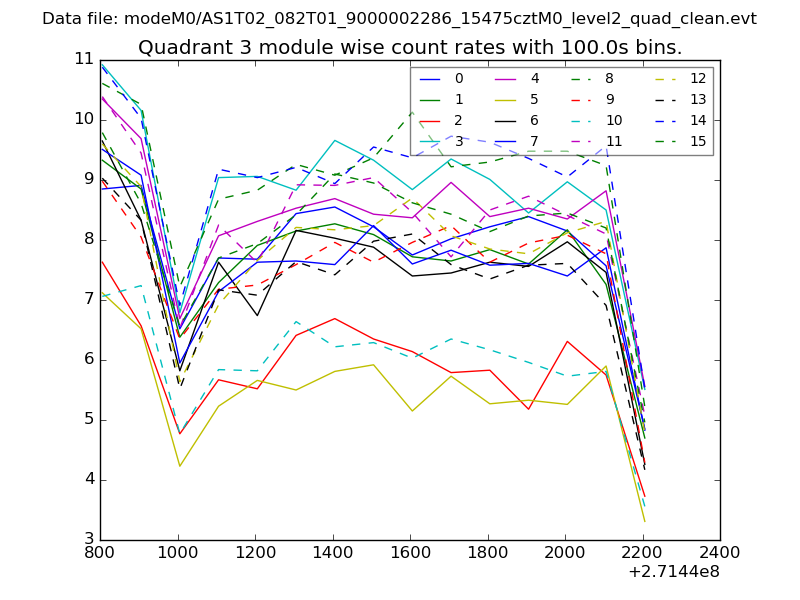
| Module-wise count rates for Quadrant A Data is divided into 100 sec bins |
 |
 |
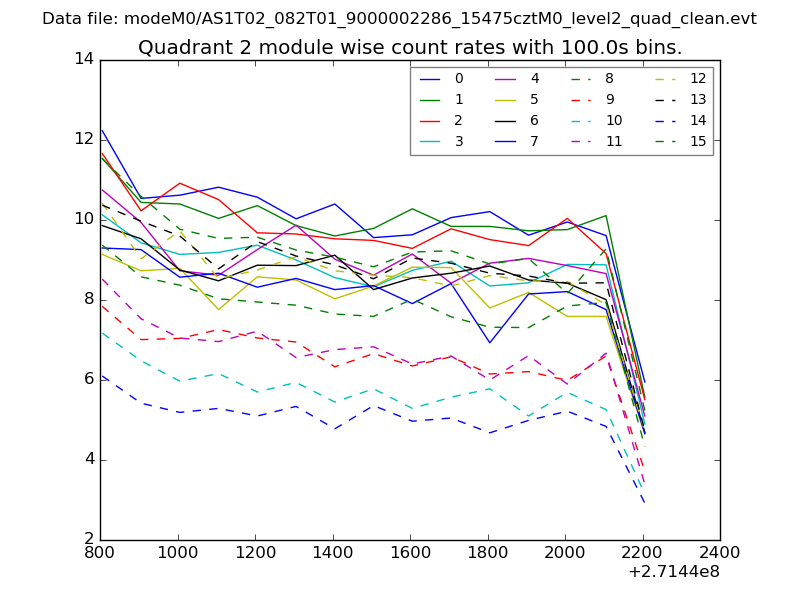
| Module-wise count rates for Quadrant B Data is divided into 100 sec bins |
 |
 |
| Module-wise count rates for Quadrant C Data is divided into 100 sec bins |
 |
 |
| Module-wise count rates for Quadrant D Data is divided into 100 sec bins |
 |
 |
| Parameter | Plot |
|---|---|
| CZT HV Monitor |  |
| D_VDD | 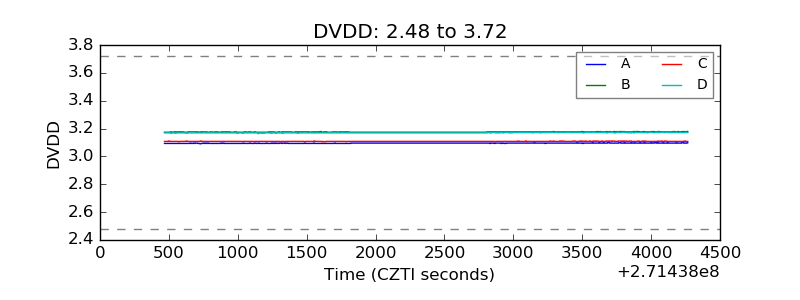 |
| Temperature 1 | 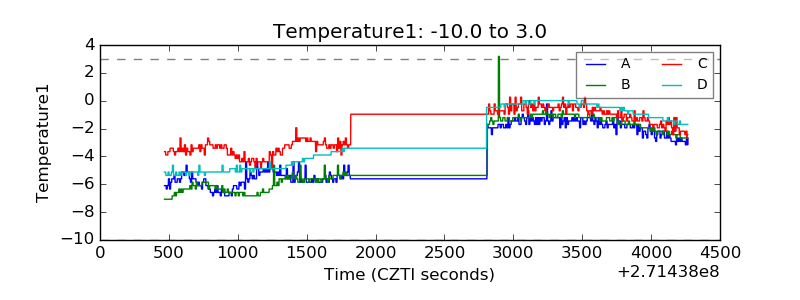 |
| Veto HV Monitor | 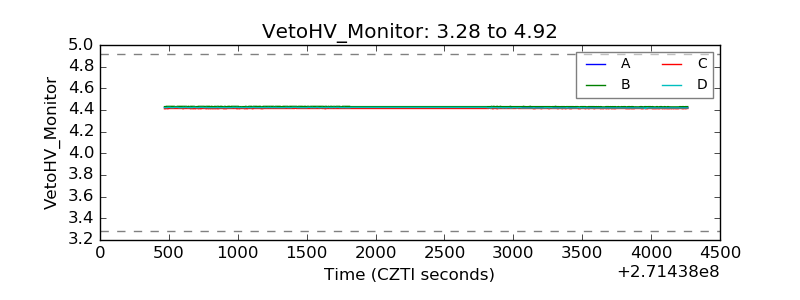 |
| Veto LLD | 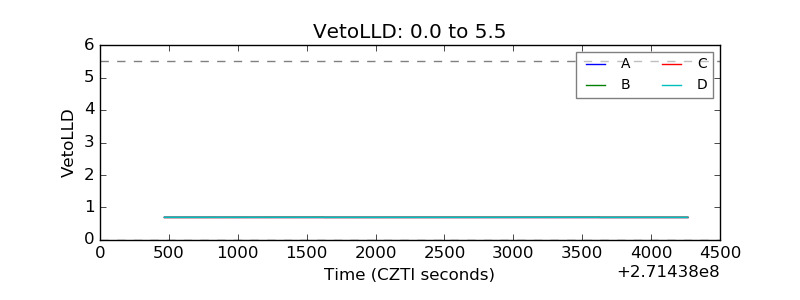 |
| Alpha Counter | 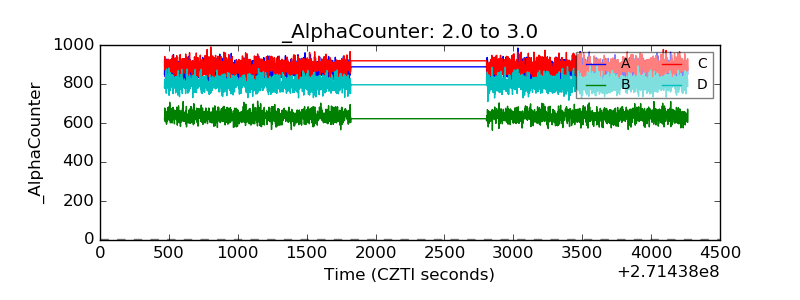 |
| _CPM_Rate |  |
| CZT Counter | 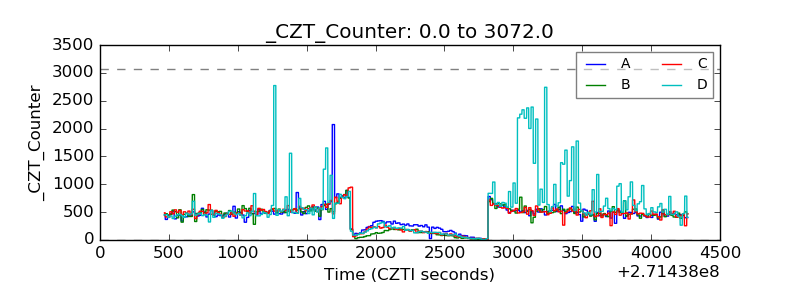 |
| +2.5 Volts monitor |  |
| +5 Volts monitor |  |
| _ROLL_ROT | 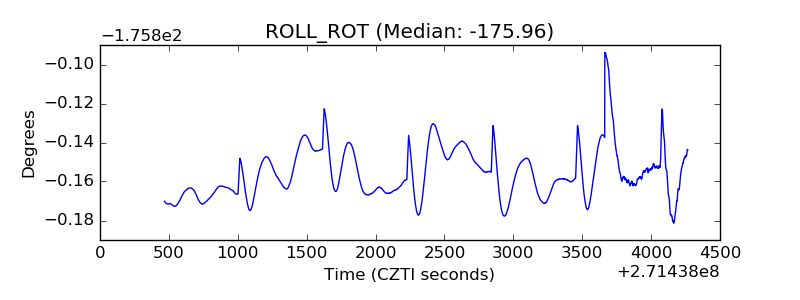 |
| _Roll_DEC | 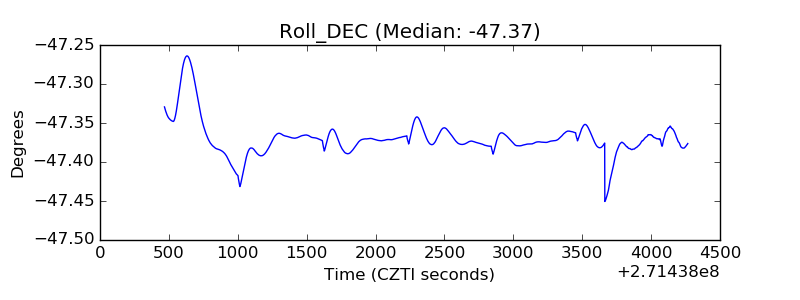 |
| _Roll_RA | 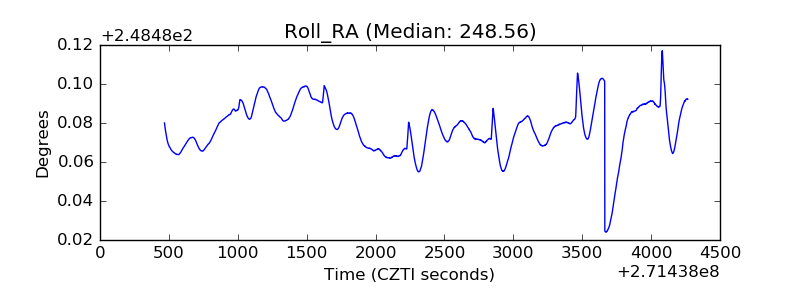 |
| Veto Counter | 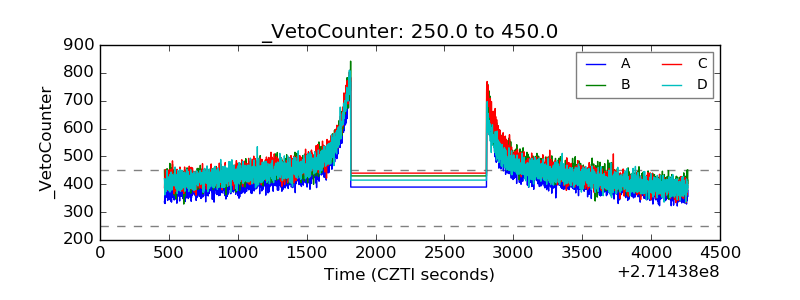 |