| Param | Original file | Final file |
|---|---|---|
| Filename | modeM0/AS1T02_082T01_9000002286_15476cztM0_level2.evt | modeM0/AS1T02_082T01_9000002286_15476cztM0_level2_quad_clean.evt |
| Size (bytes) | 495,342,720 | 104,281,920 |
| Size | 472.4 MB | 99.5 MB |
| Events in quadrant A | 3,334,980 | 680,067 |
| Events in quadrant B | 3,620,357 | 682,636 |
| Events in quadrant C | 3,365,135 | 662,989 |
| Events in quadrant D | 4,203,117 | 642,342 |
| Mode M0 | |||
|---|---|---|---|
| Quadrant | BADHDUFLAG | Total packets | Discarded packets |
| A | 0 | 14589 | 3 |
| B | 0 | 15224 | 2 |
| C | 0 | 14553 | 2 |
| D | 0 | 17191 | 2 |
| Mode SS | |||
|---|---|---|---|
| Quadrant | BADHDUFLAG | Total packets | Discarded packets |
| A | 0 | 142 | 0 |
| B | 0 | 142 | 0 |
| C | 0 | 142 | 0 |
| D | 0 | 142 | 0 |
| Mode M9 | |||
|---|---|---|---|
| Quadrant | BADHDUFLAG | Total packets | Discarded packets |
| A | 0 | 8 | 0 |
| B | 0 | 8 | 0 |
| C | 0 | 8 | 0 |
| D | 0 | 9 | 0 |
| Quadrant | Total seconds | Saturated seconds | Saturation percentage |
|---|---|---|---|
| A | 7040 | 29 | 0.411932% |
| B | 7040 | 85 | 1.207386% |
| C | 7040 | 57 | 0.809659% |
| D | 7040 | 163 | 2.315341% |
Noise dominated data is calculated using 1-second bins in cleaned event files. If a bin has >2000 counts, and if more than 50% of those come from <1% of pixels, then it is considered to be noise-dominated and hence unusable.
| Quadrant | # 1 sec bins | Bins with >0 counts | Bins with >2000 counts | High rate bins dominated by noise | Noise dominated (total time) | Noise dominated (detector-on time) | Marked lightcurve |
|---|---|---|---|---|---|---|---|
| A | 7691 | 7042 | 4 | 4 | 0.05% | 0.06% | 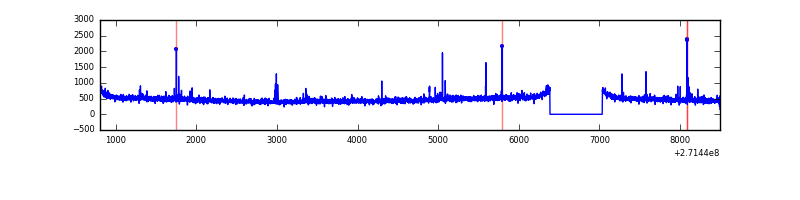 |
| B | 7691 | 7042 | 21 | 21 | 0.27% | 0.30% | 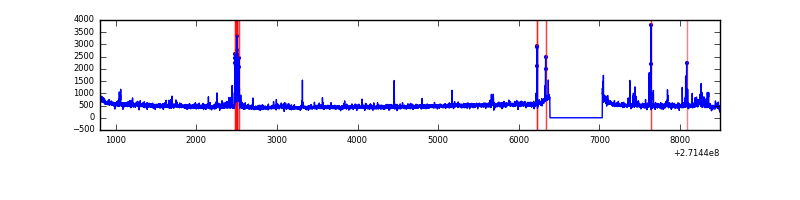 |
| C | 7691 | 7042 | 0 | 0 | 0.00% | 0.00% | 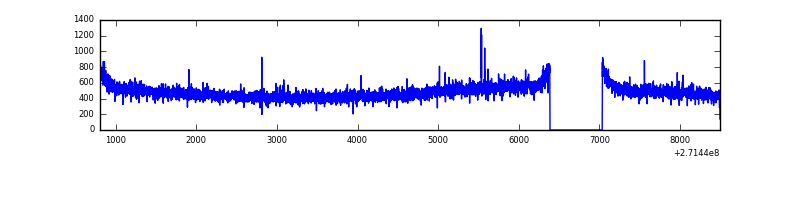 |
| D | 7691 | 7042 | 122 | 122 | 1.59% | 1.73% | 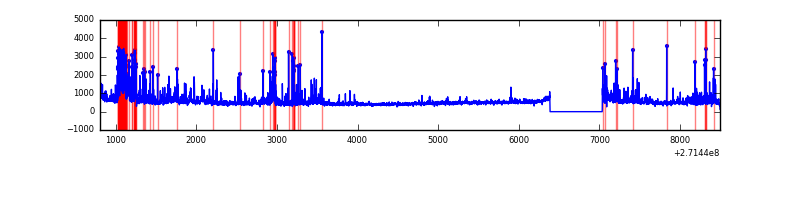 |
Top three noisy pixels from each quadrant. If the there are fewer than three noisy pixels in the level2.evt file, extra rows are filled as -1
| Pixel properties | Quadrant properties | ||||||
|---|---|---|---|---|---|---|---|
| Quadrant | DetID | PixID | Counts | Sigma | Mean | Median | Sigma |
| A | 13 | 248 | 32462 | 184.16 | 851 | 833 | 171.8 |
| A | 9 | 143 | 25030 | 140.88 | 851 | 833 | 171.8 |
| A | 0 | 226 | 7915 | 41.23 | 851 | 833 | 171.8 |
| B | 0 | 197 | 67790 | 417.51 | 847 | 825 | 160.4 |
| B | 3 | 209 | 47887 | 293.42 | 847 | 825 | 160.4 |
| B | 10 | 245 | 47599 | 291.62 | 847 | 825 | 160.4 |
| C | 14 | 238 | 124413 | 655.68 | 808 | 813 | 188.5 |
| C | 3 | 233 | 75550 | 396.47 | 808 | 813 | 188.5 |
| C | 10 | 22 | 9943 | 48.43 | 808 | 813 | 188.5 |
| D | 12 | 221 | 375235 | 1867.37 | 815 | 789 | 200.5 |
| D | 1 | 52 | 333049 | 1656.99 | 815 | 789 | 200.5 |
| D | 5 | 222 | 144967 | 719.02 | 815 | 789 | 200.5 |
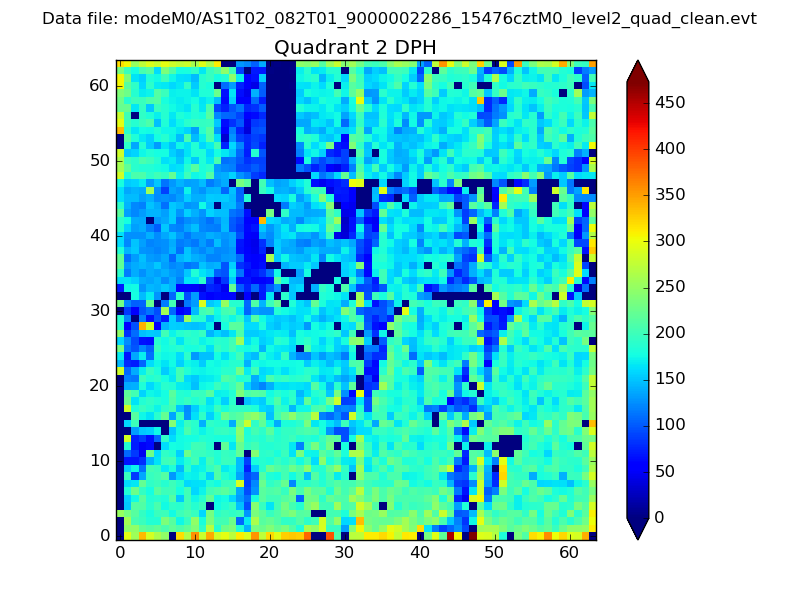
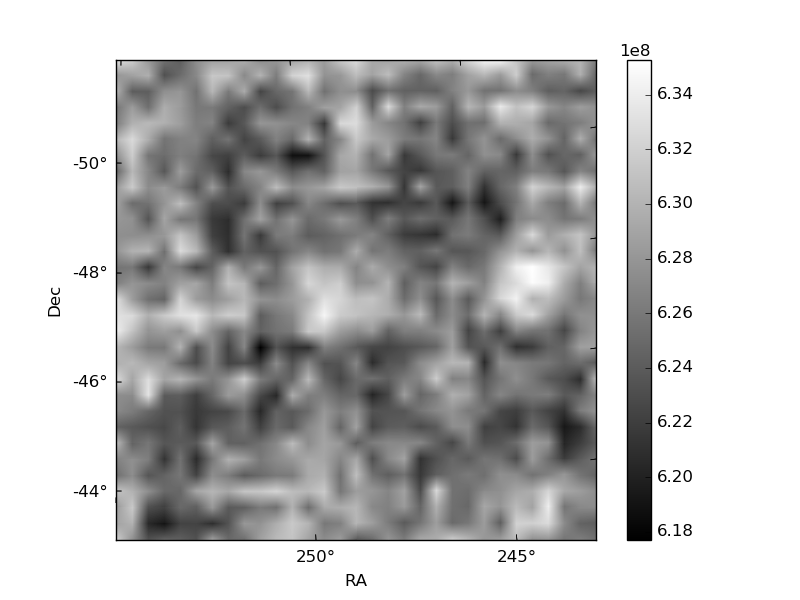
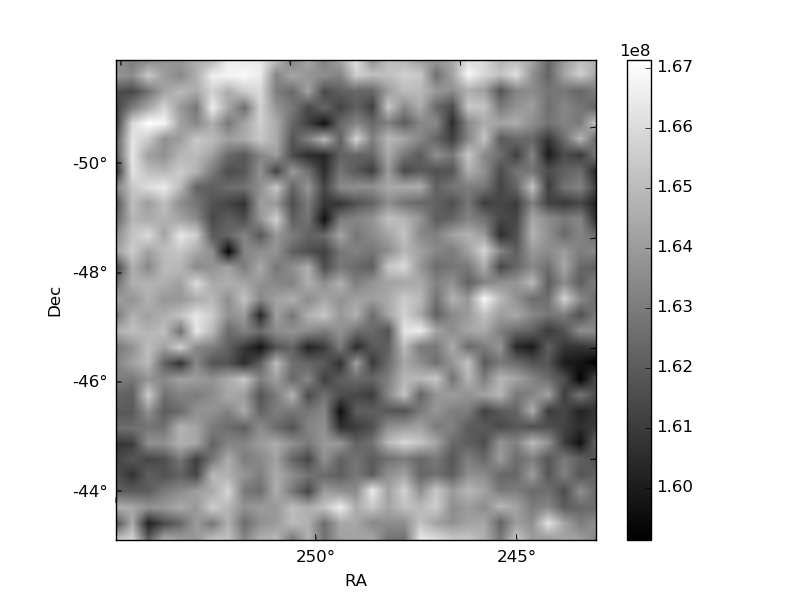
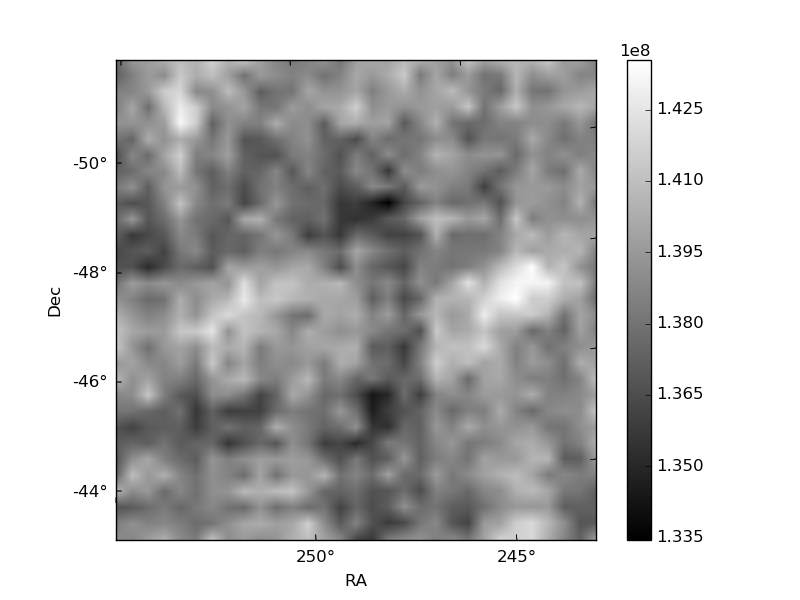
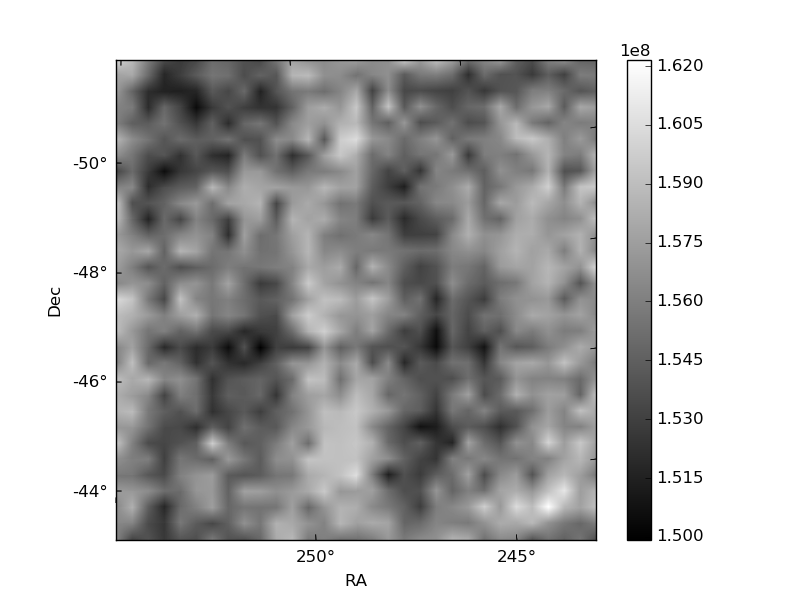
Histogram calculated using DETX and DETY for each event in the final _common_clean file
| Quadrant A | 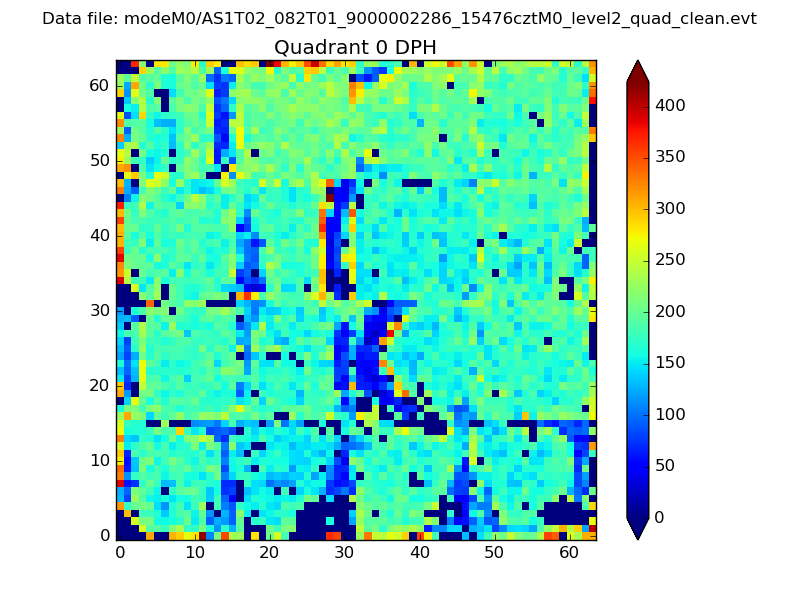 |
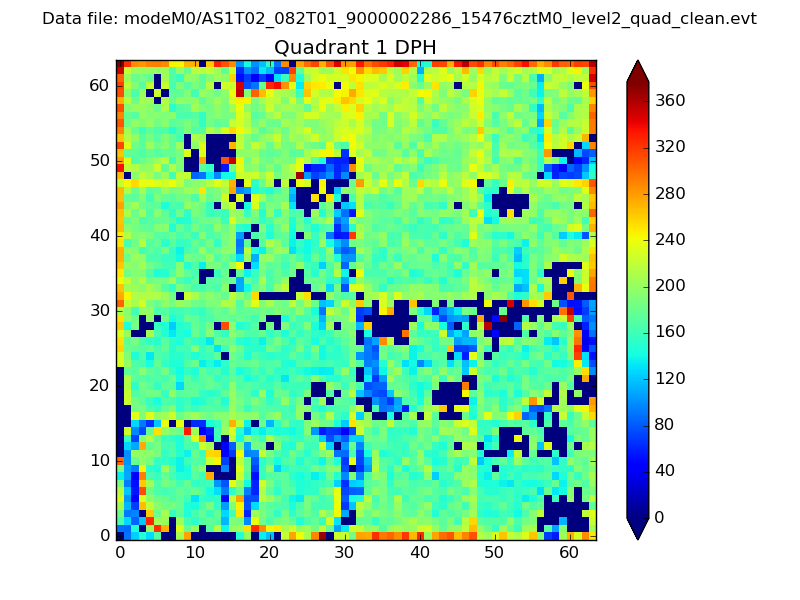 |
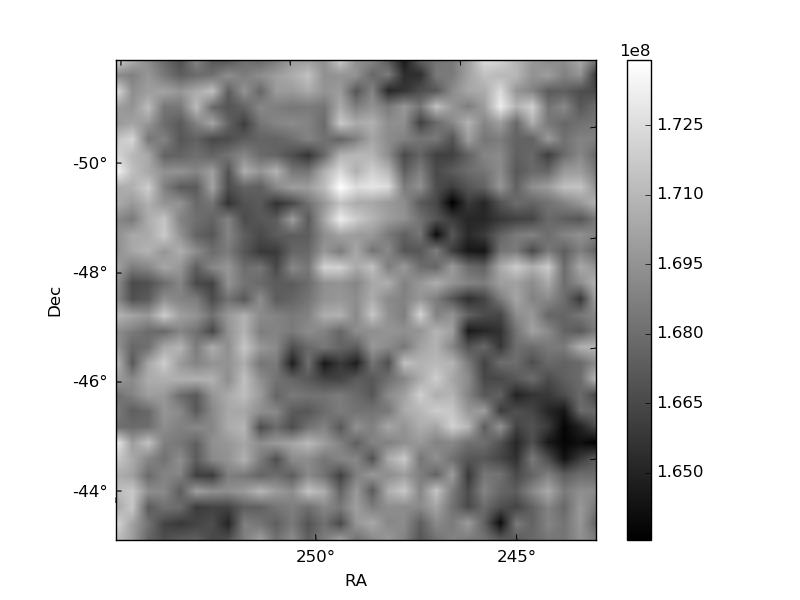
Quadrant B |
|---|---|---|---|
| Quadrant D | 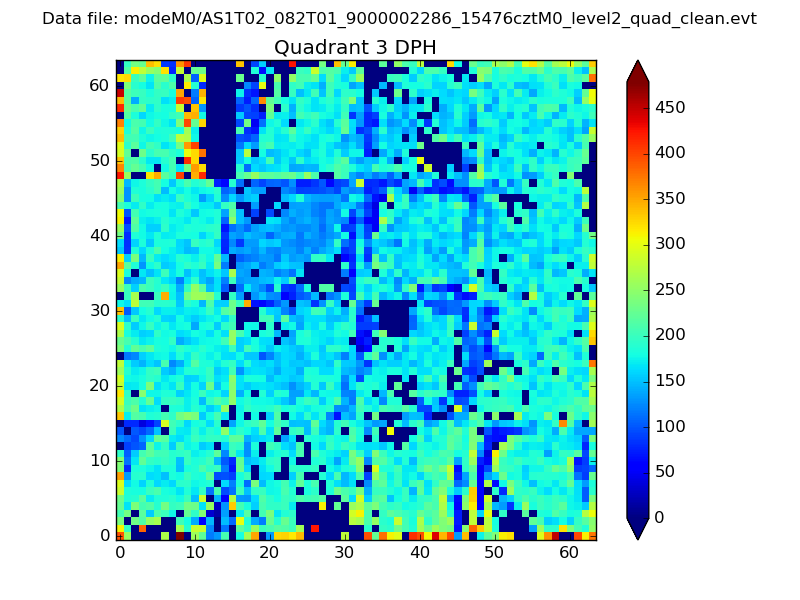 |
 |
Quadrant C |
| Plot type | Count rate plots | Images |
|---|---|---|
| Comparison with Poisson distribution Blue bars denote a histogram of data divided into 1 sec bins. Red curve is a Poisson curve with rate = median count rate of data. |
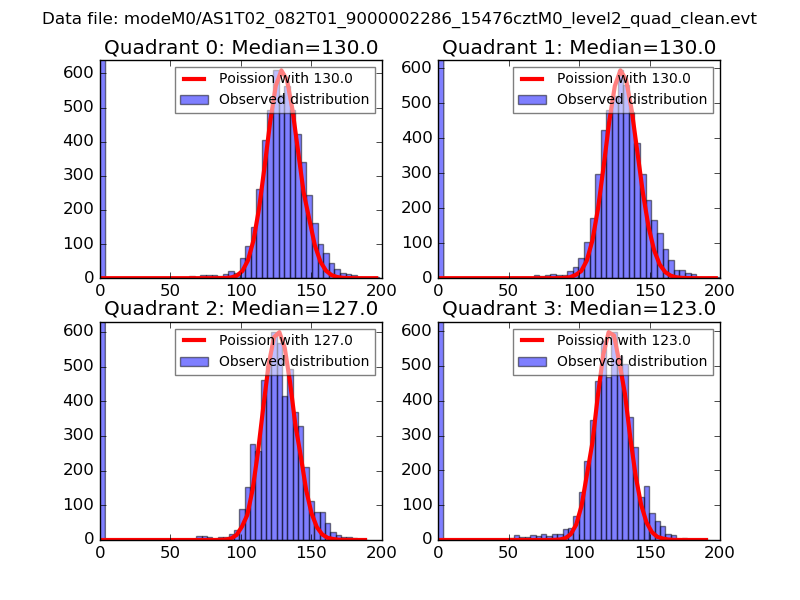 |
 |
| Quadrant-wise count rates Data is divided into 100 sec bins |
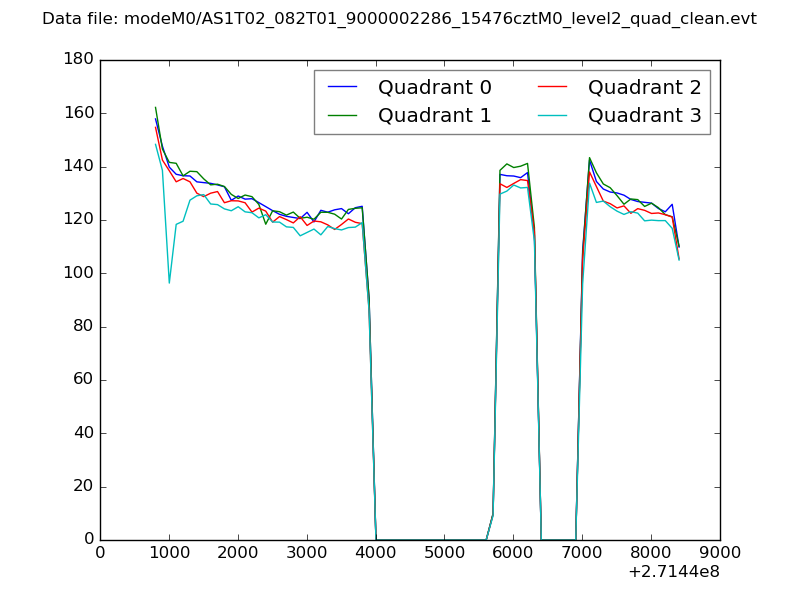 |
|
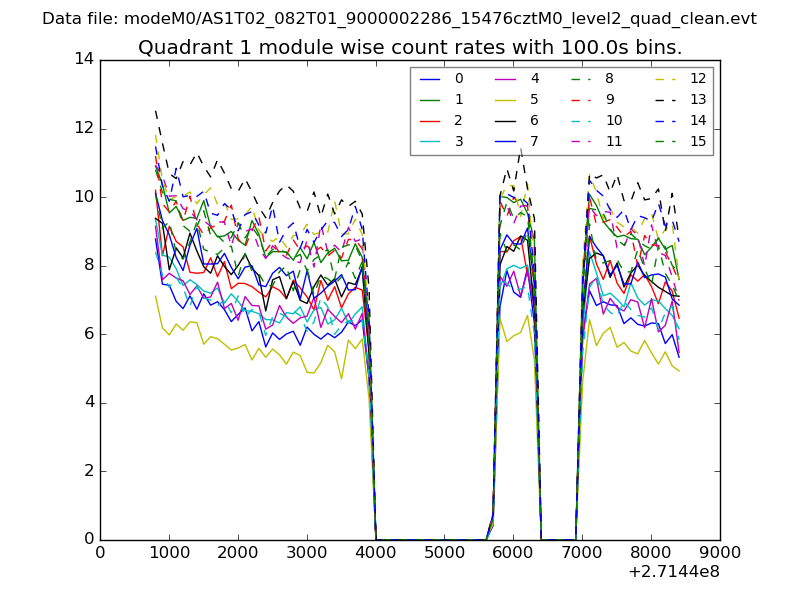
| Module-wise count rates for Quadrant A Data is divided into 100 sec bins |
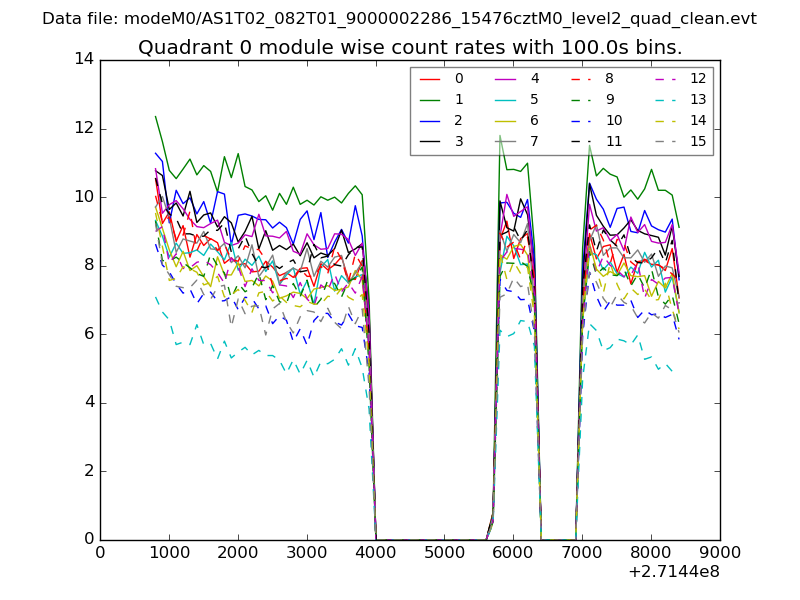 |
 |
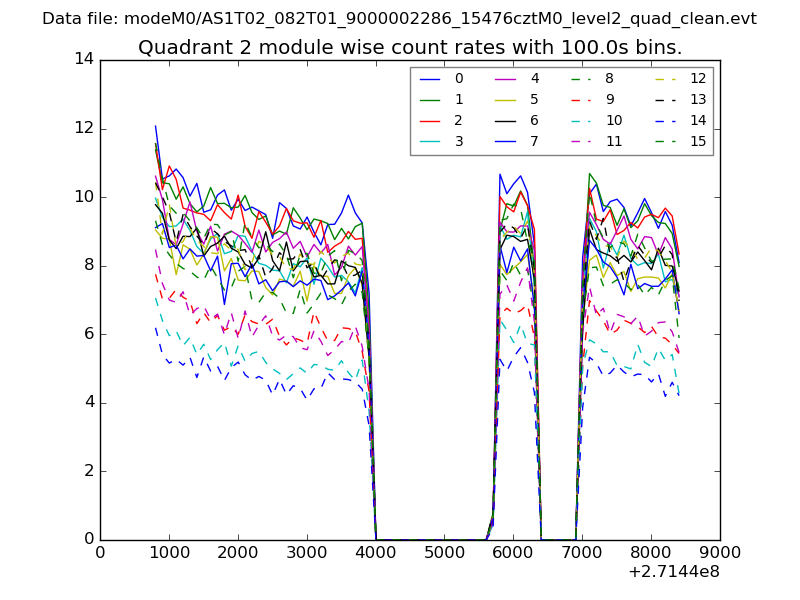
| Module-wise count rates for Quadrant B Data is divided into 100 sec bins |
 |
 |
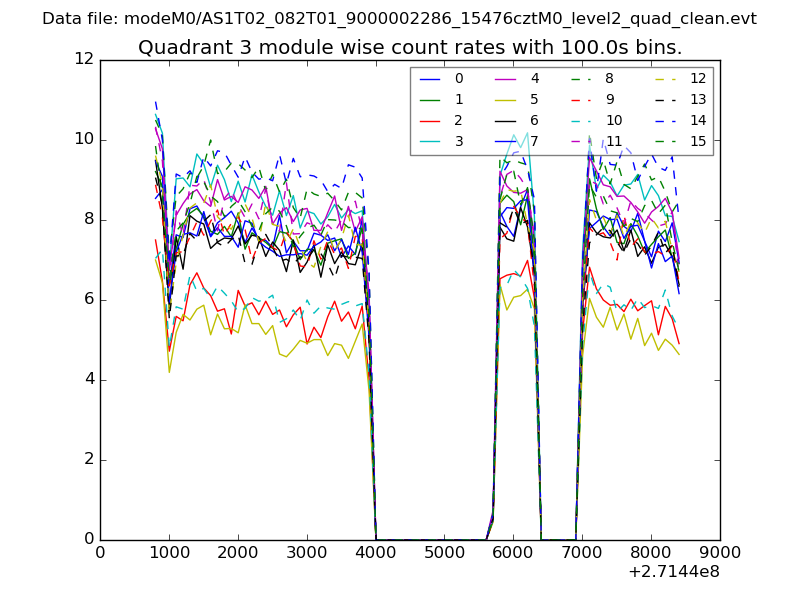
| Module-wise count rates for Quadrant C Data is divided into 100 sec bins |
 |
 |
| Module-wise count rates for Quadrant D Data is divided into 100 sec bins |
 |
 |
| Parameter | Plot |
|---|---|
| CZT HV Monitor | 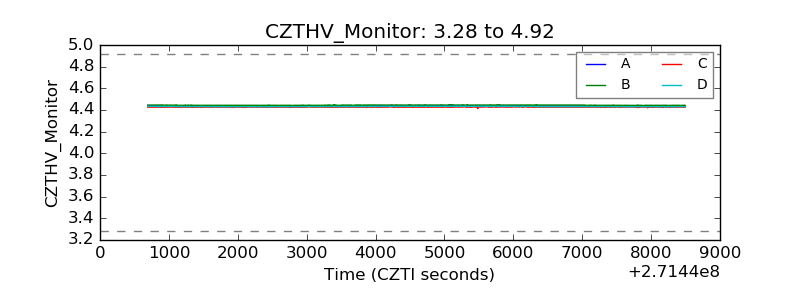 |
| D_VDD | 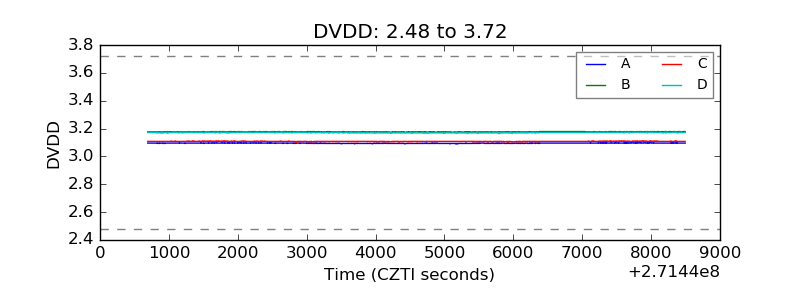 |
| Temperature 1 | 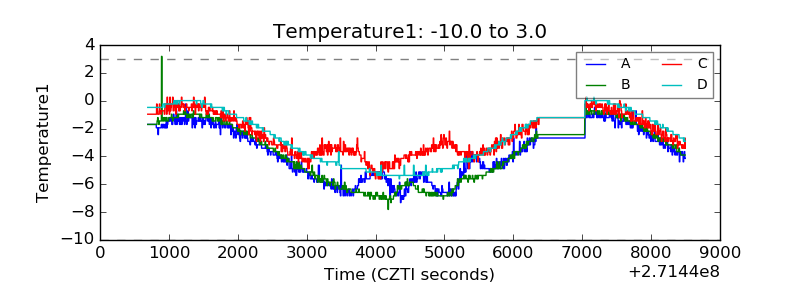 |
| Veto HV Monitor | 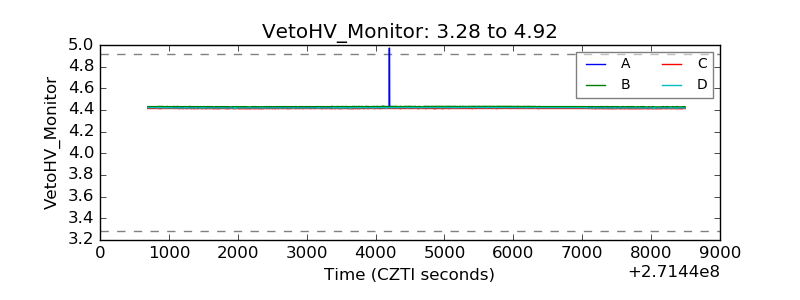 |
| Veto LLD | 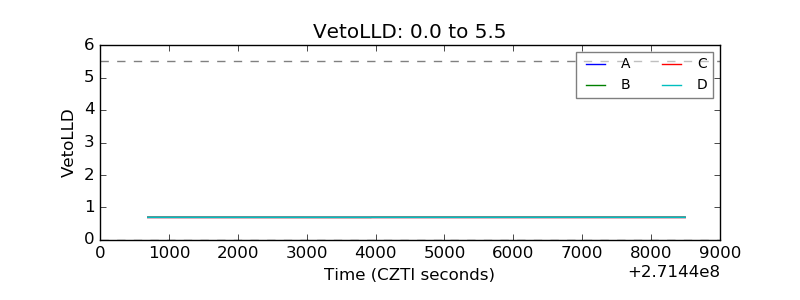 |
| Alpha Counter | 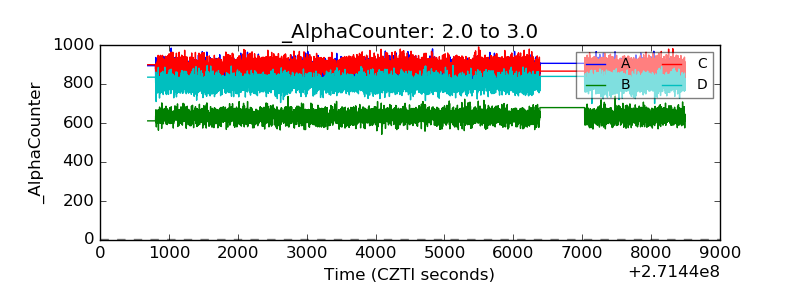 |
| _CPM_Rate | 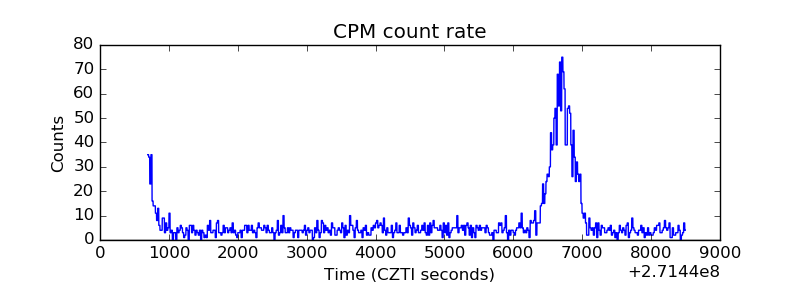 |
| CZT Counter | 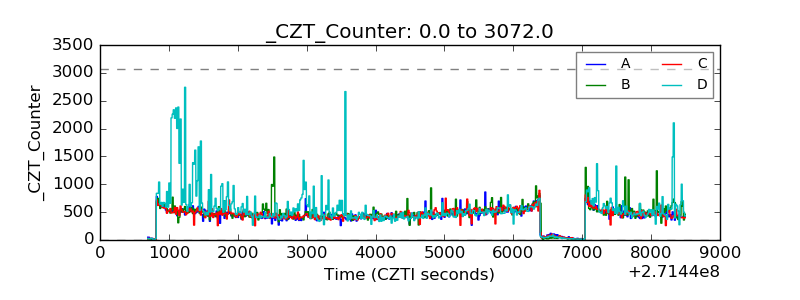 |
| +2.5 Volts monitor |  |
| +5 Volts monitor |  |
| _ROLL_ROT | 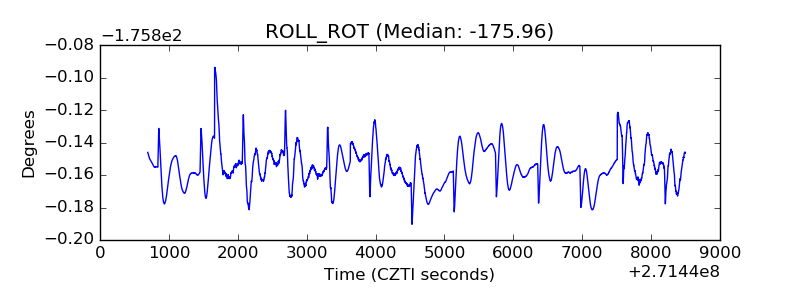 |
| _Roll_DEC | 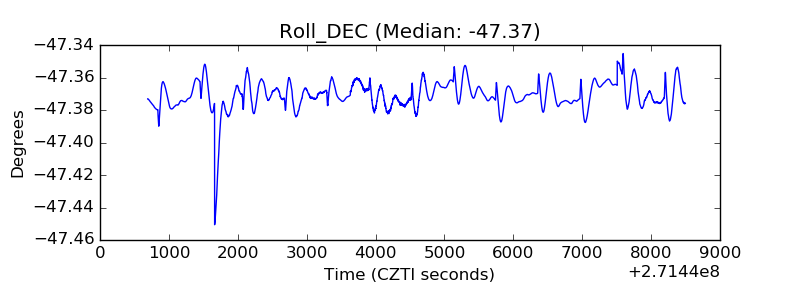 |
| _Roll_RA | 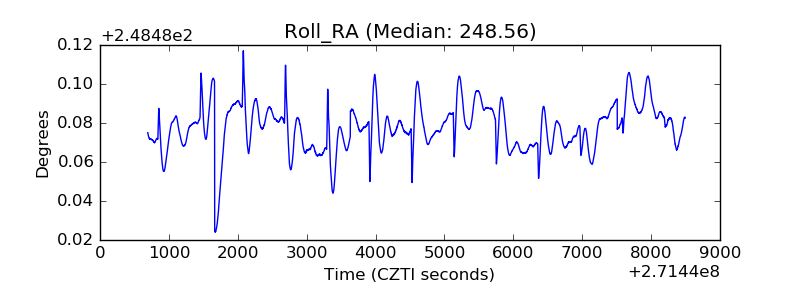 |
| Veto Counter | 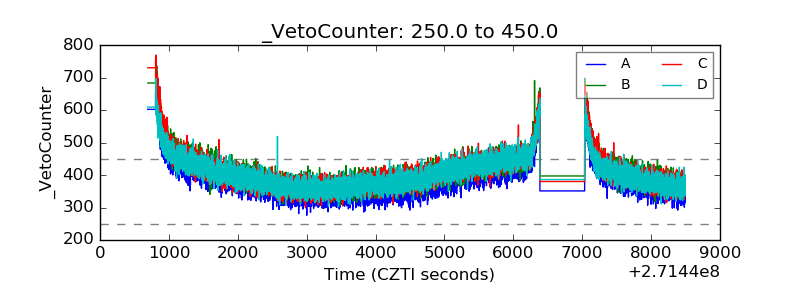 |