| Param | Original file | Final file |
|---|---|---|
| Filename | modeM0/AS1T02_082T01_9000002286_15477cztM0_level2.evt | modeM0/AS1T02_082T01_9000002286_15477cztM0_level2_quad_clean.evt |
| Size (bytes) | 542,053,440 | 110,615,040 |
| Size | 516.9 MB | 105.5 MB |
| Events in quadrant A | 3,535,339 | 725,135 |
| Events in quadrant B | 4,132,084 | 722,108 |
| Events in quadrant C | 3,694,319 | 700,968 |
| Events in quadrant D | 4,547,277 | 681,730 |
| Mode M0 | |||
|---|---|---|---|
| Quadrant | BADHDUFLAG | Total packets | Discarded packets |
| A | 0 | 15524 | 3 |
| B | 0 | 17128 | 2 |
| C | 0 | 15844 | 2 |
| D | 0 | 18534 | 2 |
| Mode SS | |||
|---|---|---|---|
| Quadrant | BADHDUFLAG | Total packets | Discarded packets |
| A | 0 | 152 | 0 |
| B | 0 | 152 | 0 |
| C | 0 | 152 | 0 |
| D | 0 | 152 | 0 |
| Mode M9 | |||
|---|---|---|---|
| Quadrant | BADHDUFLAG | Total packets | Discarded packets |
| A | 0 | 7 | 0 |
| B | 0 | 7 | 0 |
| C | 0 | 7 | 0 |
| D | 0 | 8 | 0 |
| Quadrant | Total seconds | Saturated seconds | Saturation percentage |
|---|---|---|---|
| A | 7471 | 55 | 0.736180% |
| B | 7471 | 132 | 1.766832% |
| C | 7471 | 94 | 1.258198% |
| D | 7471 | 181 | 2.422701% |
Noise dominated data is calculated using 1-second bins in cleaned event files. If a bin has >2000 counts, and if more than 50% of those come from <1% of pixels, then it is considered to be noise-dominated and hence unusable.
| Quadrant | # 1 sec bins | Bins with >0 counts | Bins with >2000 counts | High rate bins dominated by noise | Noise dominated (total time) | Noise dominated (detector-on time) | Marked lightcurve |
|---|---|---|---|---|---|---|---|
| A | 7692 | 7473 | 3 | 3 | 0.04% | 0.04% | 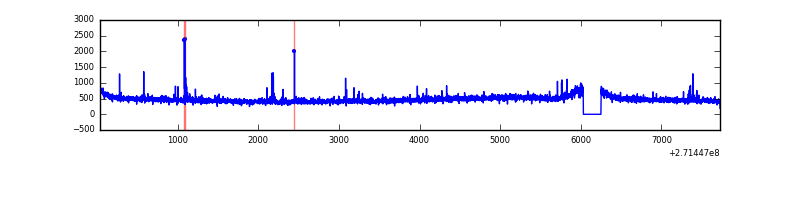 |
| B | 7692 | 7473 | 31 | 31 | 0.40% | 0.41% | 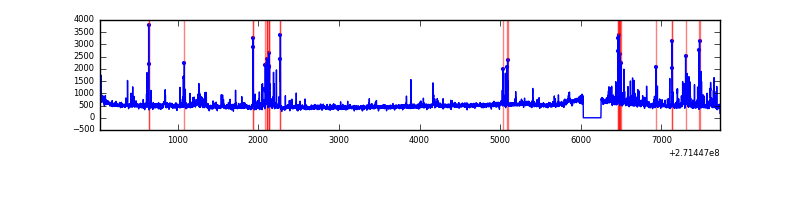 |
| C | 7692 | 7473 | 4 | 4 | 0.05% | 0.05% | 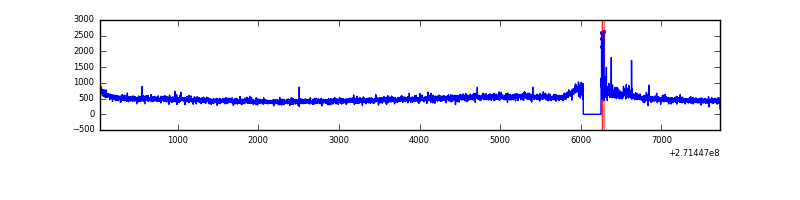 |
| D | 7692 | 7473 | 141 | 141 | 1.83% | 1.89% | 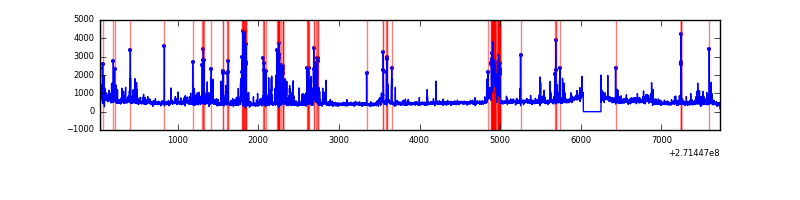 |
Top three noisy pixels from each quadrant. If the there are fewer than three noisy pixels in the level2.evt file, extra rows are filled as -1
| Pixel properties | Quadrant properties | ||||||
|---|---|---|---|---|---|---|---|
| Quadrant | DetID | PixID | Counts | Sigma | Mean | Median | Sigma |
| A | 9 | 143 | 24876 | 131.27 | 898 | 880 | 182.8 |
| A | 13 | 248 | 22983 | 120.91 | 898 | 880 | 182.8 |
| A | 15 | 157 | 14311 | 73.47 | 898 | 880 | 182.8 |
| B | 10 | 245 | 145325 | 841.64 | 896 | 873 | 171.6 |
| B | 7 | 220 | 110757 | 640.23 | 896 | 873 | 171.6 |
| B | 0 | 189 | 93027 | 536.93 | 896 | 873 | 171.6 |
| C | 3 | 233 | 240218 | 1200.35 | 849 | 854 | 199.4 |
| C | 14 | 238 | 131027 | 652.79 | 849 | 854 | 199.4 |
| C | 13 | 61 | 6534 | 28.48 | 849 | 854 | 199.4 |
| D | 2 | 33 | 419851 | 1986.8 | 857 | 830 | 210.9 |
| D | 1 | 52 | 358165 | 1694.31 | 857 | 830 | 210.9 |
| D | 5 | 222 | 153704 | 724.86 | 857 | 830 | 210.9 |
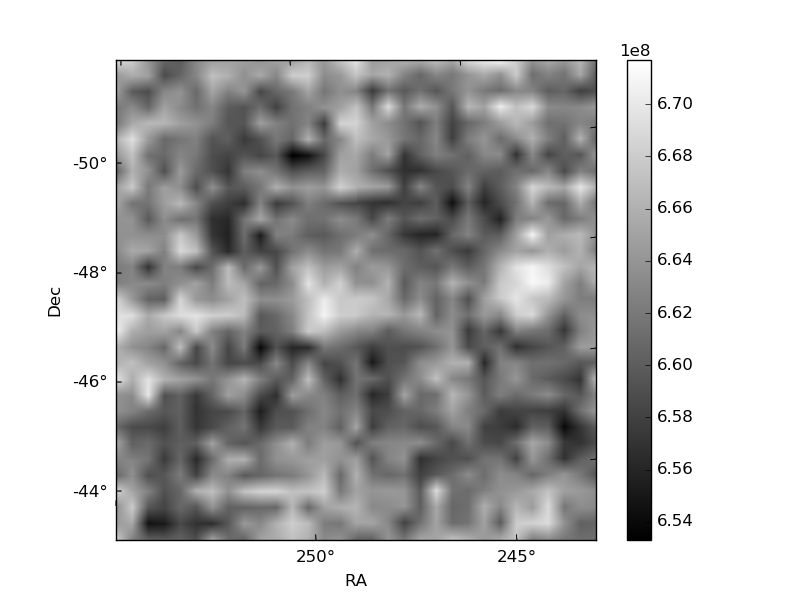
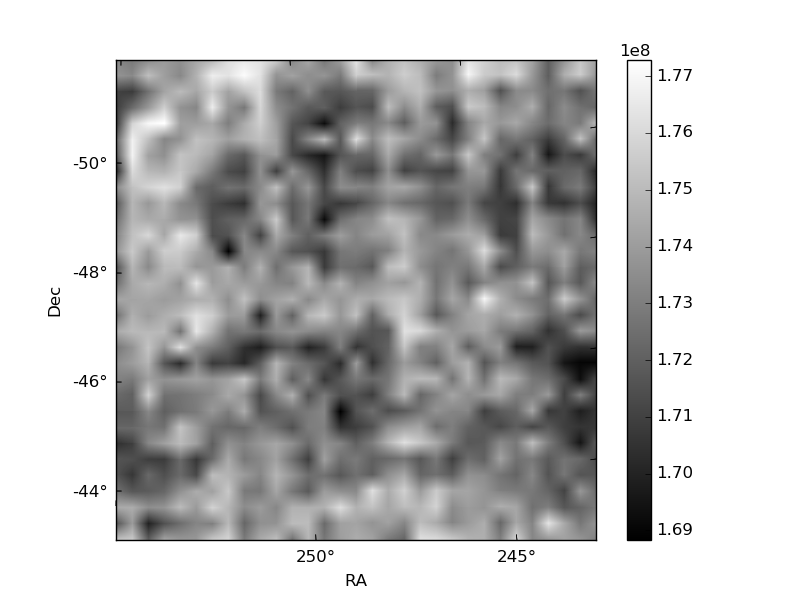
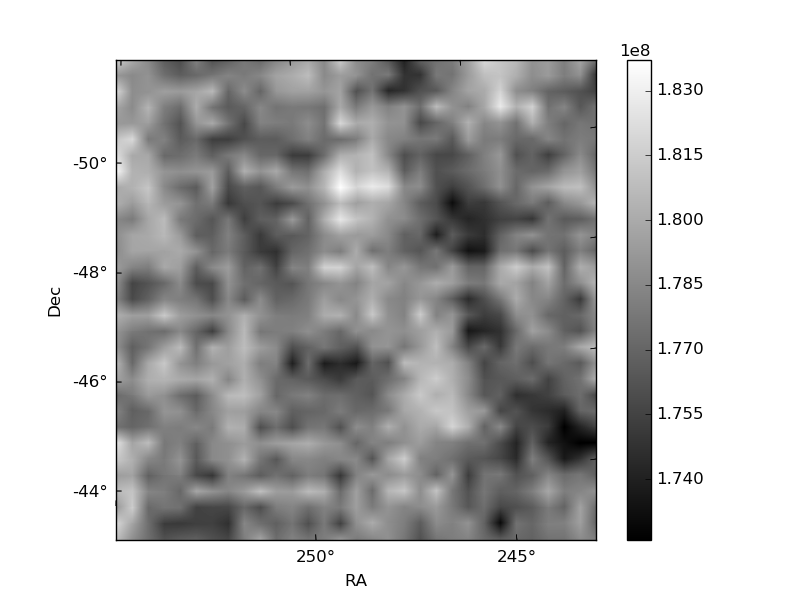
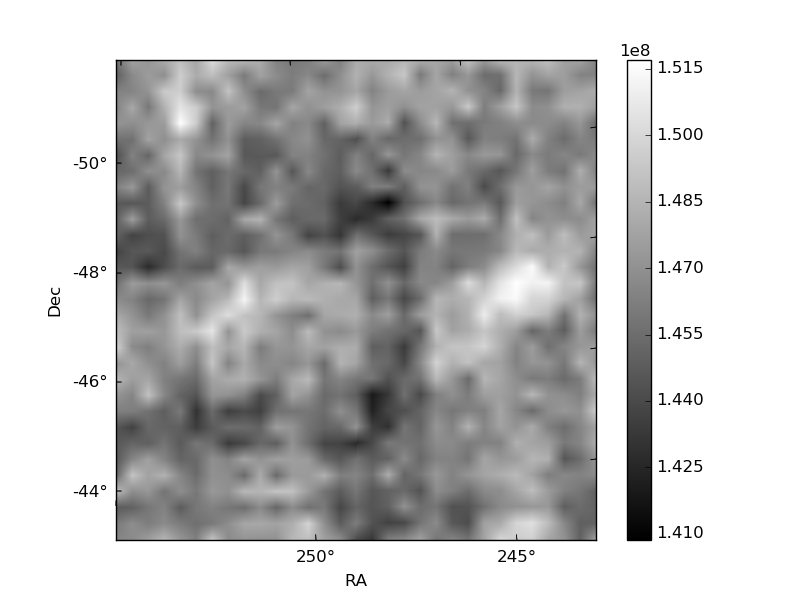
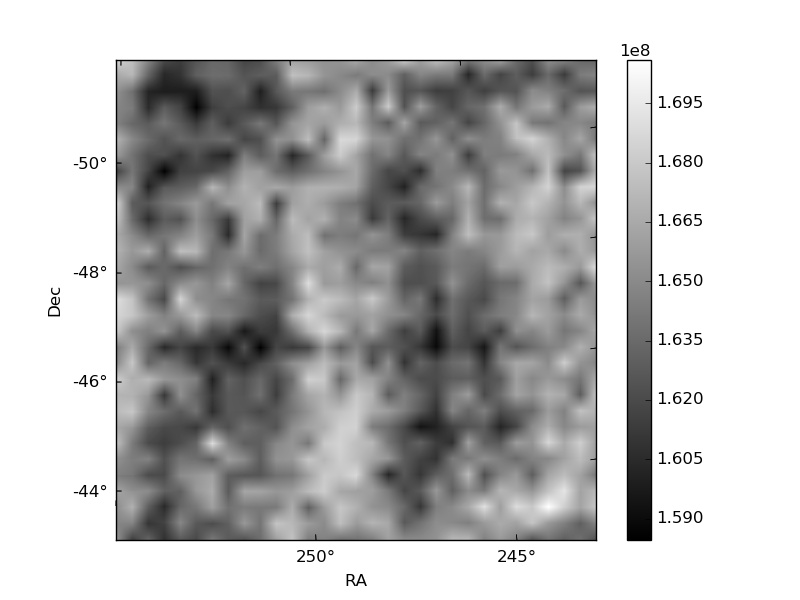
Histogram calculated using DETX and DETY for each event in the final _common_clean file
| Quadrant A | 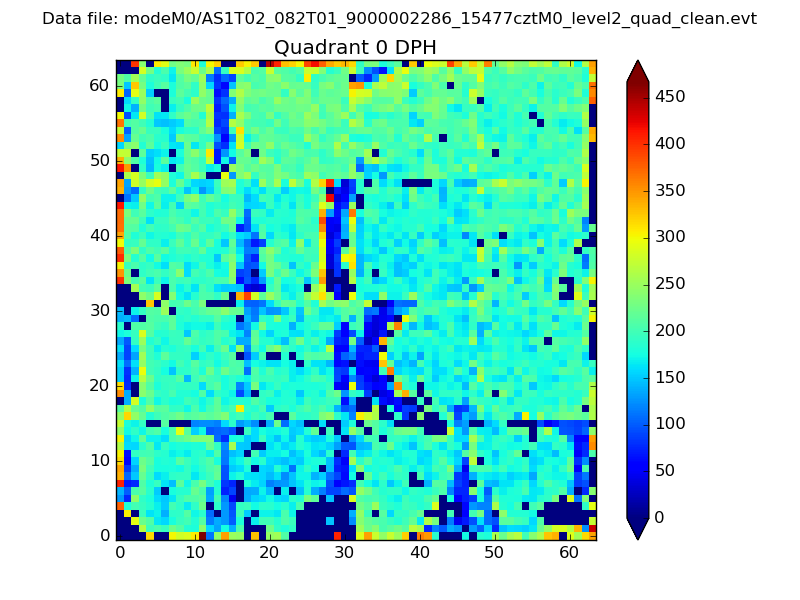 |
 |
Quadrant B |
|---|---|---|---|
| Quadrant D | 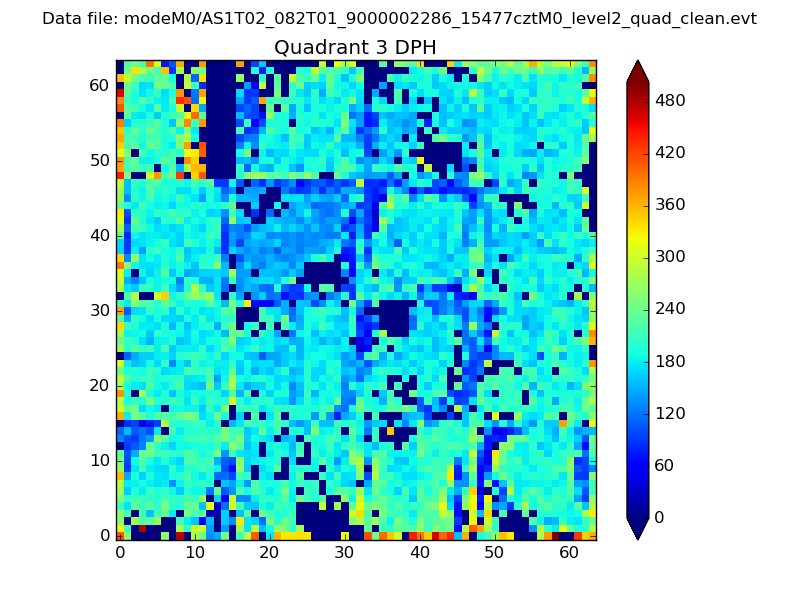 |
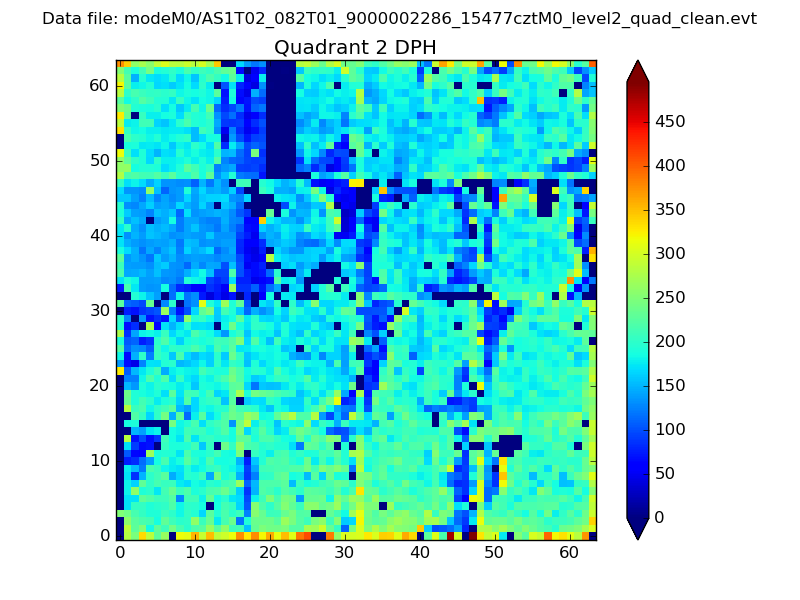 |
Quadrant C |
| Plot type | Count rate plots | Images |
|---|---|---|
| Comparison with Poisson distribution Blue bars denote a histogram of data divided into 1 sec bins. Red curve is a Poisson curve with rate = median count rate of data. |
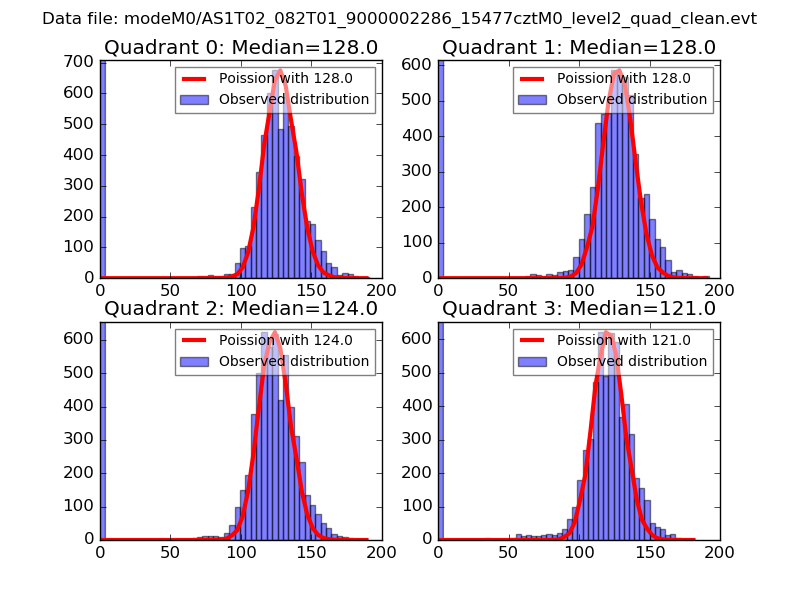 |
 |
| Quadrant-wise count rates Data is divided into 100 sec bins |
 |
|
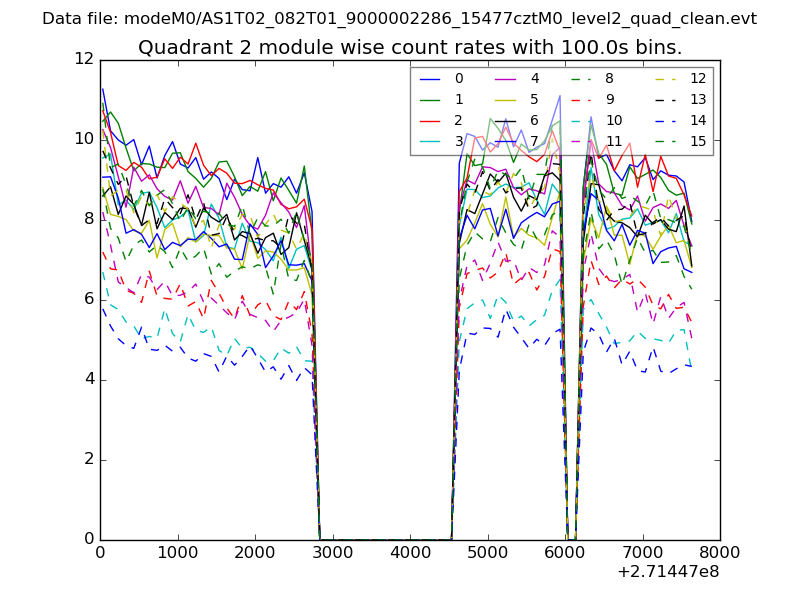
| Module-wise count rates for Quadrant A Data is divided into 100 sec bins |
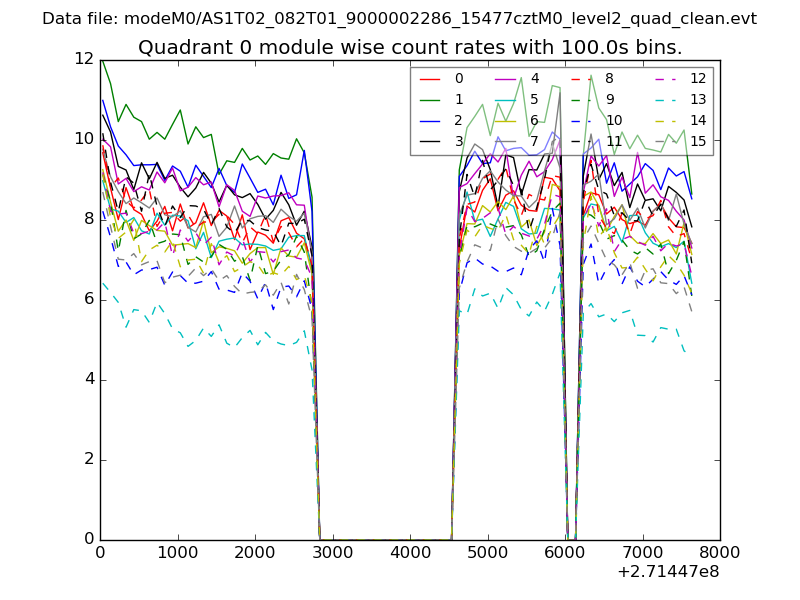 |
 |
| Module-wise count rates for Quadrant B Data is divided into 100 sec bins |
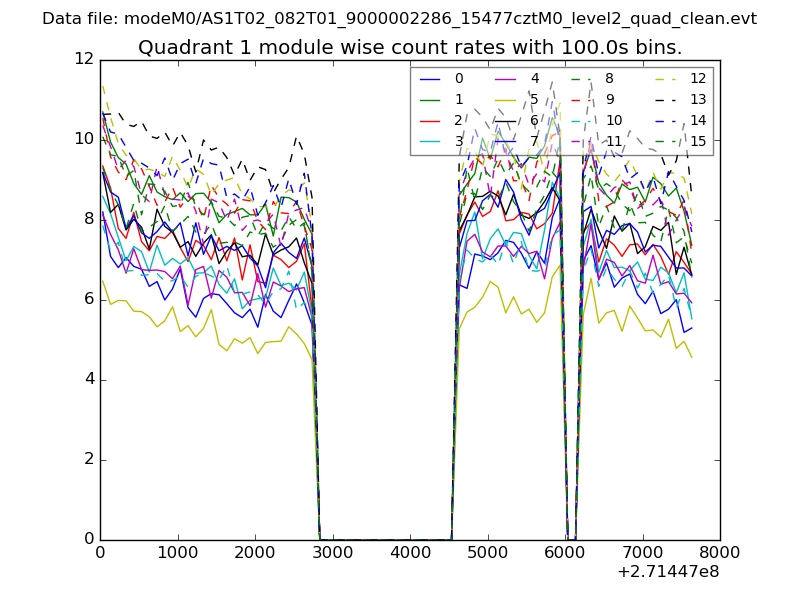 |
 |
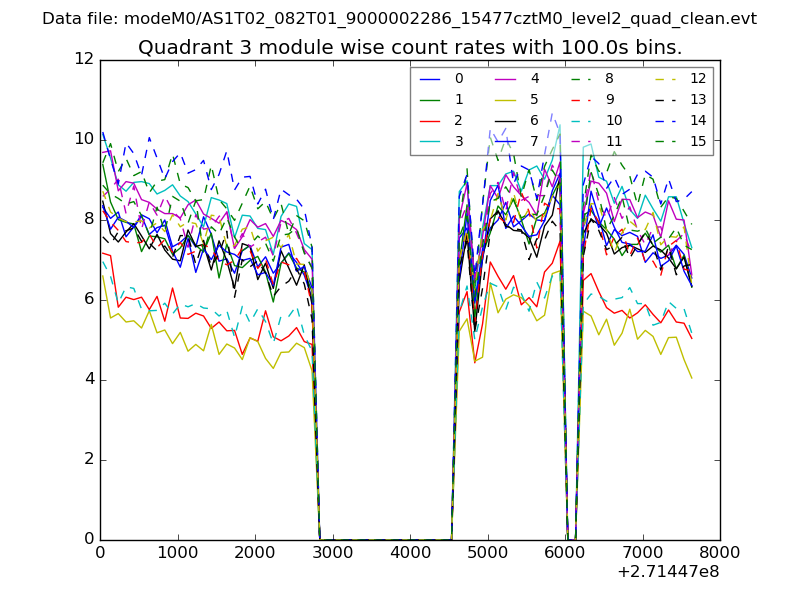
| Module-wise count rates for Quadrant C Data is divided into 100 sec bins |
 |
 |
| Module-wise count rates for Quadrant D Data is divided into 100 sec bins |
 |
 |
| Parameter | Plot |
|---|---|
| CZT HV Monitor | 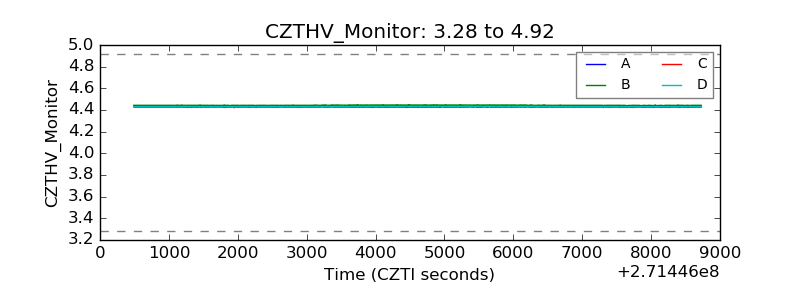 |
| D_VDD | 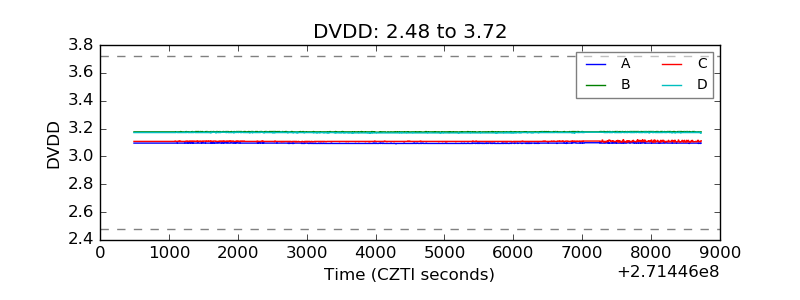 |
| Temperature 1 | 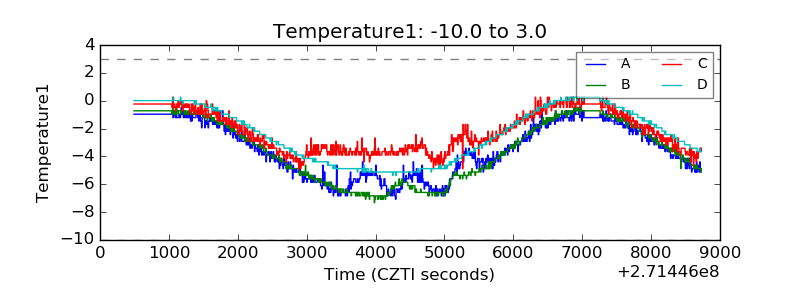 |
| Veto HV Monitor | 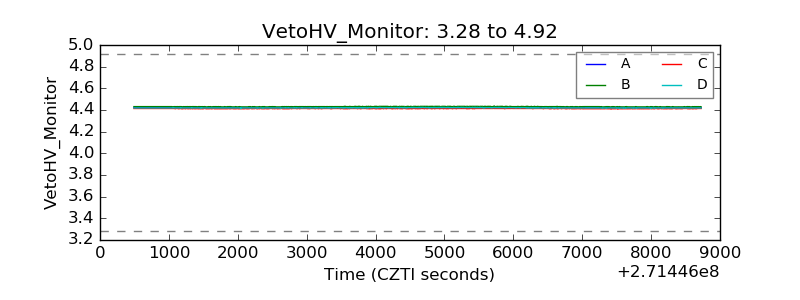 |
| Veto LLD | 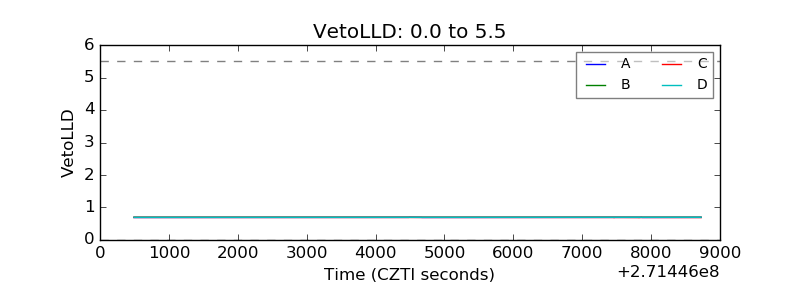 |
| Alpha Counter | 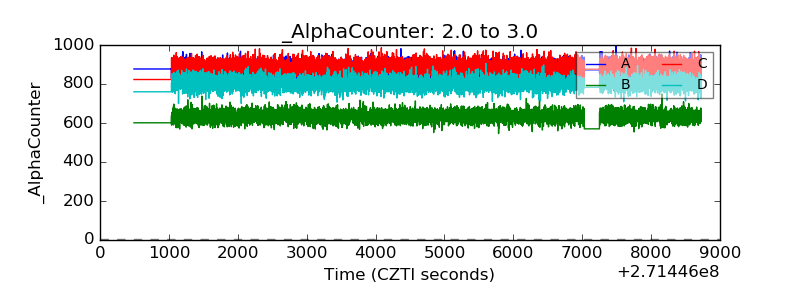 |
| _CPM_Rate | 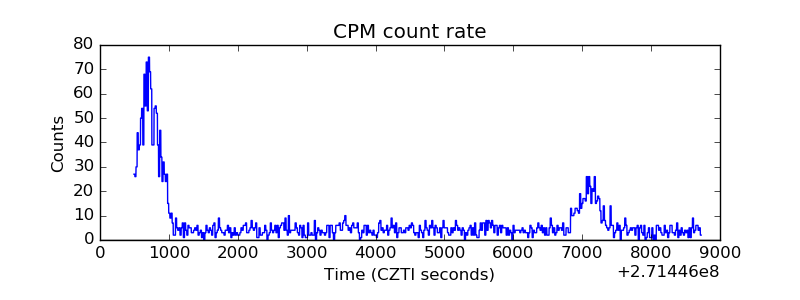 |
| CZT Counter | 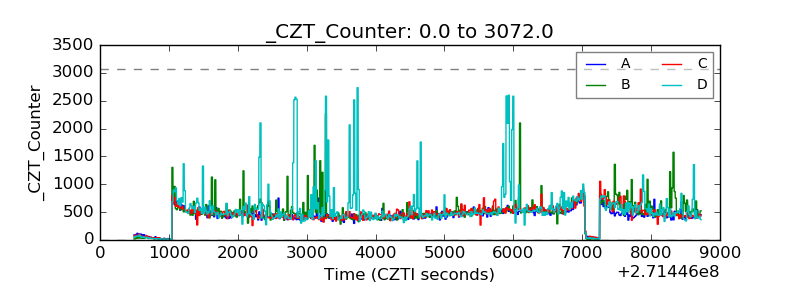 |
| +2.5 Volts monitor |  |
| +5 Volts monitor |  |
| _ROLL_ROT | 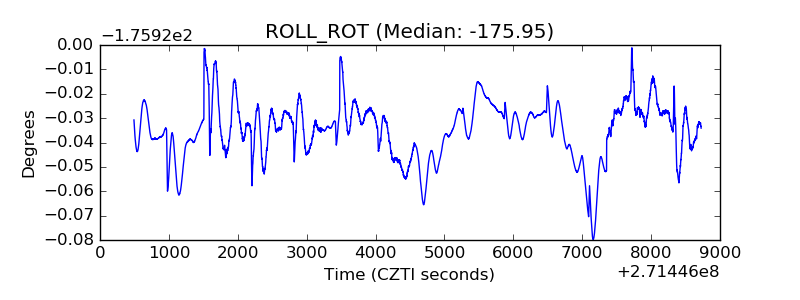 |
| _Roll_DEC | 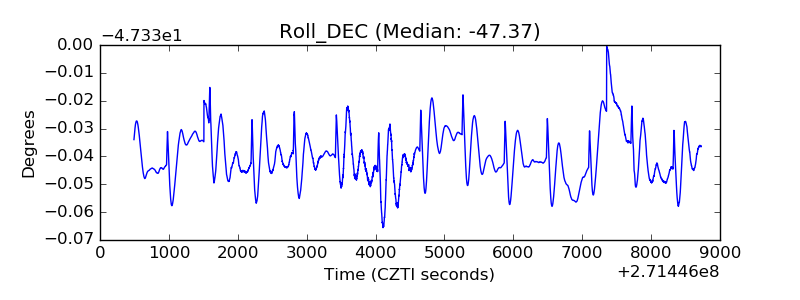 |
| _Roll_RA | 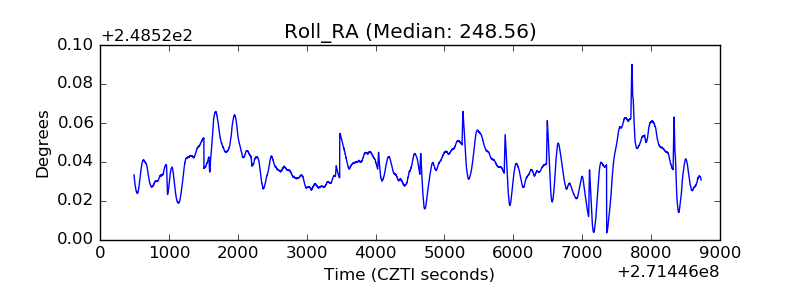 |
| Veto Counter | 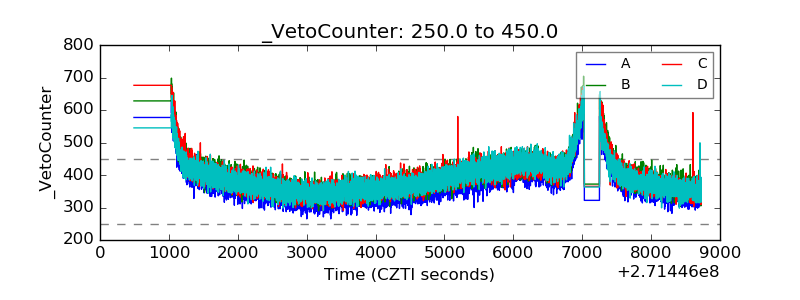 |