| Param | Original file | Final file |
|---|---|---|
| Filename | modeM0/AS1T02_082T01_9000002286_15478cztM0_level2.evt | modeM0/AS1T02_082T01_9000002286_15478cztM0_level2_quad_clean.evt |
| Size (bytes) | 529,525,440 | 111,035,520 |
| Size | 505.0 MB | 105.9 MB |
| Events in quadrant A | 3,581,251 | 723,328 |
| Events in quadrant B | 4,119,003 | 723,896 |
| Events in quadrant C | 3,664,349 | 701,540 |
| Events in quadrant D | 4,159,705 | 688,794 |
| Mode M0 | |||
|---|---|---|---|
| Quadrant | BADHDUFLAG | Total packets | Discarded packets |
| A | 0 | 15791 | 3 |
| B | 0 | 17095 | 2 |
| C | 0 | 15813 | 2 |
| D | 0 | 17624 | 2 |
| Mode SS | |||
|---|---|---|---|
| Quadrant | BADHDUFLAG | Total packets | Discarded packets |
| A | 0 | 152 | 0 |
| B | 0 | 152 | 0 |
| C | 0 | 152 | 0 |
| D | 0 | 152 | 0 |
| Mode M9 | |||
|---|---|---|---|
| Quadrant | BADHDUFLAG | Total packets | Discarded packets |
| A | 0 | 4 | 0 |
| B | 0 | 4 | 0 |
| C | 0 | 4 | 0 |
| D | 0 | 4 | 0 |
| Quadrant | Total seconds | Saturated seconds | Saturation percentage |
|---|---|---|---|
| A | 7553 | 39 | 0.516351% |
| B | 7553 | 95 | 1.257778% |
| C | 7553 | 82 | 1.085661% |
| D | 7553 | 118 | 1.562293% |
Noise dominated data is calculated using 1-second bins in cleaned event files. If a bin has >2000 counts, and if more than 50% of those come from <1% of pixels, then it is considered to be noise-dominated and hence unusable.
| Quadrant | # 1 sec bins | Bins with >0 counts | Bins with >2000 counts | High rate bins dominated by noise | Noise dominated (total time) | Noise dominated (detector-on time) | Marked lightcurve |
|---|---|---|---|---|---|---|---|
| A | 7839 | 7555 | 4 | 4 | 0.05% | 0.05% | 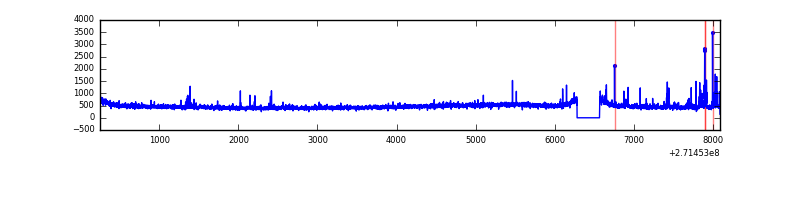 |
| B | 7839 | 7555 | 22 | 22 | 0.28% | 0.29% | 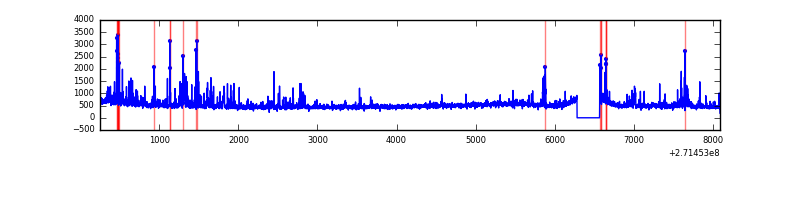 |
| C | 7839 | 7555 | 4 | 4 | 0.05% | 0.05% | 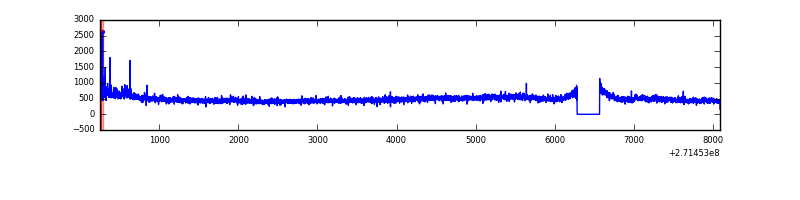 |
| D | 7839 | 7555 | 65 | 65 | 0.83% | 0.86% | 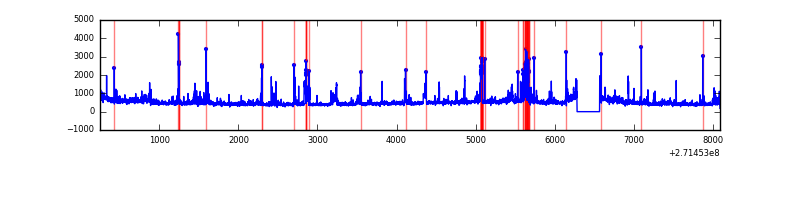 |
Top three noisy pixels from each quadrant. If the there are fewer than three noisy pixels in the level2.evt file, extra rows are filled as -1
| Pixel properties | Quadrant properties | ||||||
|---|---|---|---|---|---|---|---|
| Quadrant | DetID | PixID | Counts | Sigma | Mean | Median | Sigma |
| A | 14 | 238 | 78691 | 430.28 | 892 | 875 | 180.8 |
| A | 9 | 143 | 33692 | 181.46 | 892 | 875 | 180.8 |
| A | 13 | 248 | 13776 | 71.34 | 892 | 875 | 180.8 |
| B | 7 | 220 | 110124 | 641.9 | 893 | 870 | 170.2 |
| B | 10 | 245 | 104828 | 610.78 | 893 | 870 | 170.2 |
| B | 0 | 197 | 80718 | 469.13 | 893 | 870 | 170.2 |
| C | 3 | 233 | 205352 | 1031.2 | 846 | 851 | 198.3 |
| C | 14 | 238 | 131256 | 657.57 | 846 | 851 | 198.3 |
| C | 8 | 128 | 10374 | 48.02 | 846 | 851 | 198.3 |
| D | 2 | 33 | 309662 | 1454.66 | 857 | 830 | 212.3 |
| D | 1 | 52 | 169317 | 793.61 | 857 | 830 | 212.3 |
| D | 5 | 222 | 166383 | 779.79 | 857 | 830 | 212.3 |
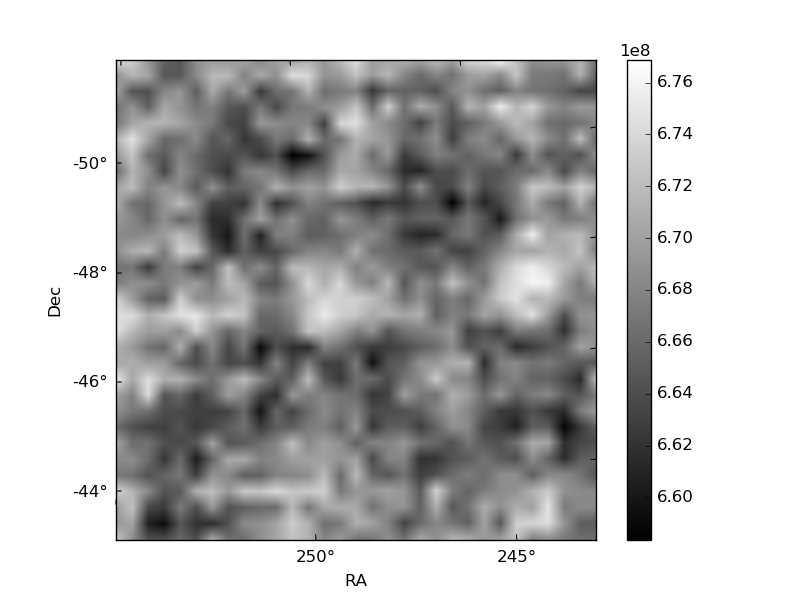
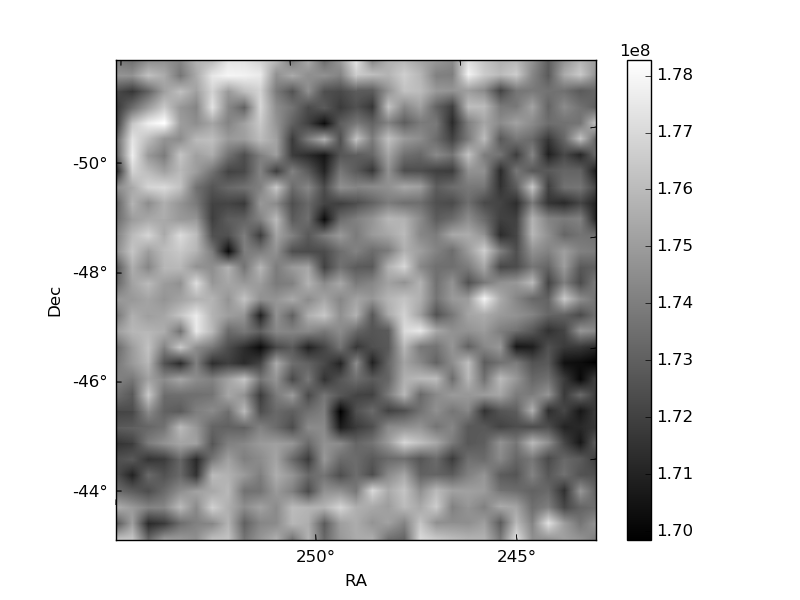
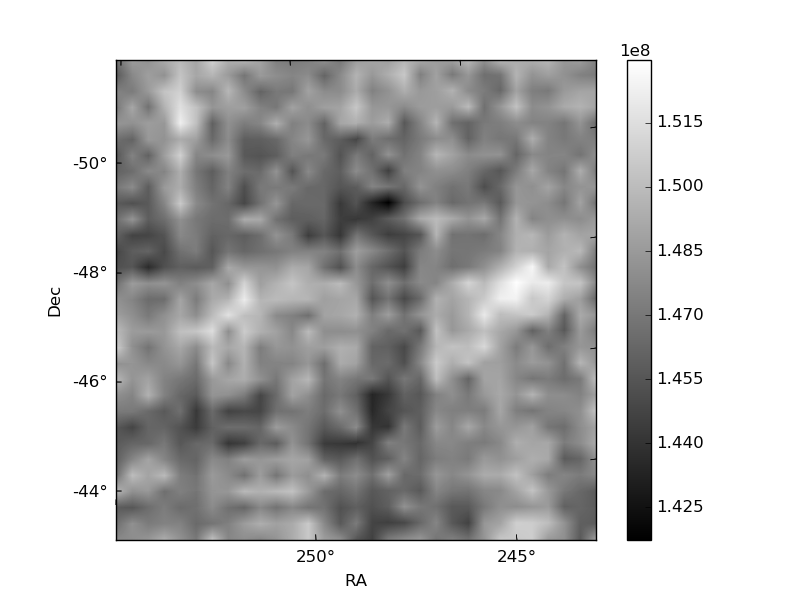
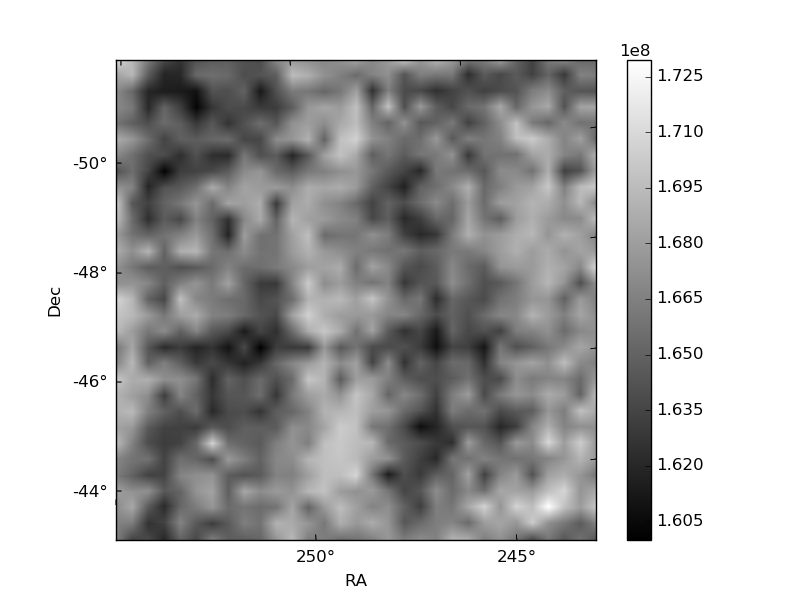
Histogram calculated using DETX and DETY for each event in the final _common_clean file
| Quadrant A | 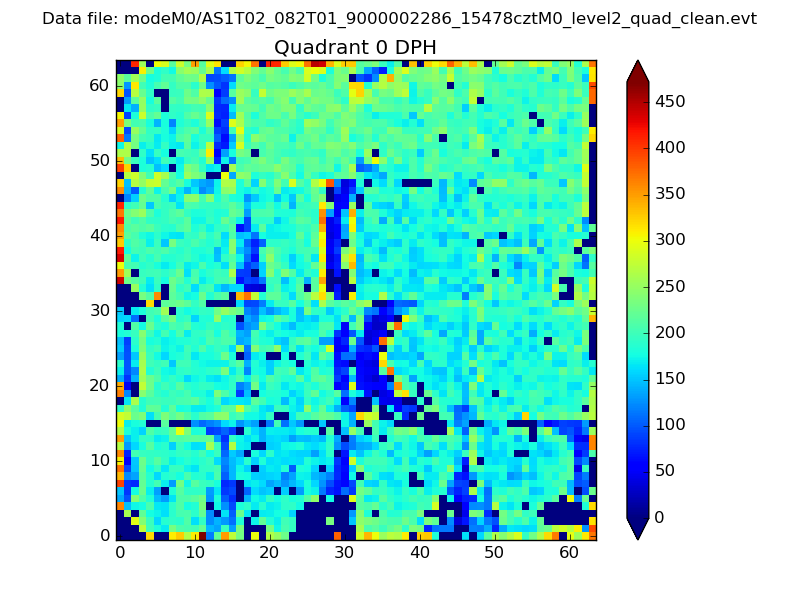 |
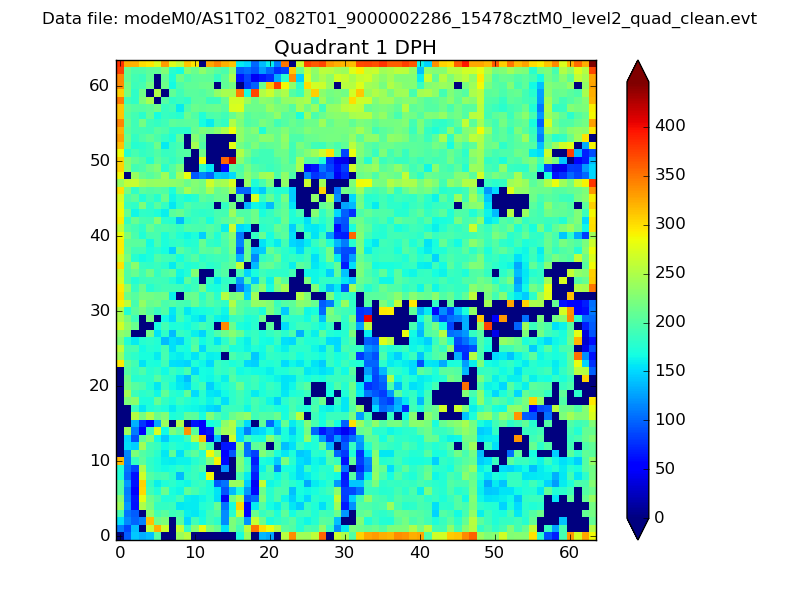 |
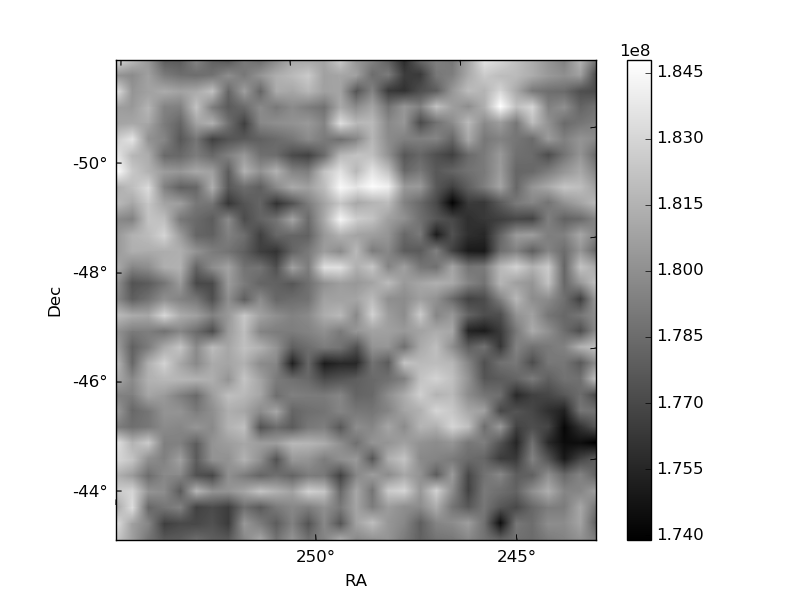
Quadrant B |
|---|---|---|---|
| Quadrant D | 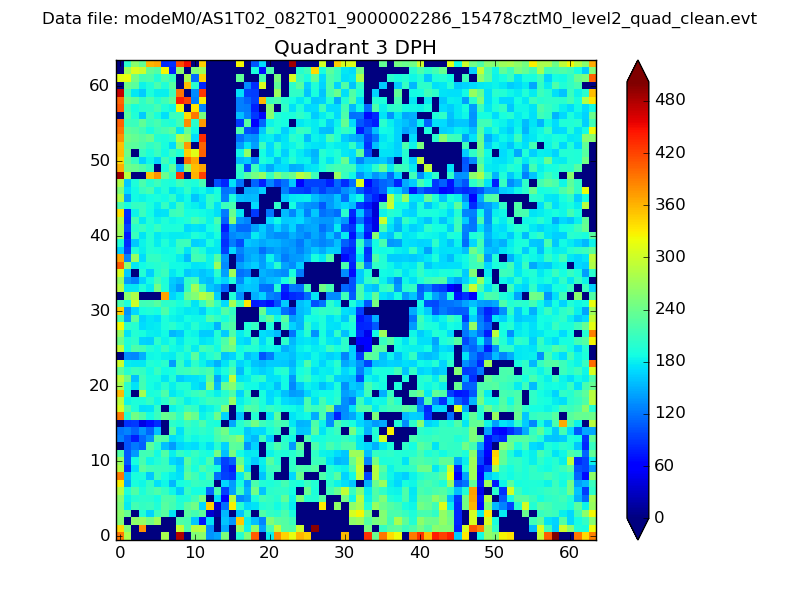 |
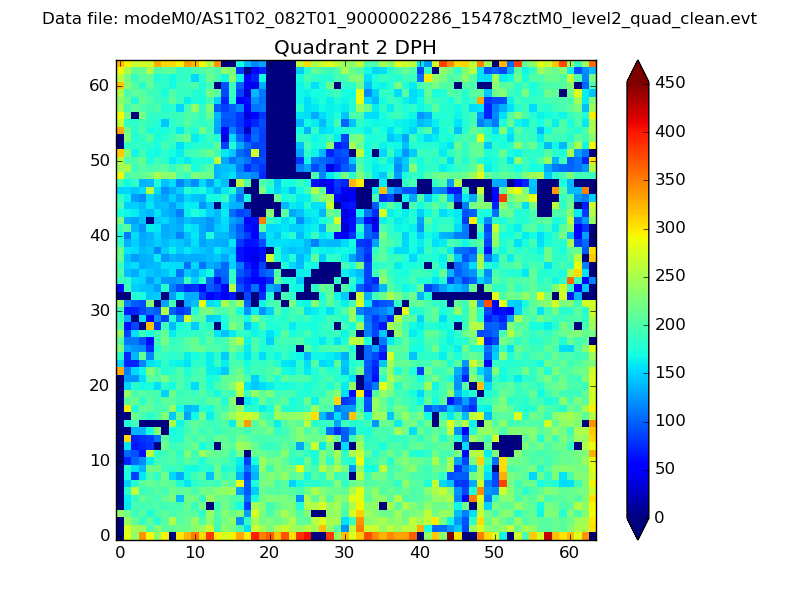 |
Quadrant C |
| Plot type | Count rate plots | Images |
|---|---|---|
| Comparison with Poisson distribution Blue bars denote a histogram of data divided into 1 sec bins. Red curve is a Poisson curve with rate = median count rate of data. |
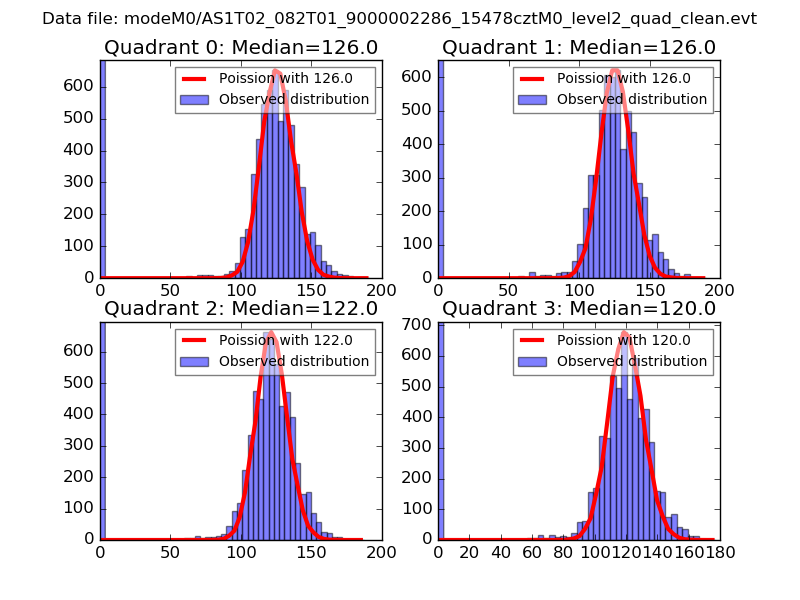 |
 |
| Quadrant-wise count rates Data is divided into 100 sec bins |
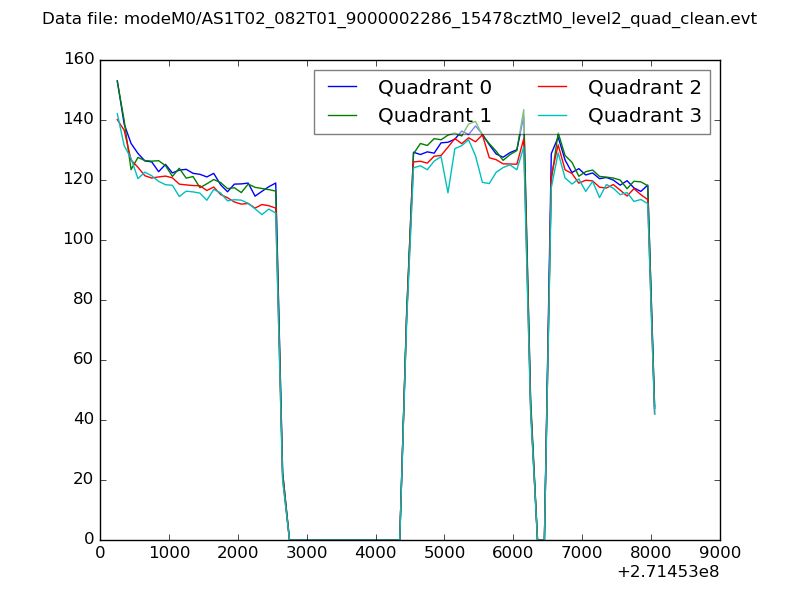 |
|
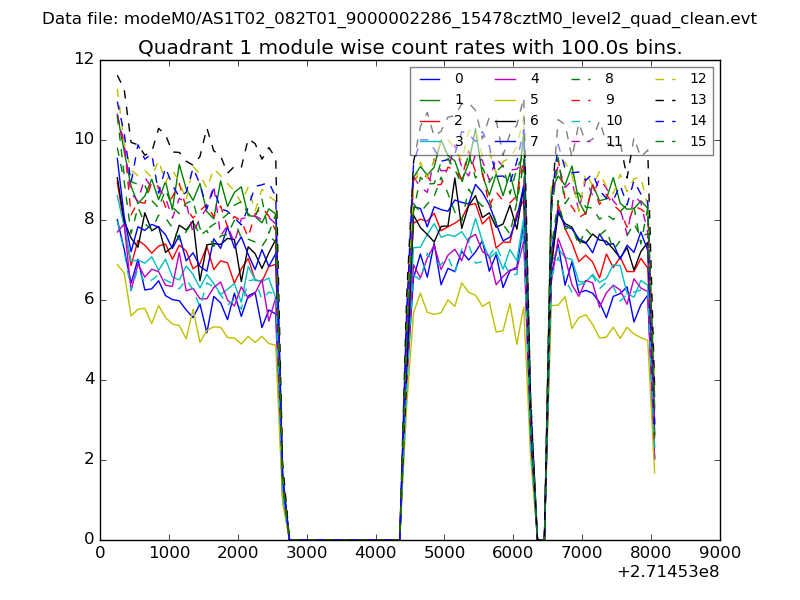
| Module-wise count rates for Quadrant A Data is divided into 100 sec bins |
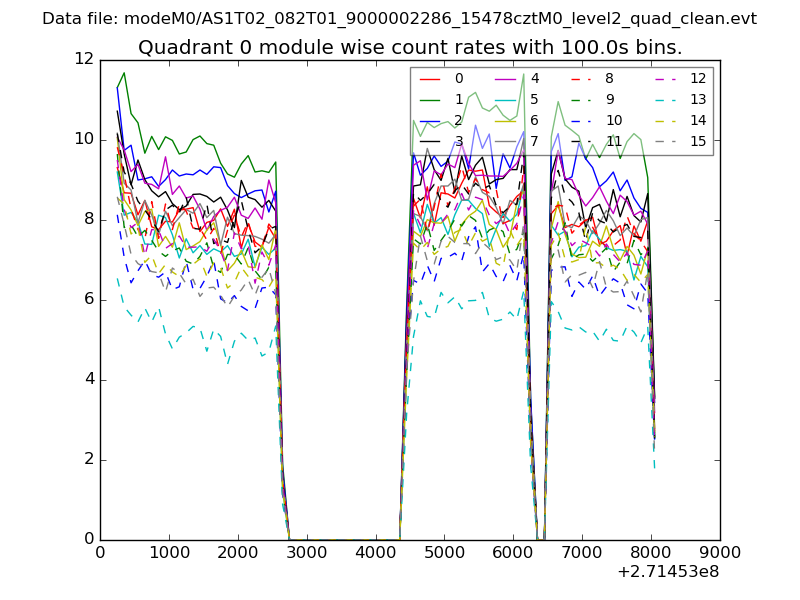 |
 |
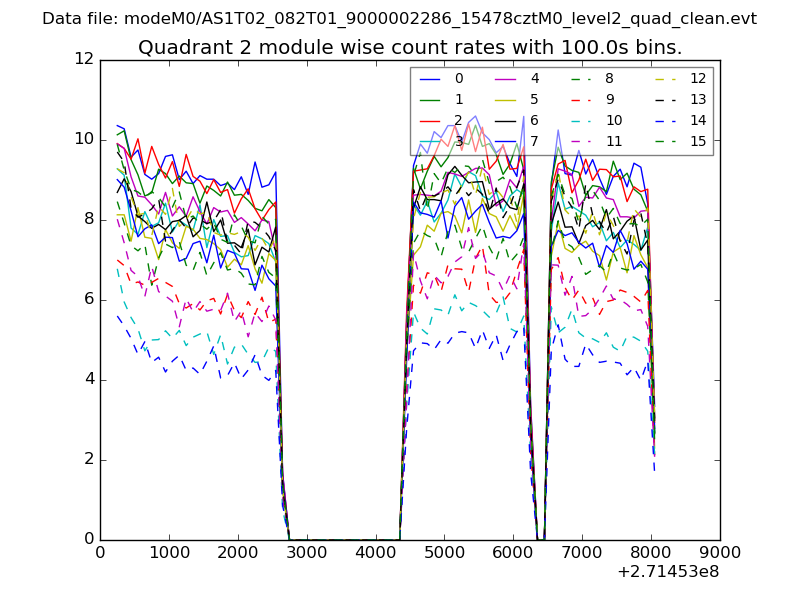
| Module-wise count rates for Quadrant B Data is divided into 100 sec bins |
 |
 |
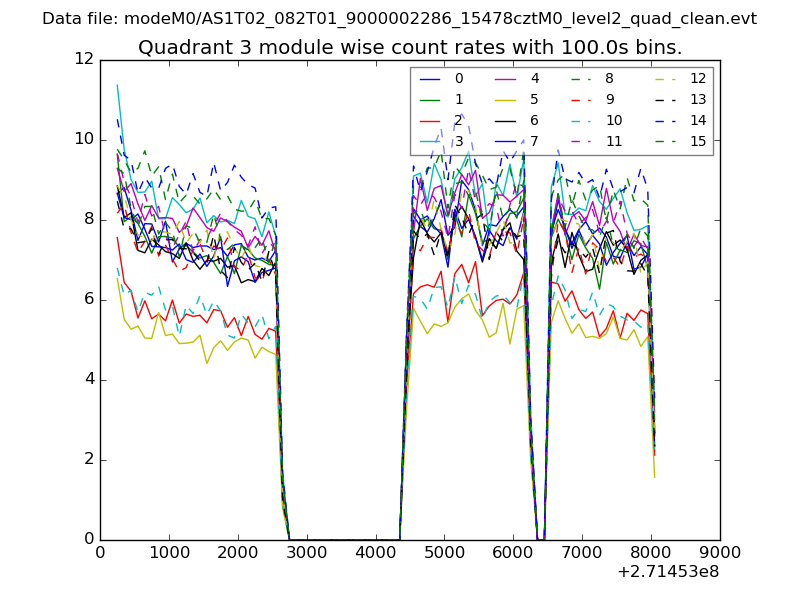
| Module-wise count rates for Quadrant C Data is divided into 100 sec bins |
 |
 |
| Module-wise count rates for Quadrant D Data is divided into 100 sec bins |
 |
 |
| Parameter | Plot |
|---|---|
| CZT HV Monitor | 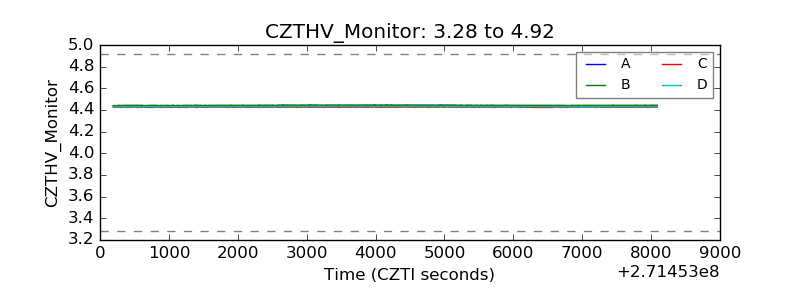 |
| D_VDD | 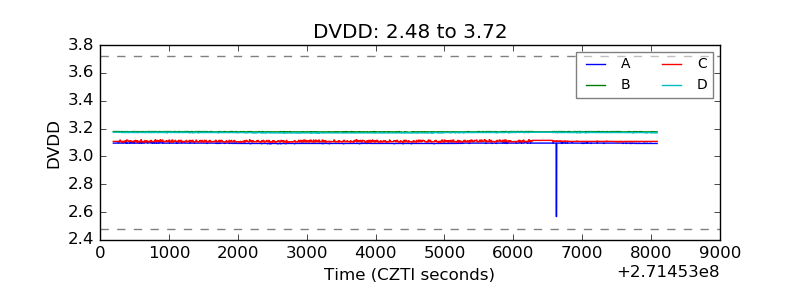 |
| Temperature 1 | 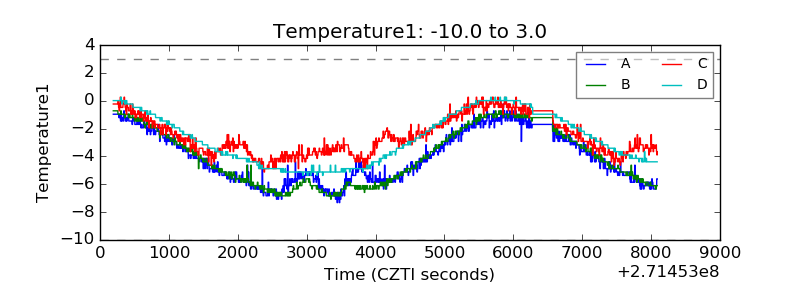 |
| Veto HV Monitor | 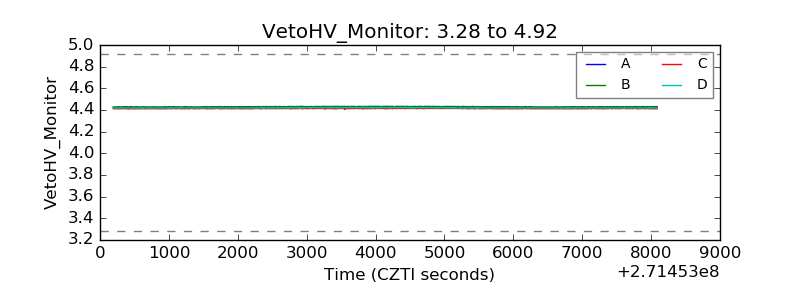 |
| Veto LLD | 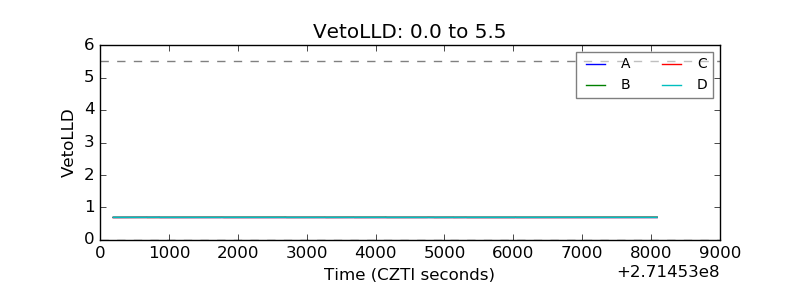 |
| Alpha Counter | 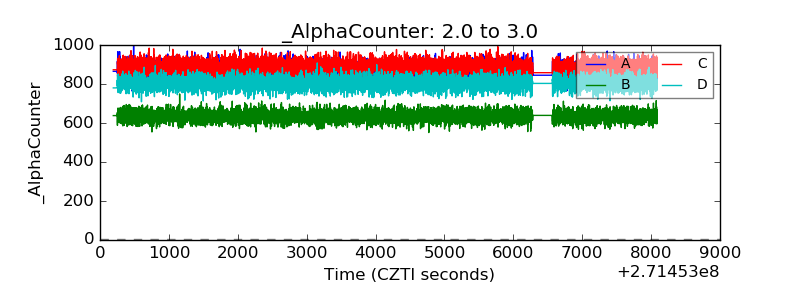 |
| _CPM_Rate | 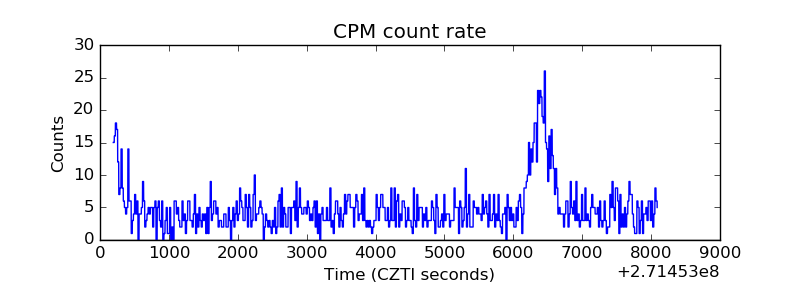 |
| CZT Counter | 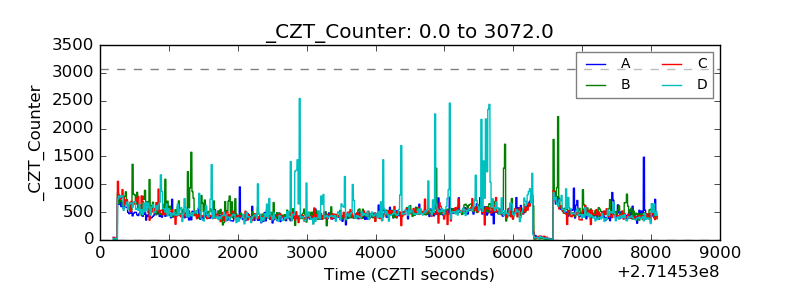 |
| +2.5 Volts monitor | 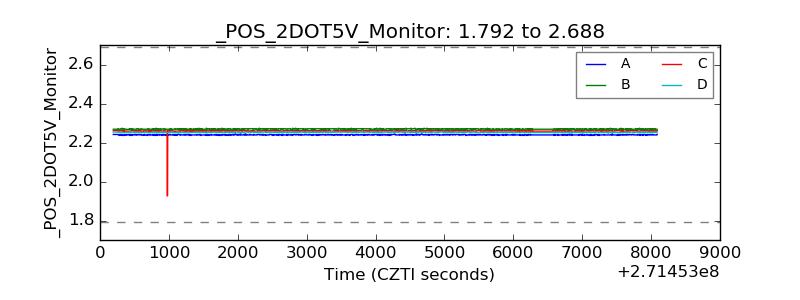 |
| +5 Volts monitor | 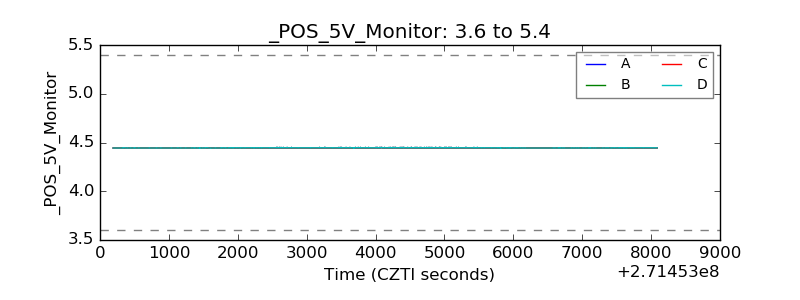 |
| _ROLL_ROT | 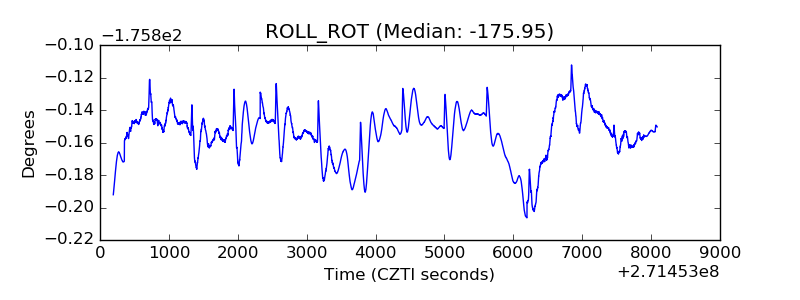 |
| _Roll_DEC | 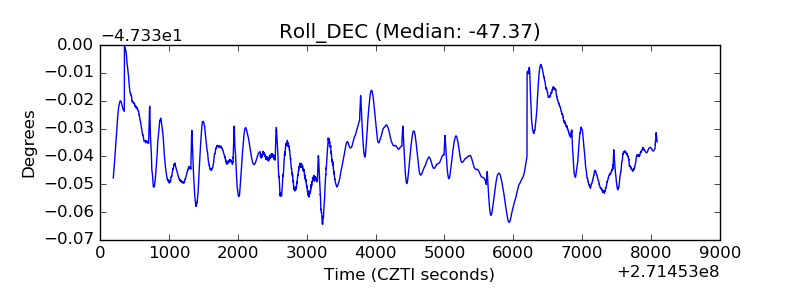 |
| _Roll_RA | 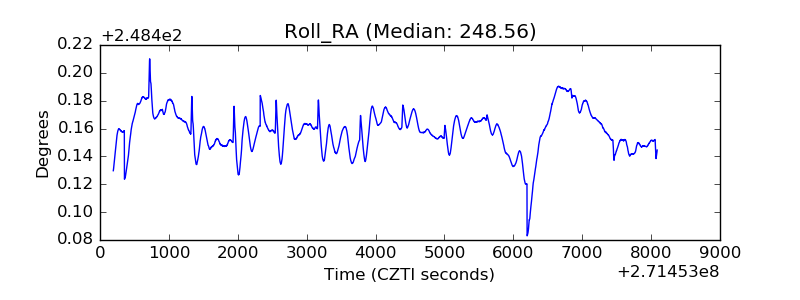 |
| Veto Counter | 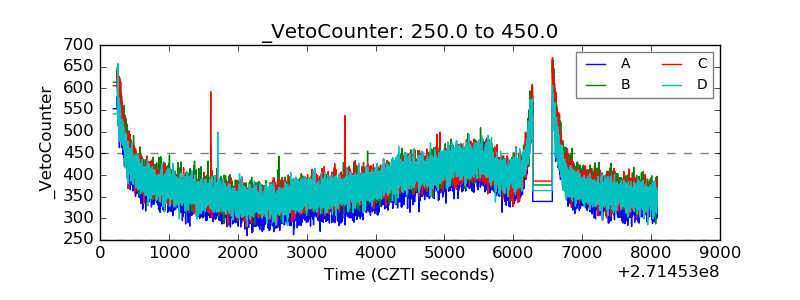 |