| Param | Original file | Final file |
|---|---|---|
| Filename | modeM0/AS1T02_082T01_9000002286_15482cztM0_level2.evt | modeM0/AS1T02_082T01_9000002286_15482cztM0_level2_quad_clean.evt |
| Size (bytes) | 534,144,960 | 87,540,480 |
| Size | 509.4 MB | 83.5 MB |
| Events in quadrant A | 3,458,875 | 544,273 |
| Events in quadrant B | 3,734,468 | 548,389 |
| Events in quadrant C | 4,103,982 | 531,975 |
| Events in quadrant D | 4,380,555 | 514,534 |
| Mode M0 | |||
|---|---|---|---|
| Quadrant | BADHDUFLAG | Total packets | Discarded packets |
| A | 0 | 15118 | 3 |
| B | 0 | 15678 | 2 |
| C | 0 | 16724 | 2 |
| D | 0 | 17988 | 2 |
| Mode SS | |||
|---|---|---|---|
| Quadrant | BADHDUFLAG | Total packets | Discarded packets |
| A | 0 | 150 | 0 |
| B | 0 | 150 | 0 |
| C | 0 | 150 | 0 |
| D | 0 | 150 | 0 |
| Mode M9 | |||
|---|---|---|---|
| Quadrant | BADHDUFLAG | Total packets | Discarded packets |
| A | 0 | 18 | 0 |
| B | 0 | 18 | 0 |
| C | 0 | 18 | 0 |
| D | 0 | 18 | 0 |
| Quadrant | Total seconds | Saturated seconds | Saturation percentage |
|---|---|---|---|
| A | 7354 | 70 | 0.951863% |
| B | 7354 | 104 | 1.414196% |
| C | 7354 | 169 | 2.298069% |
| D | 7354 | 204 | 2.774001% |
Noise dominated data is calculated using 1-second bins in cleaned event files. If a bin has >2000 counts, and if more than 50% of those come from <1% of pixels, then it is considered to be noise-dominated and hence unusable.
| Quadrant | # 1 sec bins | Bins with >0 counts | Bins with >2000 counts | High rate bins dominated by noise | Noise dominated (total time) | Noise dominated (detector-on time) | Marked lightcurve |
|---|---|---|---|---|---|---|---|
| A | 9115 | 7357 | 2 | 2 | 0.02% | 0.03% | 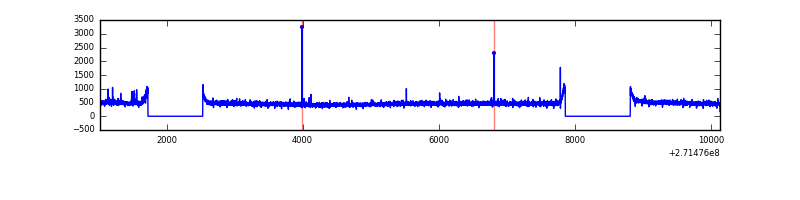 |
| B | 9115 | 7356 | 9 | 9 | 0.10% | 0.12% | 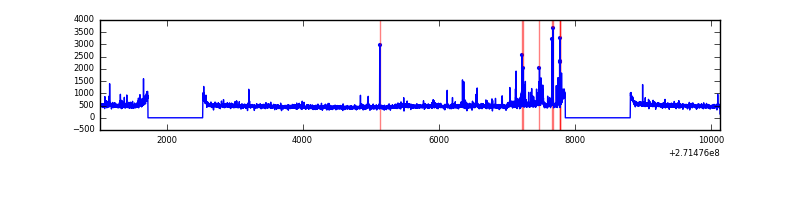 |
| C | 9115 | 7355 | 5 | 5 | 0.05% | 0.07% | 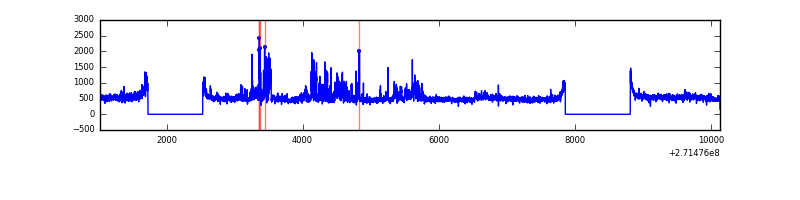 |
| D | 9115 | 7356 | 123 | 123 | 1.35% | 1.67% | 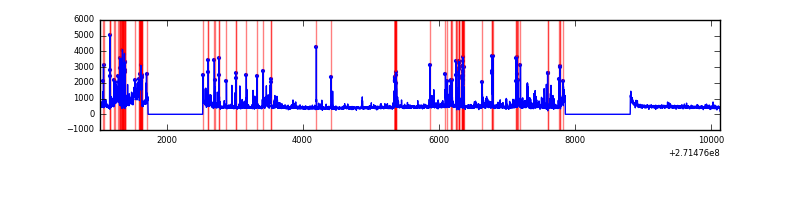 |
Top three noisy pixels from each quadrant. If the there are fewer than three noisy pixels in the level2.evt file, extra rows are filled as -1
| Pixel properties | Quadrant properties | ||||||
|---|---|---|---|---|---|---|---|
| Quadrant | DetID | PixID | Counts | Sigma | Mean | Median | Sigma |
| A | 14 | 238 | 15237 | 80.23 | 889 | 870 | 179.1 |
| A | 0 | 226 | 7911 | 39.32 | 889 | 870 | 179.1 |
| A | 15 | 69 | 7277 | 35.78 | 889 | 870 | 179.1 |
| B | 0 | 197 | 69393 | 401.19 | 891 | 870 | 170.8 |
| B | 0 | 189 | 66733 | 385.62 | 891 | 870 | 170.8 |
| B | 0 | 229 | 28852 | 163.83 | 891 | 870 | 170.8 |
| C | 3 | 233 | 629902 | 3153.8 | 853 | 858 | 199.5 |
| C | 14 | 238 | 130330 | 649.13 | 853 | 858 | 199.5 |
| C | 7 | 221 | 8908 | 40.36 | 853 | 858 | 199.5 |
| D | 1 | 52 | 576218 | 2741.37 | 858 | 831 | 209.9 |
| D | 5 | 222 | 201267 | 954.96 | 858 | 831 | 209.9 |
| D | 12 | 221 | 97701 | 461.53 | 858 | 831 | 209.9 |
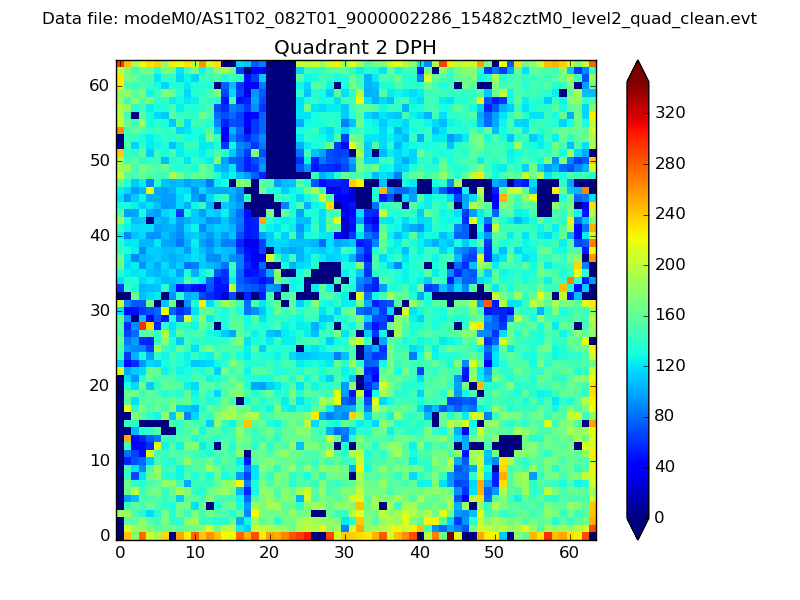
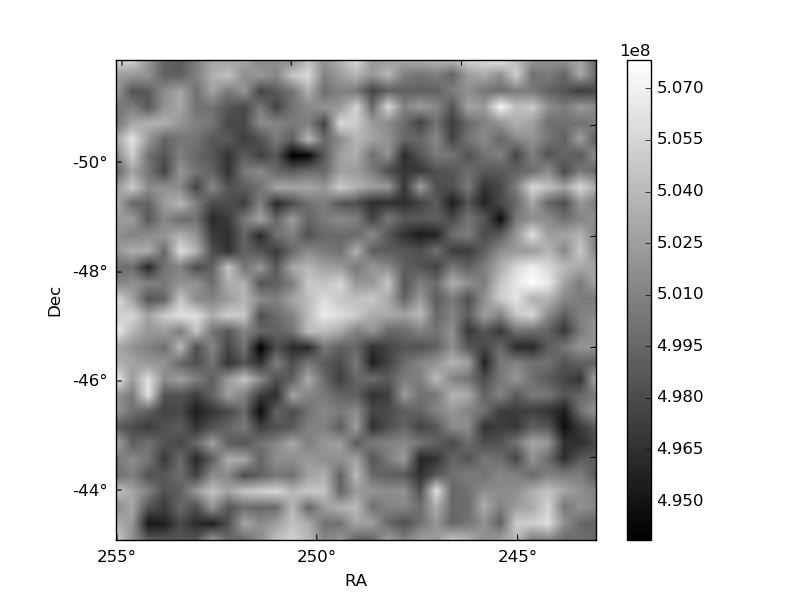
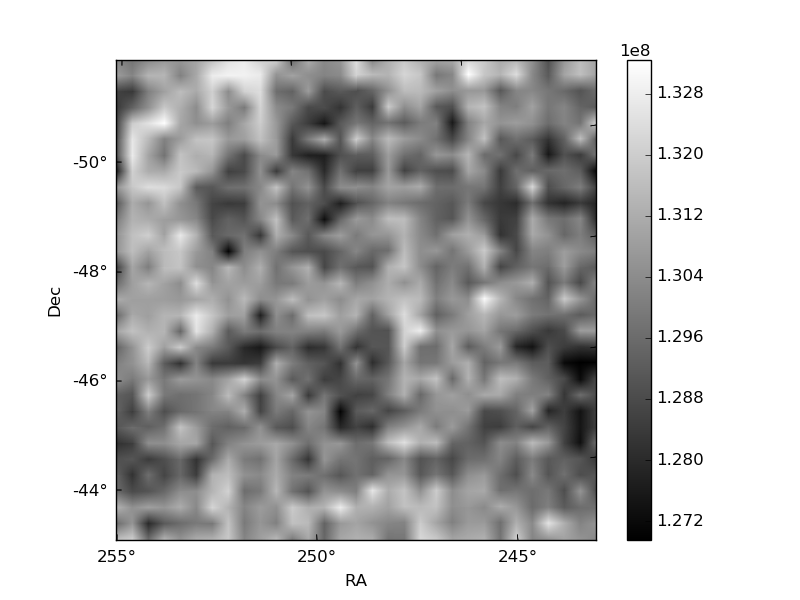
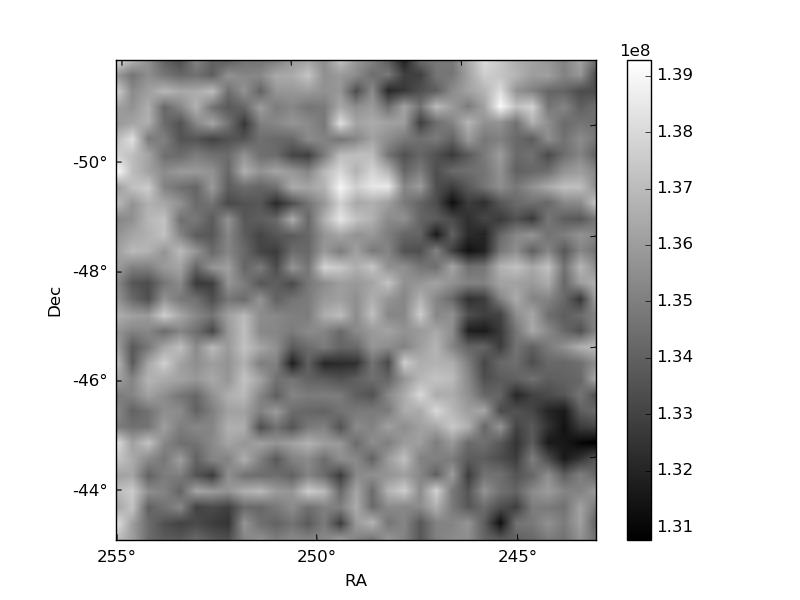
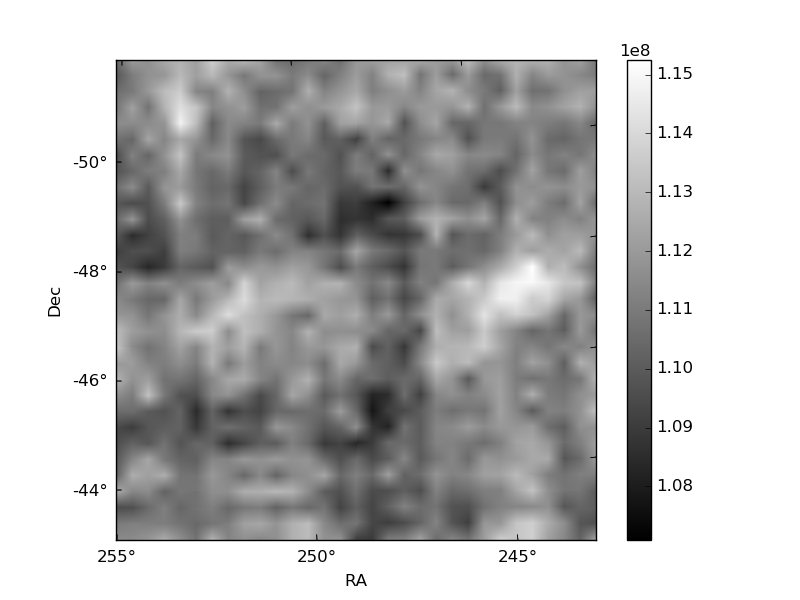
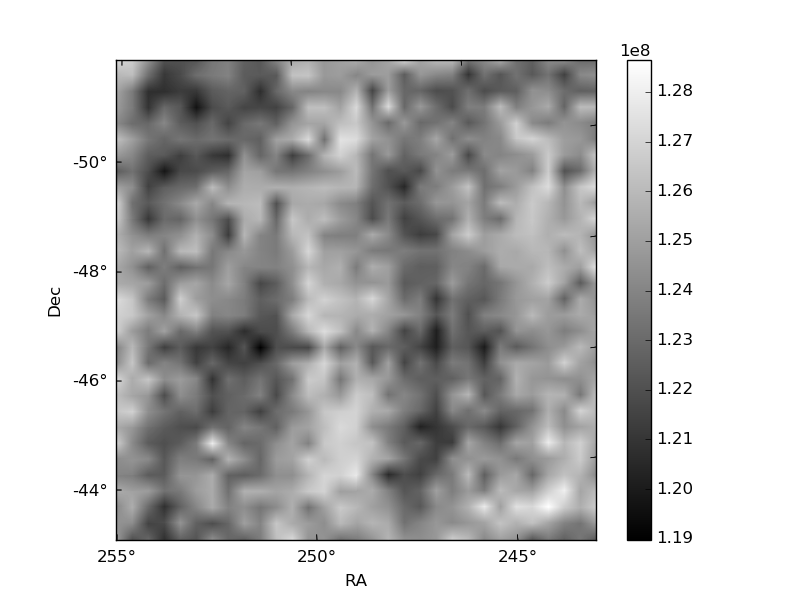
Histogram calculated using DETX and DETY for each event in the final _common_clean file
| Quadrant A | 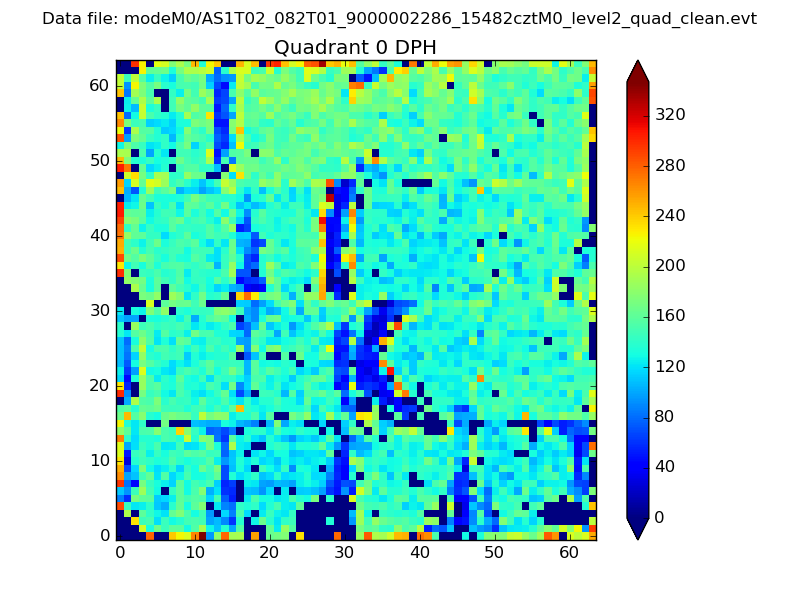 |
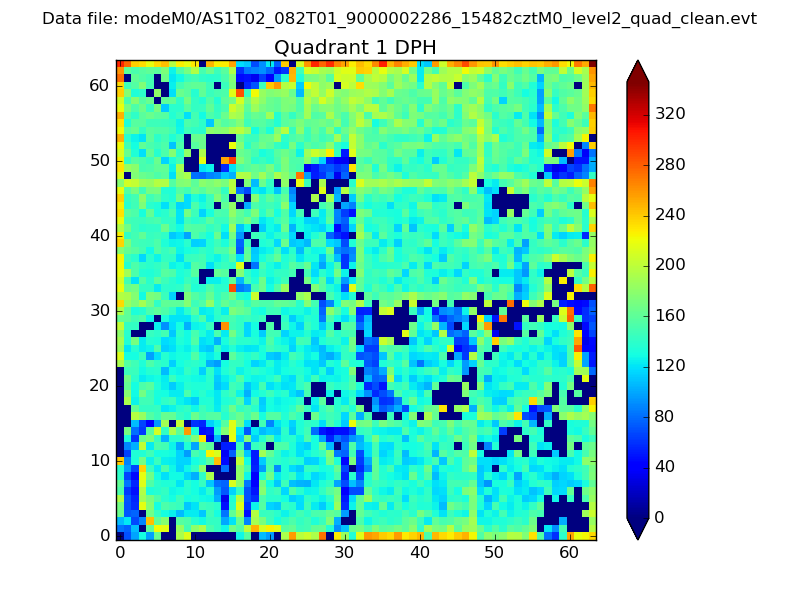 |
Quadrant B |
|---|---|---|---|
| Quadrant D | 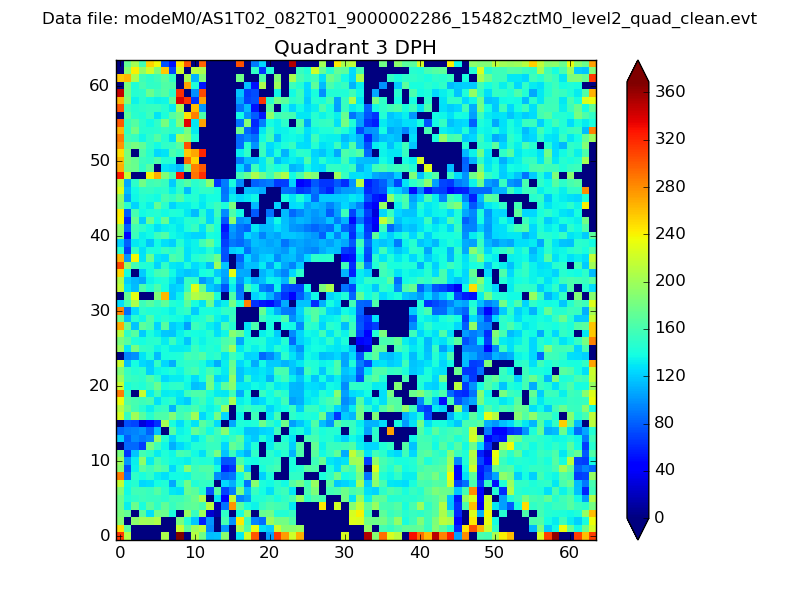 |
 |
Quadrant C |
| Plot type | Count rate plots | Images |
|---|---|---|
| Comparison with Poisson distribution Blue bars denote a histogram of data divided into 1 sec bins. Red curve is a Poisson curve with rate = median count rate of data. |
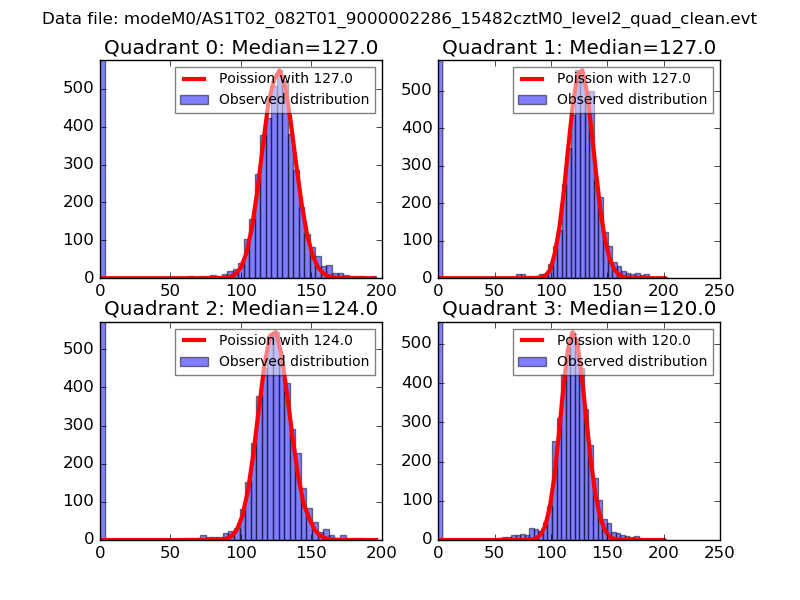 |
 |
| Quadrant-wise count rates Data is divided into 100 sec bins |
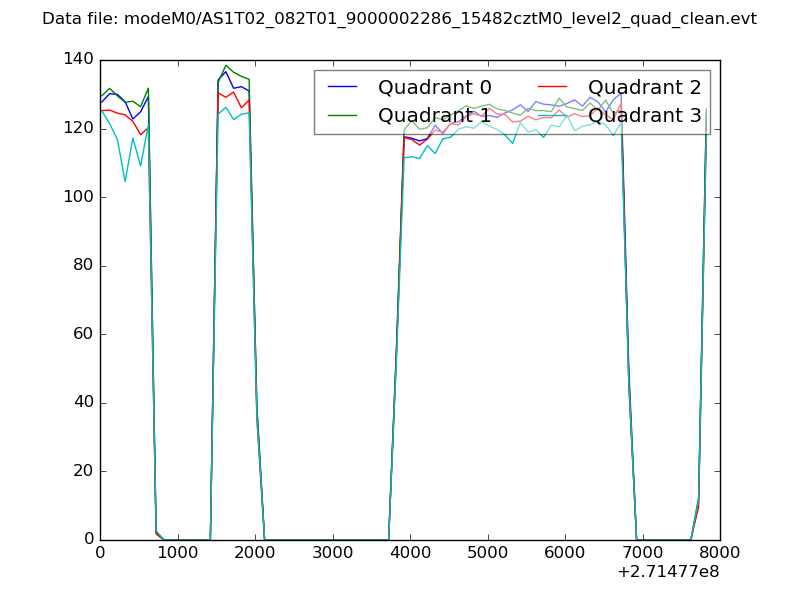 |
|
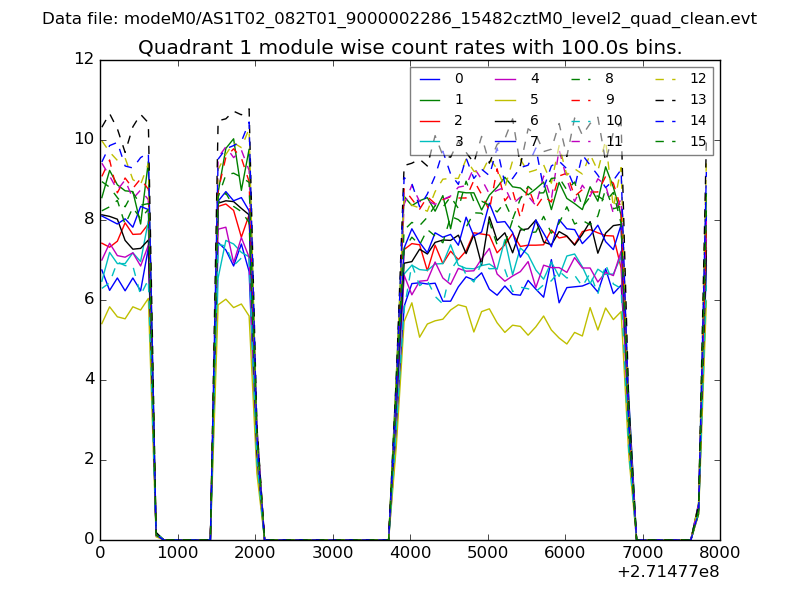
| Module-wise count rates for Quadrant A Data is divided into 100 sec bins |
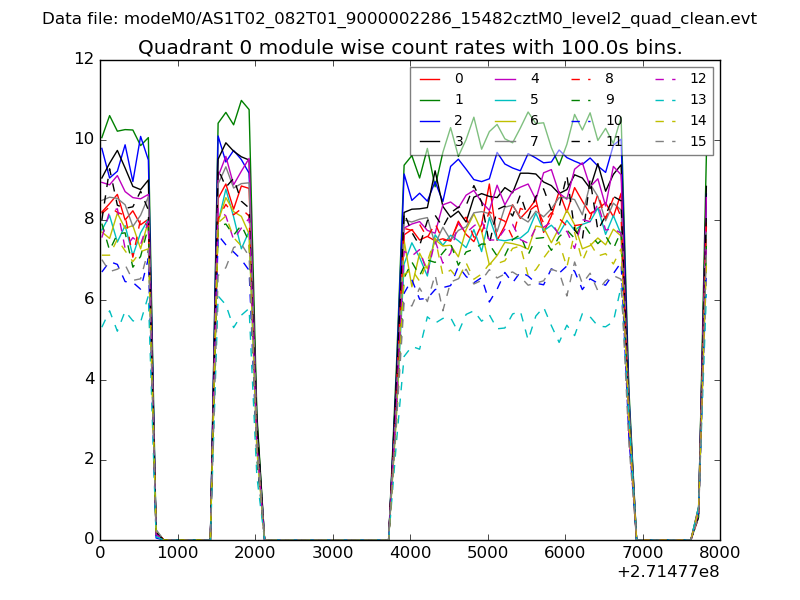 |
 |
| Module-wise count rates for Quadrant B Data is divided into 100 sec bins |
 |
 |
| Module-wise count rates for Quadrant C Data is divided into 100 sec bins |
 |
 |
| Module-wise count rates for Quadrant D Data is divided into 100 sec bins |
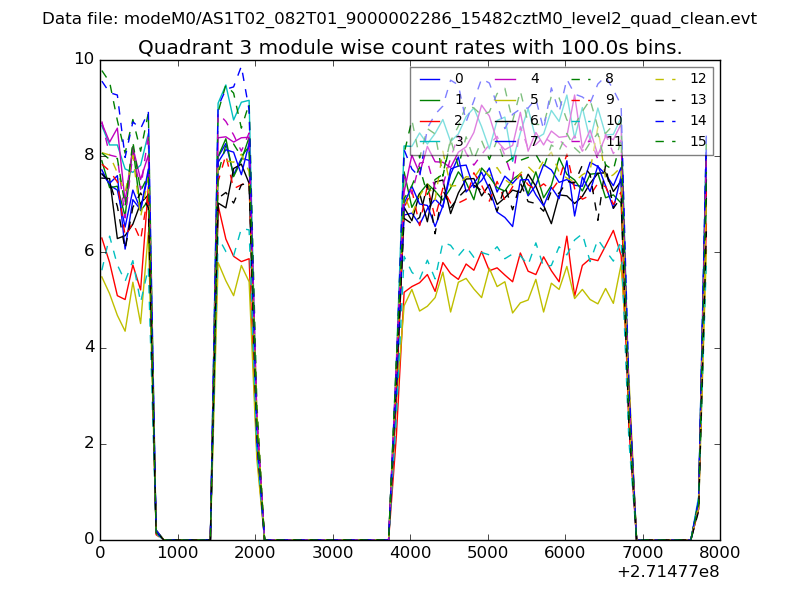 |
 |
| Parameter | Plot |
|---|---|
| CZT HV Monitor | 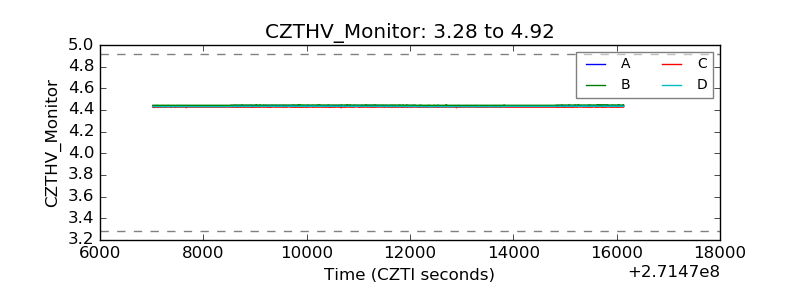 |
| D_VDD | 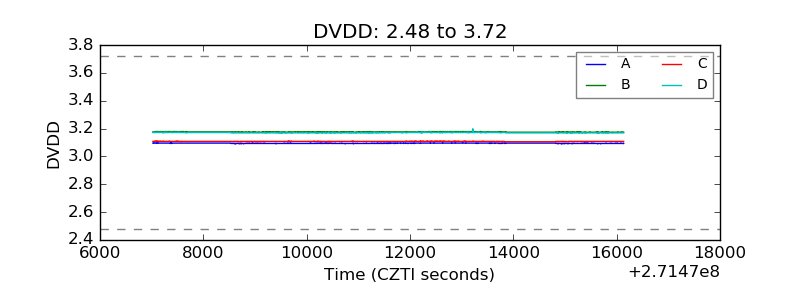 |
| Temperature 1 | 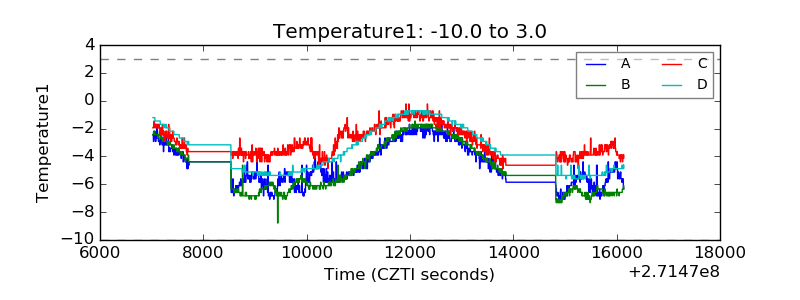 |
| Veto HV Monitor | 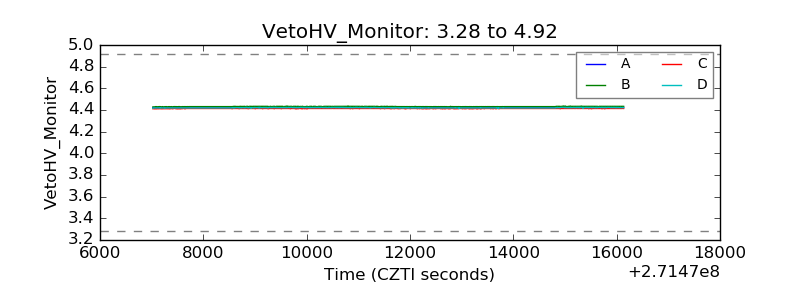 |
| Veto LLD | 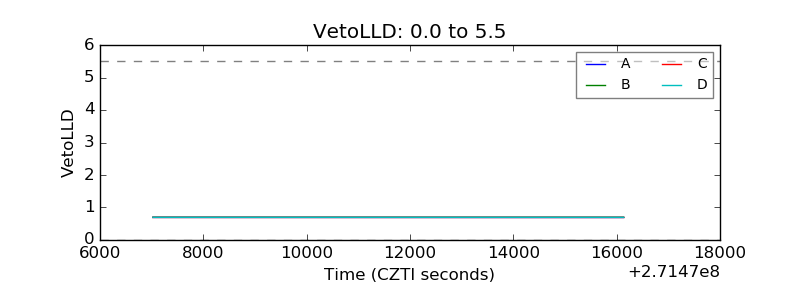 |
| Alpha Counter | 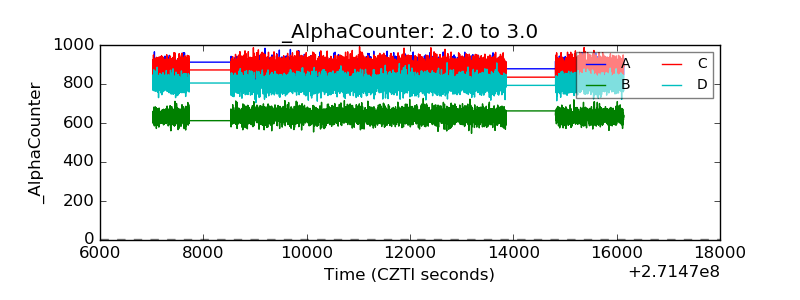 |
| _CPM_Rate | 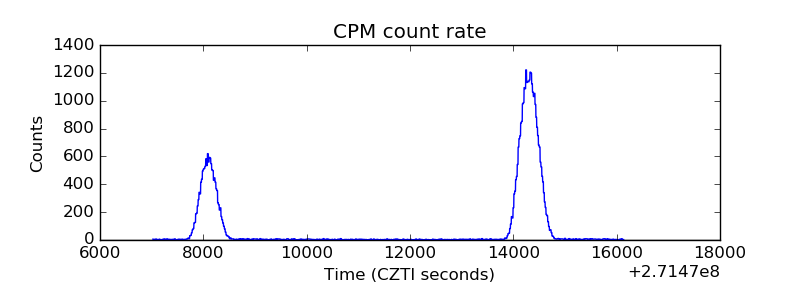 |
| CZT Counter | 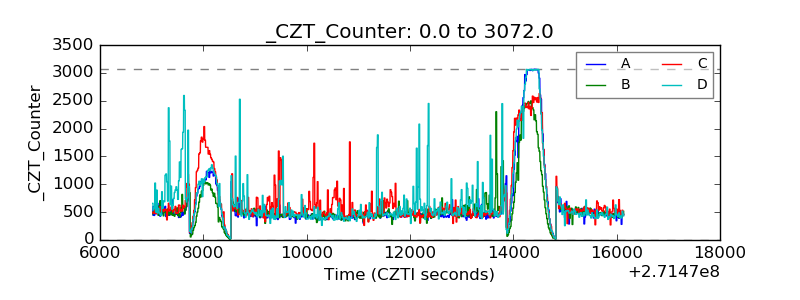 |
| +2.5 Volts monitor |  |
| +5 Volts monitor |  |
| _ROLL_ROT | 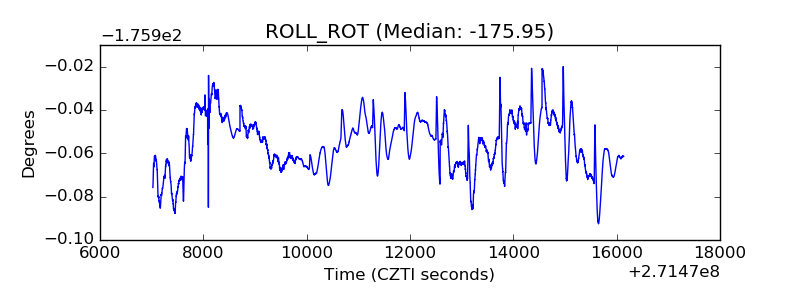 |
| _Roll_DEC | 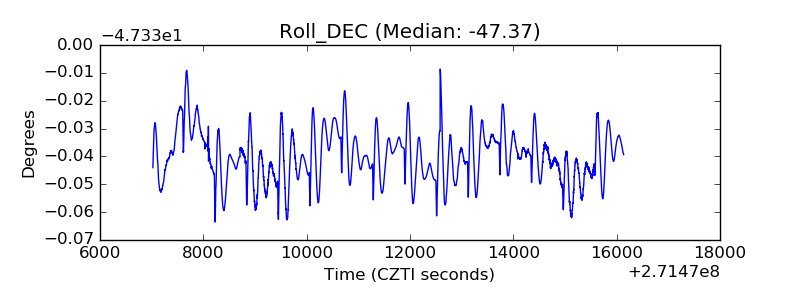 |
| _Roll_RA | 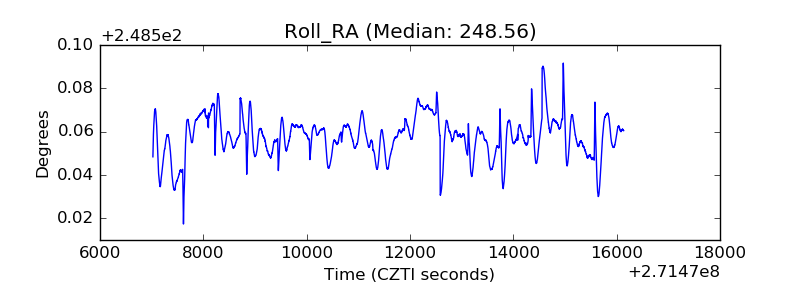 |
| Veto Counter | 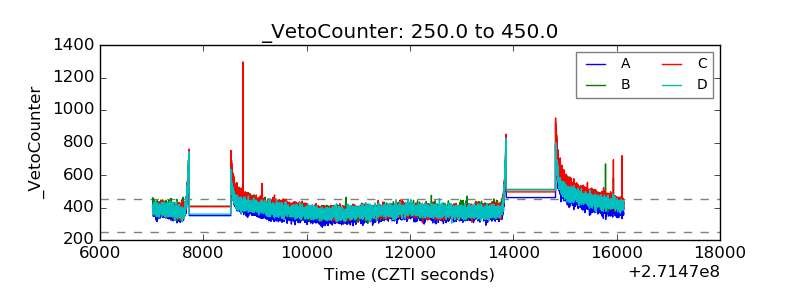 |