| Param | Original file | Final file |
|---|---|---|
| Filename | modeM0/AS1T02_082T01_9000002286_15484cztM0_level2.evt | modeM0/AS1T02_082T01_9000002286_15484cztM0_level2_quad_clean.evt |
| Size (bytes) | 174,130,560 | 19,572,480 |
| Size | 166.1 MB | 18.7 MB |
| Events in quadrant A | 1,228,242 | 101,467 |
| Events in quadrant B | 1,299,629 | 103,181 |
| Events in quadrant C | 1,328,451 | 101,020 |
| Events in quadrant D | 1,236,456 | 98,082 |
| Mode M0 | |||
|---|---|---|---|
| Quadrant | BADHDUFLAG | Total packets | Discarded packets |
| A | 0 | 5361 | 1 |
| B | 0 | 5497 | 1 |
| C | 0 | 5509 | 1 |
| D | 0 | 5422 | 1 |
| Mode SS | |||
|---|---|---|---|
| Quadrant | BADHDUFLAG | Total packets | Discarded packets |
| A | 0 | 52 | 0 |
| B | 0 | 52 | 0 |
| C | 0 | 52 | 0 |
| D | 0 | 52 | 0 |
| Mode M9 | |||
|---|---|---|---|
| Quadrant | BADHDUFLAG | Total packets | Discarded packets |
| A | 0 | 4 | 0 |
| B | 0 | 4 | 0 |
| C | 0 | 4 | 0 |
| D | 0 | 5 | 0 |
| Quadrant | Total seconds | Saturated seconds | Saturation percentage |
|---|---|---|---|
| A | 2628 | 6 | 0.228311% |
| B | 2628 | 27 | 1.027397% |
| C | 2628 | 25 | 0.951294% |
| D | 2628 | 8 | 0.304414% |
Noise dominated data is calculated using 1-second bins in cleaned event files. If a bin has >2000 counts, and if more than 50% of those come from <1% of pixels, then it is considered to be noise-dominated and hence unusable.
| Quadrant | # 1 sec bins | Bins with >0 counts | Bins with >2000 counts | High rate bins dominated by noise | Noise dominated (total time) | Noise dominated (detector-on time) | Marked lightcurve |
|---|---|---|---|---|---|---|---|
| A | 2629 | 2629 | 0 | 0 | 0.00% | 0.00% | 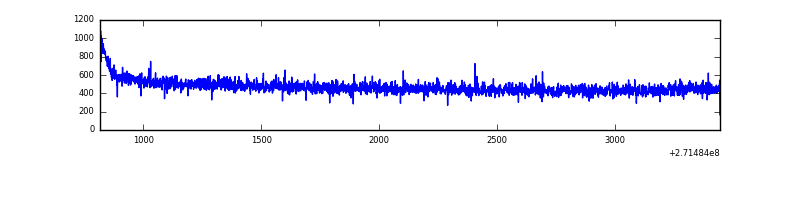 |
| B | 2629 | 2629 | 10 | 10 | 0.38% | 0.38% | 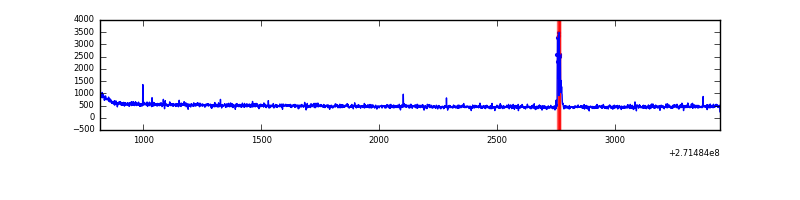 |
| C | 2629 | 2629 | 0 | 0 | 0.00% | 0.00% | 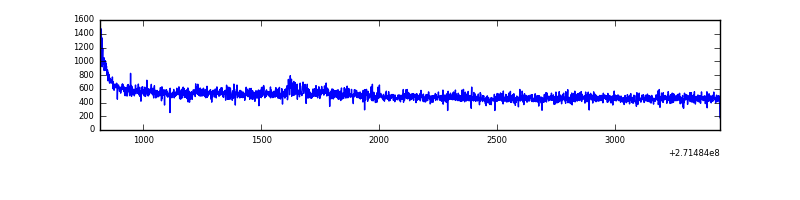 |
| D | 2629 | 2629 | 0 | 0 | 0.00% | 0.00% | 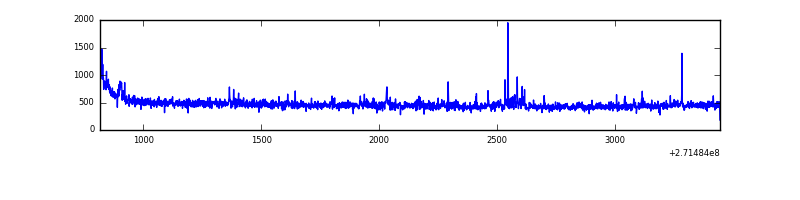 |
Top three noisy pixels from each quadrant. If the there are fewer than three noisy pixels in the level2.evt file, extra rows are filled as -1
| Pixel properties | Quadrant properties | ||||||
|---|---|---|---|---|---|---|---|
| Quadrant | DetID | PixID | Counts | Sigma | Mean | Median | Sigma |
| A | 0 | 226 | 2812 | 37.86 | 318 | 311 | 66.1 |
| A | 12 | 194 | 2352 | 30.9 | 318 | 311 | 66.1 |
| A | 3 | 137 | 1987 | 25.37 | 318 | 311 | 66.1 |
| B | 15 | 222 | 36759 | 578.41 | 321 | 313 | 63.0 |
| B | 12 | 111 | 7184 | 109.04 | 321 | 313 | 63.0 |
| B | 11 | 111 | 6046 | 90.98 | 321 | 313 | 63.0 |
| C | 14 | 238 | 47976 | 642.45 | 314 | 316 | 74.2 |
| C | 3 | 233 | 46024 | 616.14 | 314 | 316 | 74.2 |
| C | 9 | 54 | 6879 | 88.47 | 314 | 316 | 74.2 |
| D | 1 | 52 | 30719 | 388.85 | 313 | 303 | 78.2 |
| D | 2 | 234 | 8387 | 103.35 | 313 | 303 | 78.2 |
| D | 12 | 221 | 7414 | 90.91 | 313 | 303 | 78.2 |
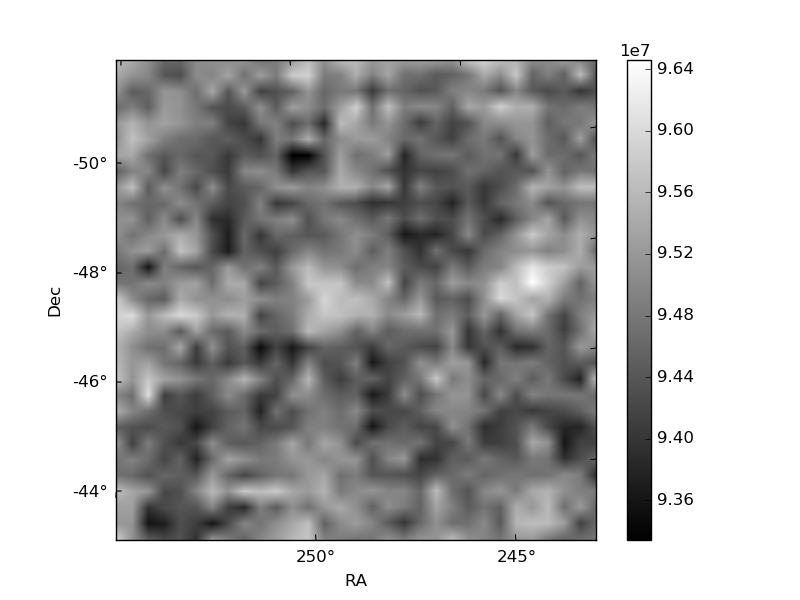
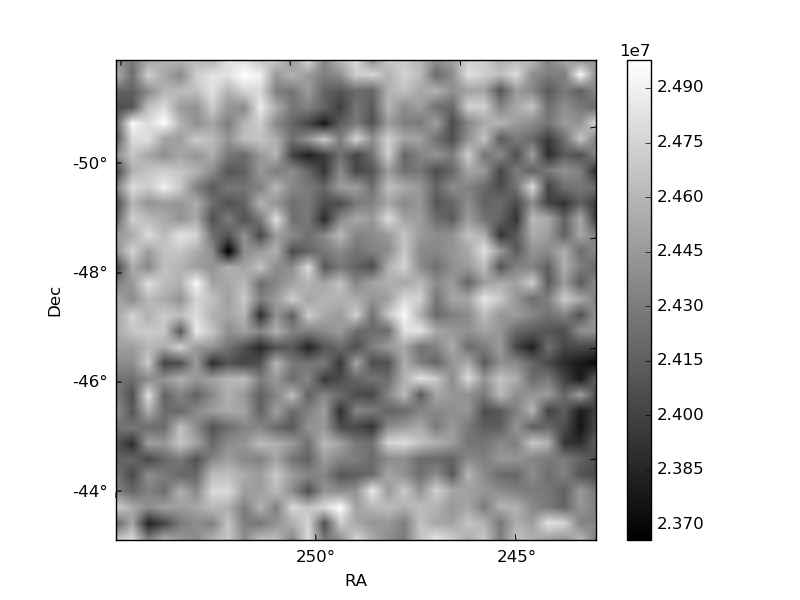
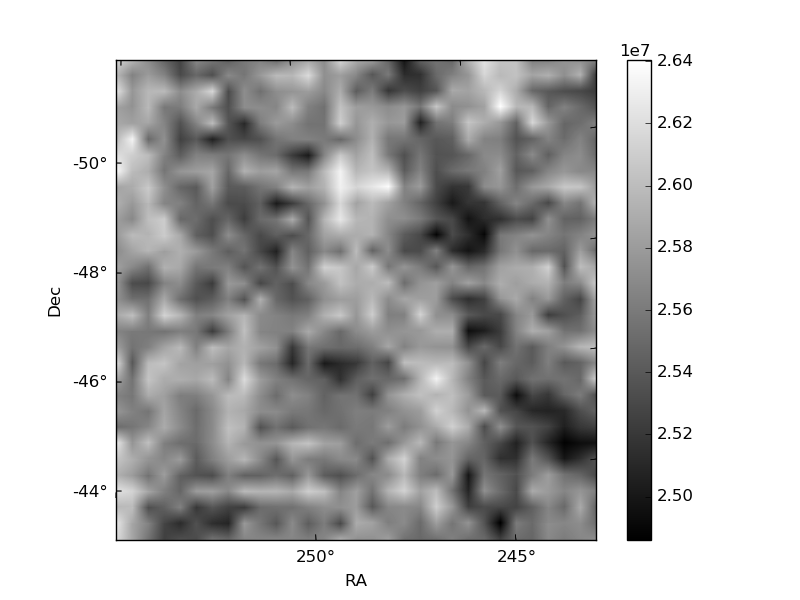
Histogram calculated using DETX and DETY for each event in the final _common_clean file
| Quadrant A | 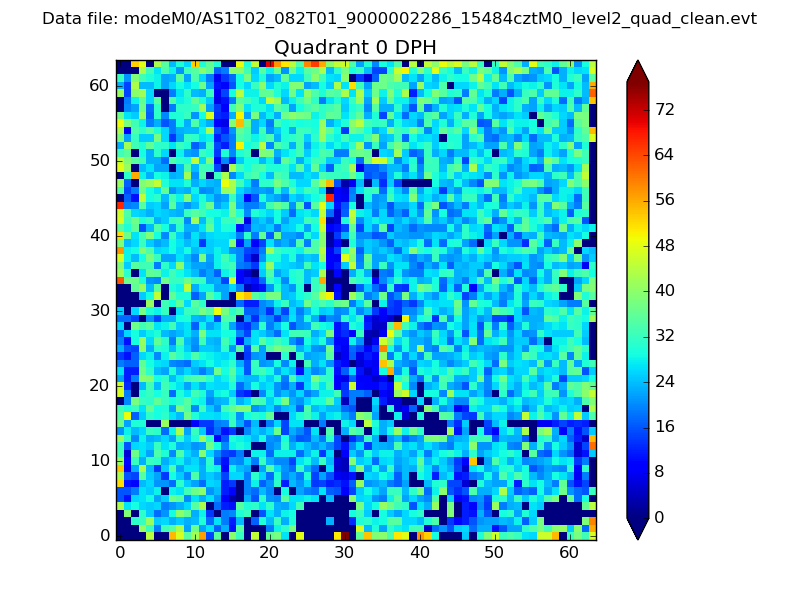 |
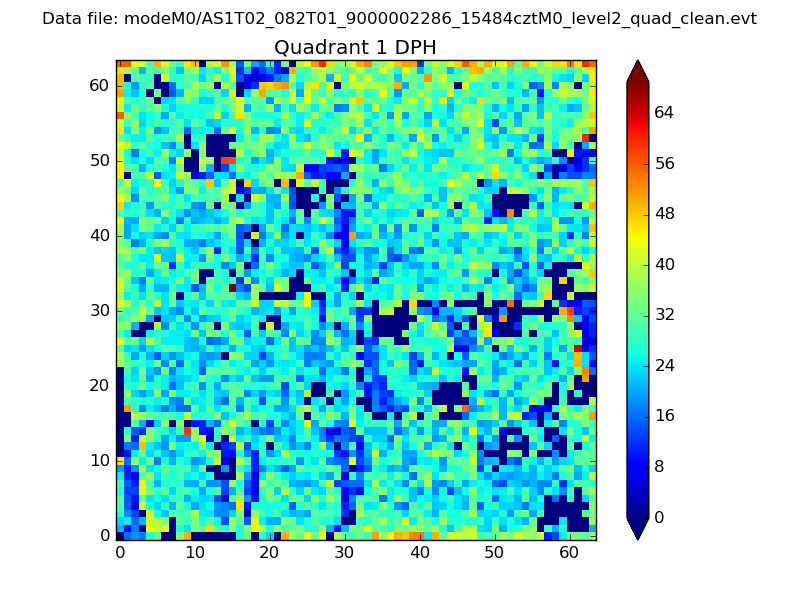 |
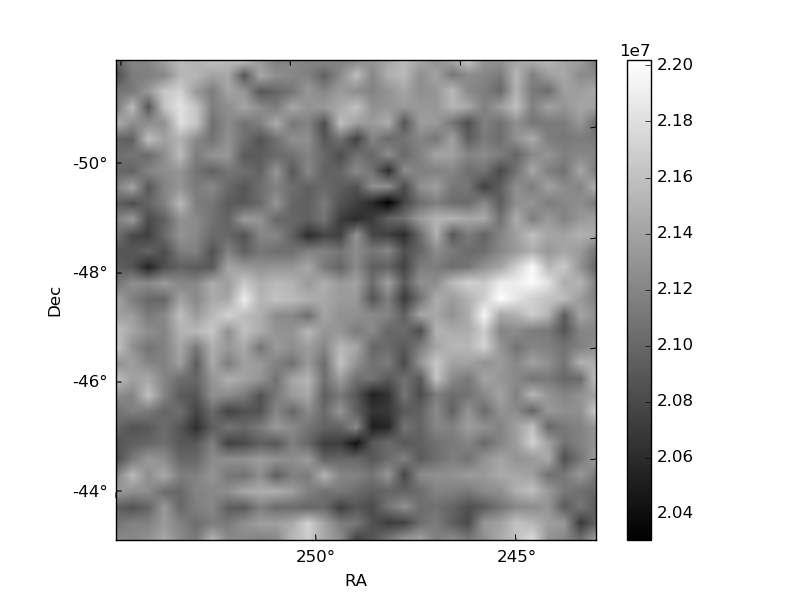
Quadrant B |
|---|---|---|---|
| Quadrant D | 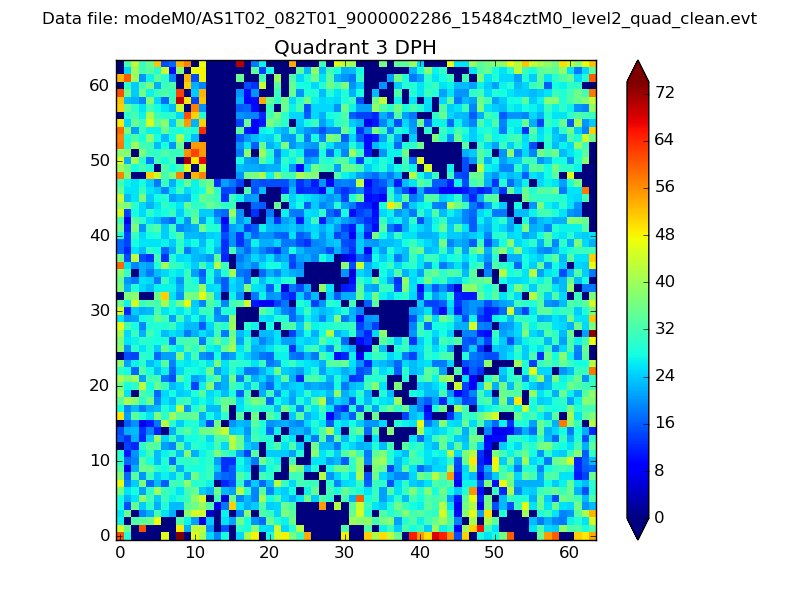 |
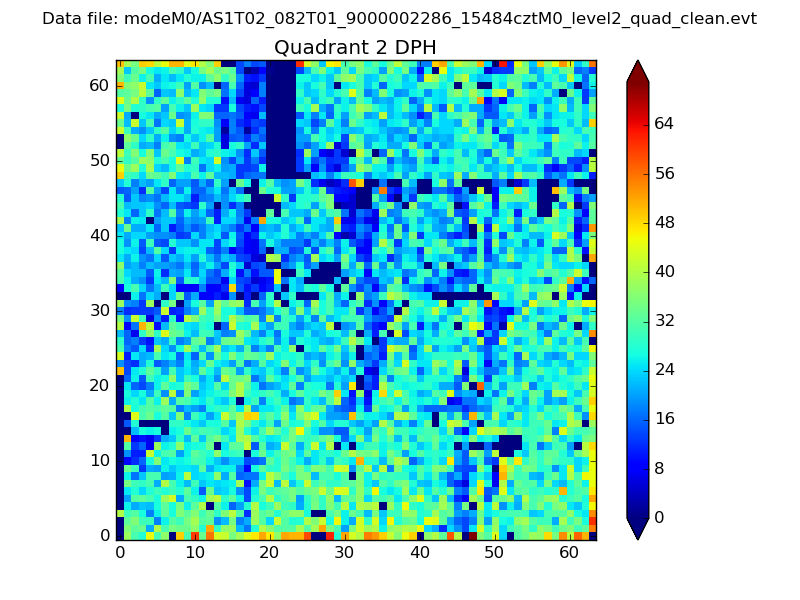 |
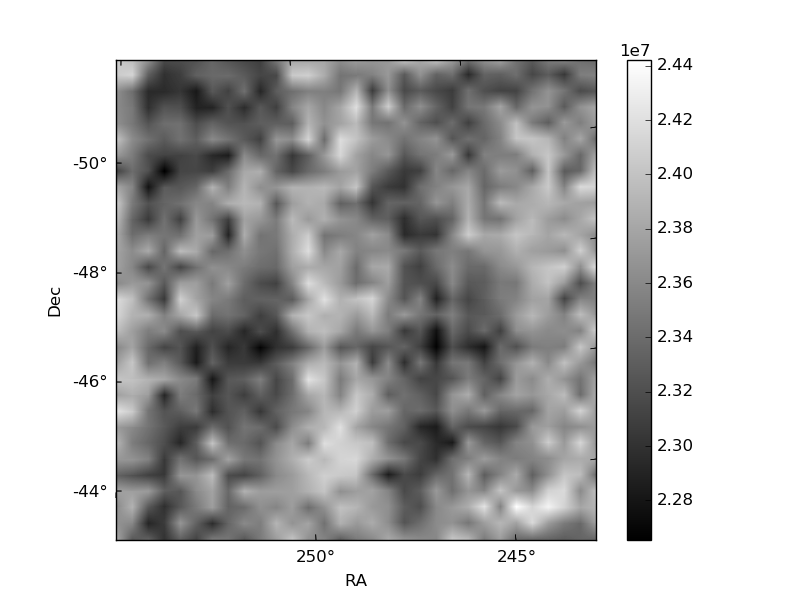
Quadrant C |
| Plot type | Count rate plots | Images |
|---|---|---|
| Comparison with Poisson distribution Blue bars denote a histogram of data divided into 1 sec bins. Red curve is a Poisson curve with rate = median count rate of data. |
 |
 |
| Quadrant-wise count rates Data is divided into 100 sec bins |
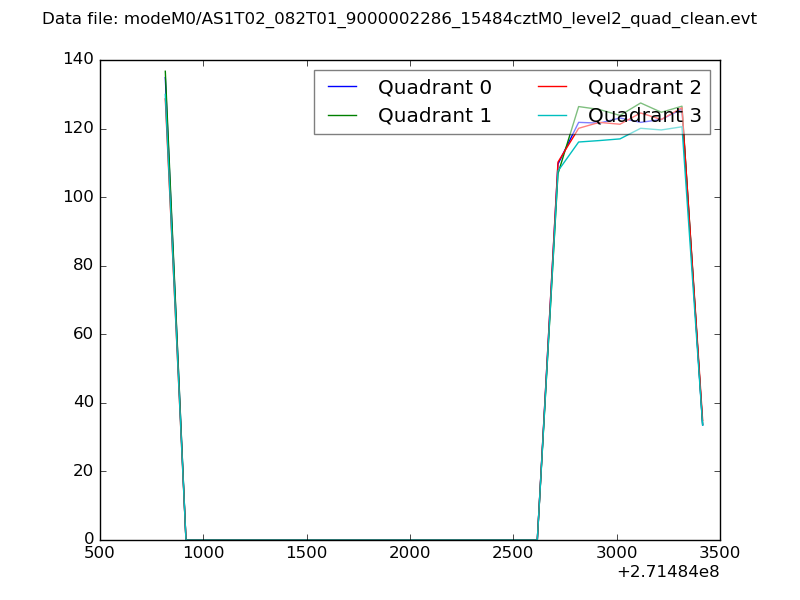 |
|
| Module-wise count rates for Quadrant A Data is divided into 100 sec bins |
 |
 |
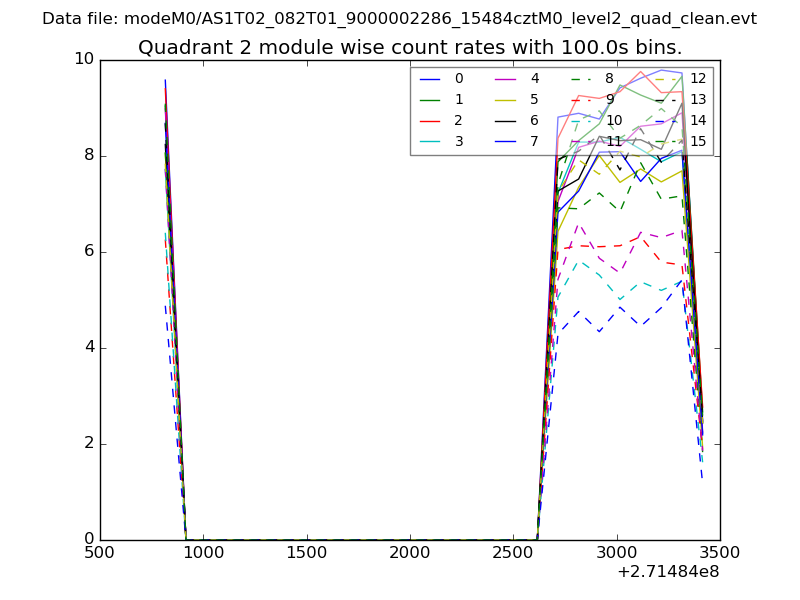
| Module-wise count rates for Quadrant B Data is divided into 100 sec bins |
 |
 |
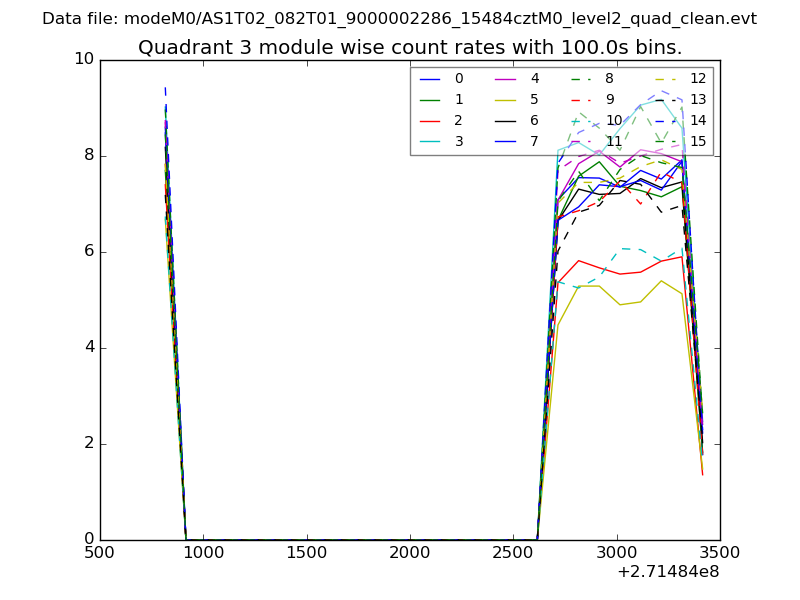
| Module-wise count rates for Quadrant C Data is divided into 100 sec bins |
 |
 |
| Module-wise count rates for Quadrant D Data is divided into 100 sec bins |
 |
 |
| Parameter | Plot |
|---|---|
| CZT HV Monitor | 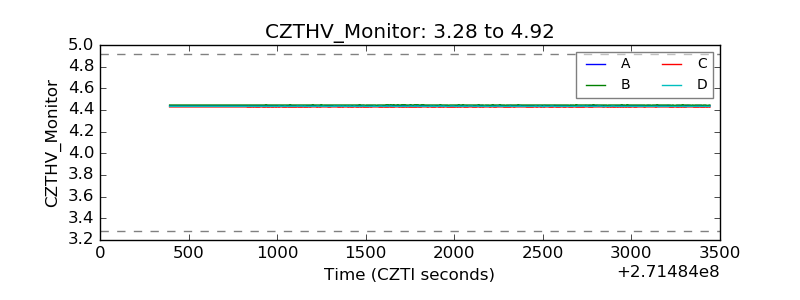 |
| D_VDD | 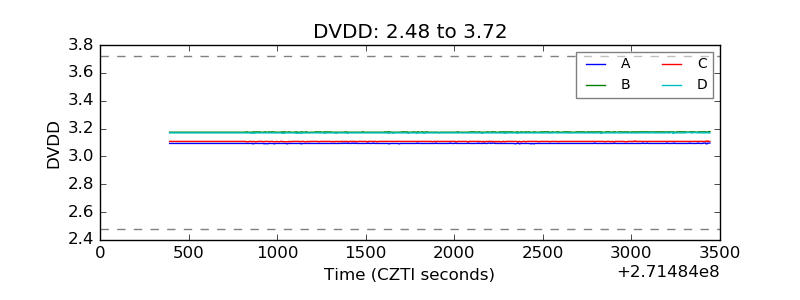 |
| Temperature 1 | 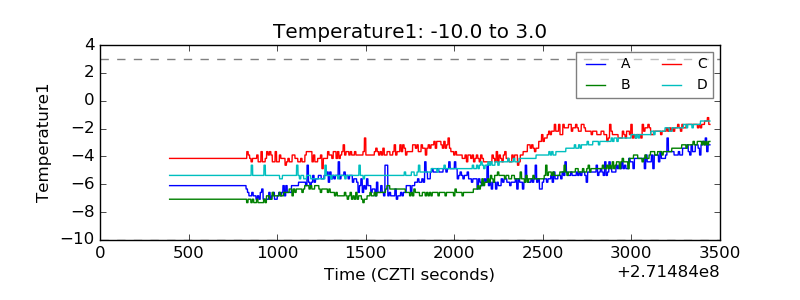 |
| Veto HV Monitor |  |
| Veto LLD | 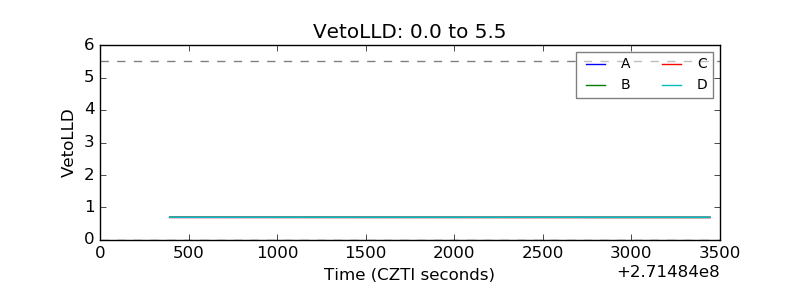 |
| Alpha Counter | 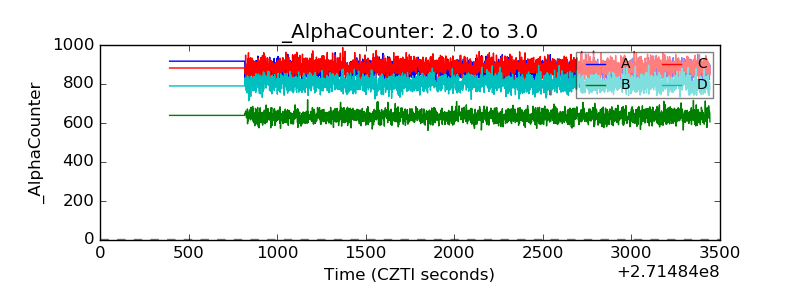 |
| _CPM_Rate |  |
| CZT Counter | 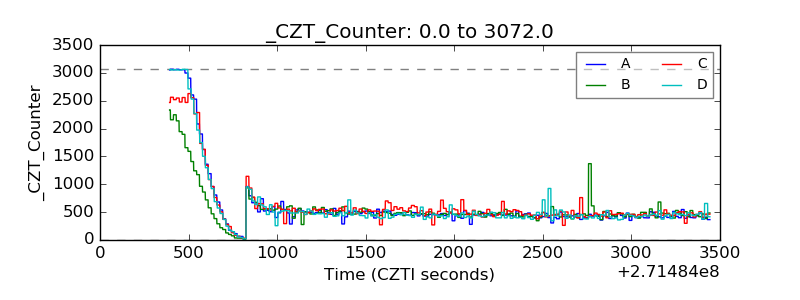 |
| +2.5 Volts monitor |  |
| +5 Volts monitor |  |
| _ROLL_ROT | 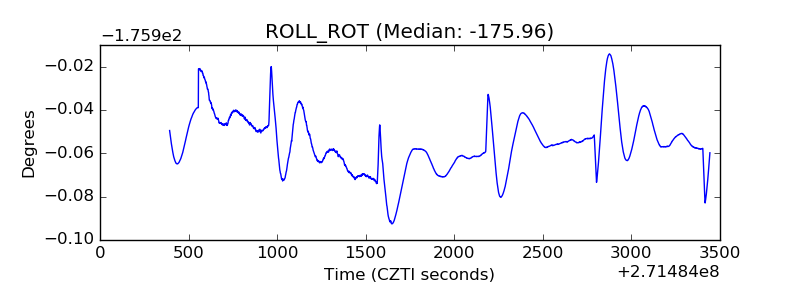 |
| _Roll_DEC | 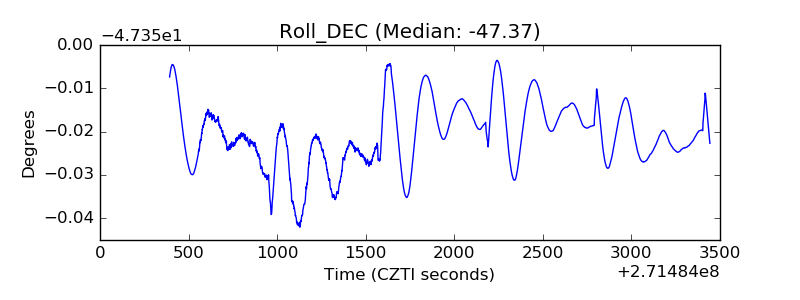 |
| _Roll_RA | 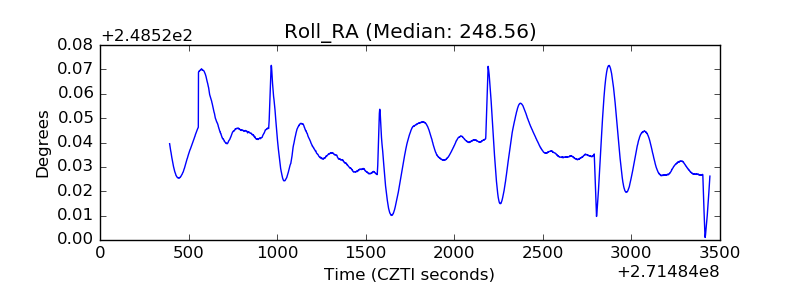 |
| Veto Counter | 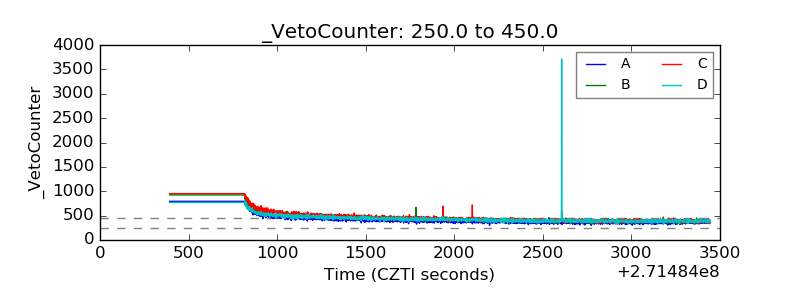 |