| Param | Original file | Final file |
|---|---|---|
| Filename | modeM0/AS1G08_036T01_9000002290cztM0_level2.fits | modeM0/AS1G08_036T01_9000002290cztM0_level2_quad_clean.evt |
| Size (bytes) | 190,848,960 | 189,993,600 |
| Size | 182.0 MB | 181.2 MB |
| Events in quadrant A | 1,171,716 | 1,149,843 |
| Events in quadrant B | 1,121,738 | 1,142,461 |
| Events in quadrant C | 1,137,312 | 1,096,370 |
| Events in quadrant D | 977,866 | 993,567 |
| Mode M0 | |||
|---|---|---|---|
| Quadrant | BADHDUFLAG | Total packets | Discarded packets |
| A | 0 | 42247 | 0 |
| B | 0 | 44175 | 0 |
| C | 0 | 42265 | 0 |
| D | 0 | 51516 | 0 |
| Mode SS | |||
|---|---|---|---|
| Quadrant | BADHDUFLAG | Total packets | Discarded packets |
| A | 0 | 404 | 0 |
| B | 0 | 404 | 0 |
| C | 0 | 404 | 0 |
| D | 0 | 404 | 0 |
| Mode M9 | |||
|---|---|---|---|
| Quadrant | BADHDUFLAG | Total packets | Discarded packets |
| A | 0 | 26 | 0 |
| B | 0 | 26 | 0 |
| C | 0 | 26 | 0 |
| D | 0 | 26 | 0 |
| Quadrant | Total seconds | Saturated seconds | Saturation percentage |
|---|---|---|---|
| A | 19907 | 320 | 1.607475% |
| B | 19907 | 374 | 1.878736% |
| C | 19907 | 324 | 1.627568% |
| D | 19907 | 772 | 3.878033% |
Noise dominated data is calculated using 1-second bins in cleaned event files. If a bin has >2000 counts, and if more than 50% of those come from <1% of pixels, then it is considered to be noise-dominated and hence unusable.
| Quadrant | # 1 sec bins | Bins with >0 counts | Bins with >2000 counts | High rate bins dominated by noise | Noise dominated (total time) | Noise dominated (detector-on time) | Marked lightcurve |
|---|---|---|---|---|---|---|---|
| A | 22492 | 19904 | 0 | 0 | 0.00% | 0.00% |  |
| B | 22492 | 19908 | 0 | 0 | 0.00% | 0.00% |  |
| C | 22492 | 19906 | 0 | 0 | 0.00% | 0.00% |  |
| D | 22492 | 19869 | 0 | 0 | 0.00% | 0.00% |  |
Top three noisy pixels from each quadrant. If the there are fewer than three noisy pixels in the level2.evt file, extra rows are filled as -1
| Pixel properties | Quadrant properties | ||||||
|---|---|---|---|---|---|---|---|
| Quadrant | DetID | PixID | Counts | Sigma | Mean | Median | Sigma |
| A | 0 | 29 | 1103 | 10.6 | 304 | 285 | 77.2 |
| A | 7 | 110 | 953 | 8.65 | 304 | 285 | 77.2 |
| A | 9 | 19 | 909 | 8.08 | 304 | 285 | 77.2 |
| B | 2 | 9 | 847 | 9.27 | 296 | 281 | 61.0 |
| B | 14 | 254 | 789 | 8.32 | 296 | 281 | 61.0 |
| B | 3 | 80 | 753 | 7.73 | 296 | 281 | 61.0 |
| C | 12 | 241 | 800 | 6.62 | 300 | 280 | 78.6 |
| C | 3 | 126 | 787 | 6.45 | 300 | 280 | 78.6 |
| C | 7 | 111 | 776 | 6.31 | 300 | 280 | 78.6 |
| D | 6 | 231 | 741 | 6.36 | 279 | 252 | 76.9 |
| D | 7 | 3 | 712 | 5.98 | 279 | 252 | 76.9 |
| D | 3 | 14 | 710 | 5.95 | 279 | 252 | 76.9 |
Histogram calculated using DETX and DETY for each event in the final _common_clean file
| Quadrant A | 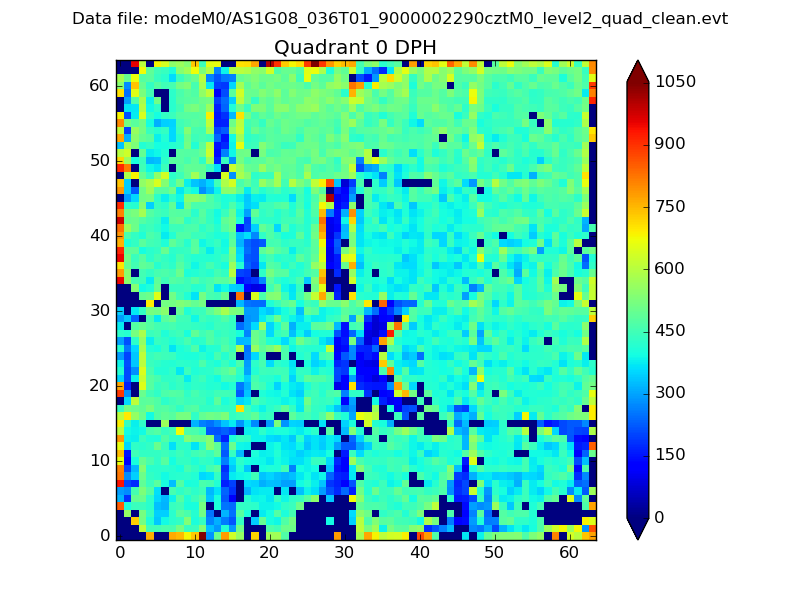 |
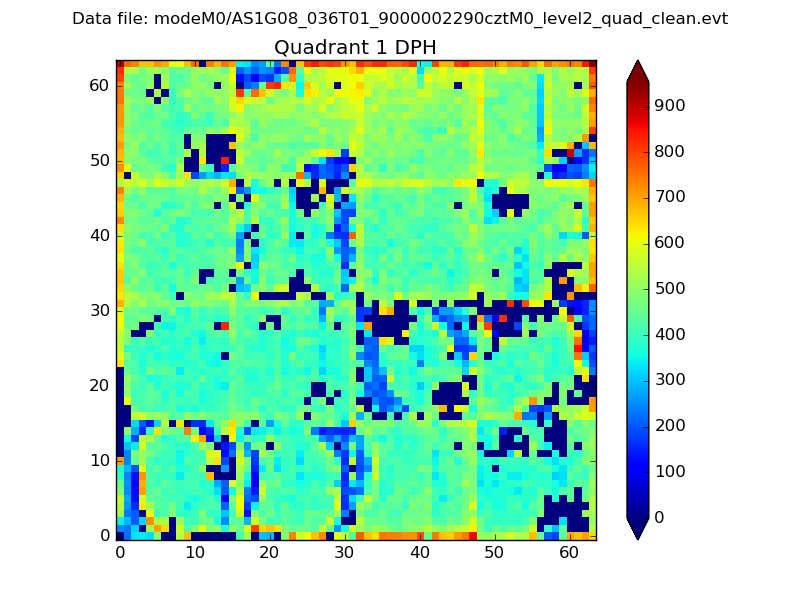 |
Quadrant B |
|---|---|---|---|
| Quadrant D | 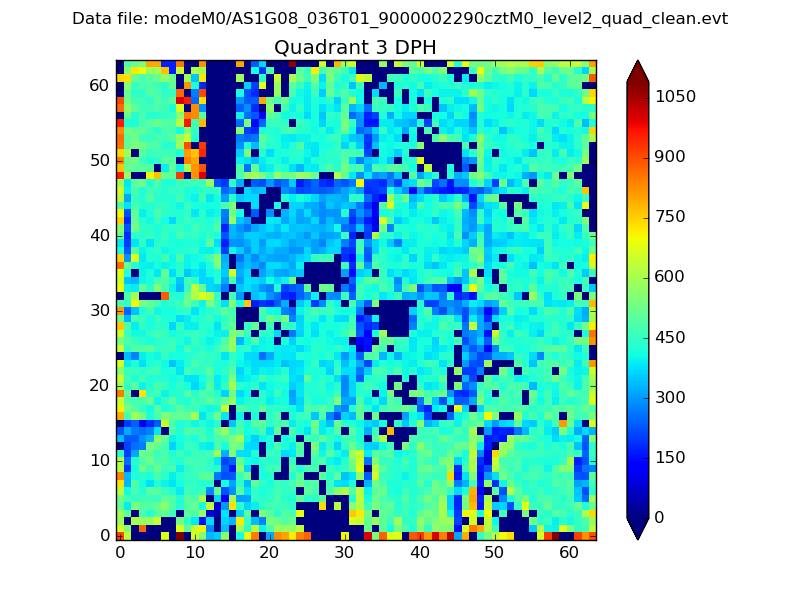 |
 |
Quadrant C |
| Plot type | Count rate plots | Images |
|---|---|---|
| Comparison with Poisson distribution Blue bars denote a histogram of data divided into 1 sec bins. Red curve is a Poisson curve with rate = median count rate of data. |
 |
 |
| Quadrant-wise count rates Data is divided into 100 sec bins |
 |
|
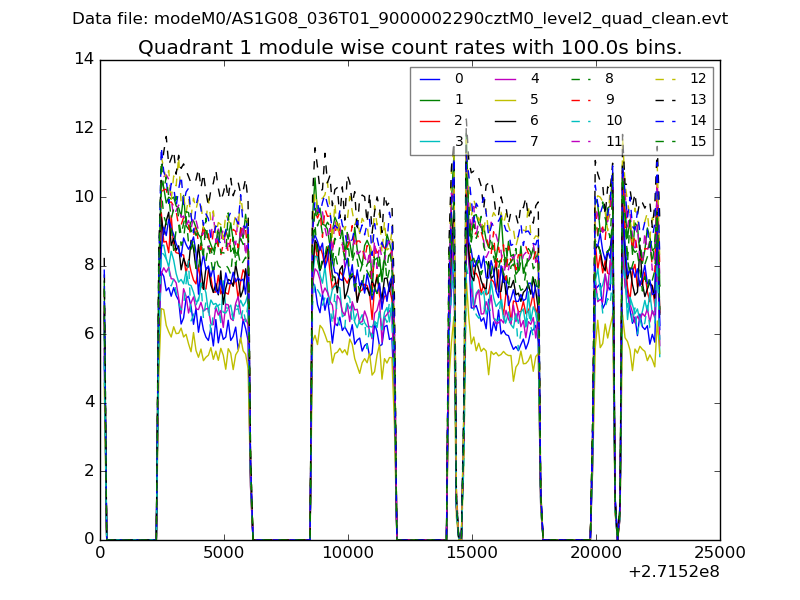
| Module-wise count rates for Quadrant A Data is divided into 100 sec bins |
 |
 |
| Module-wise count rates for Quadrant B Data is divided into 100 sec bins |
 |
 |
| Module-wise count rates for Quadrant C Data is divided into 100 sec bins |
 |
 |
| Module-wise count rates for Quadrant D Data is divided into 100 sec bins |
 |
 |
| Parameter | Plot |
|---|---|
| CZT HV Monitor |  |
| D_VDD |  |
| Temperature 1 | 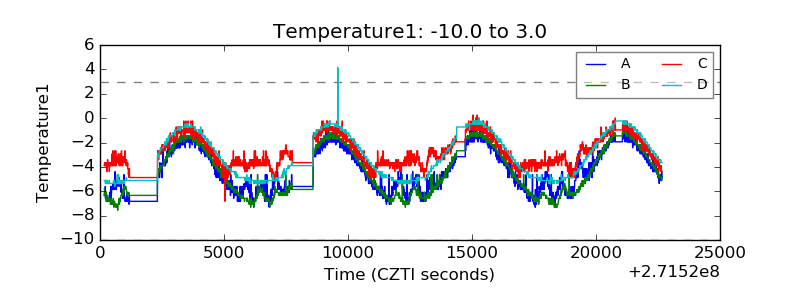 |
| Veto HV Monitor |  |
| Veto LLD |  |
| Alpha Counter |  |
| _CPM_Rate |  |
| CZT Counter | 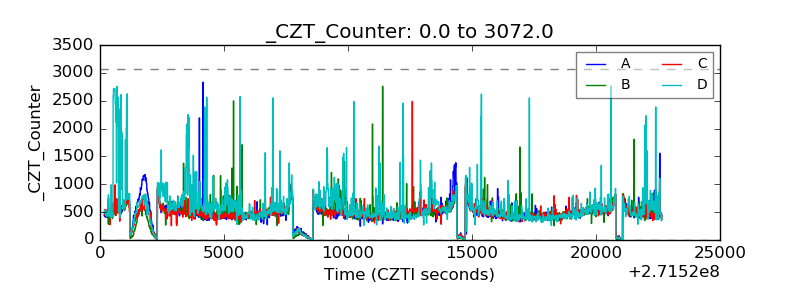 |
| +2.5 Volts monitor |  |
| +5 Volts monitor |  |
| _ROLL_ROT |  |
| _Roll_DEC |  |
| _Roll_RA | 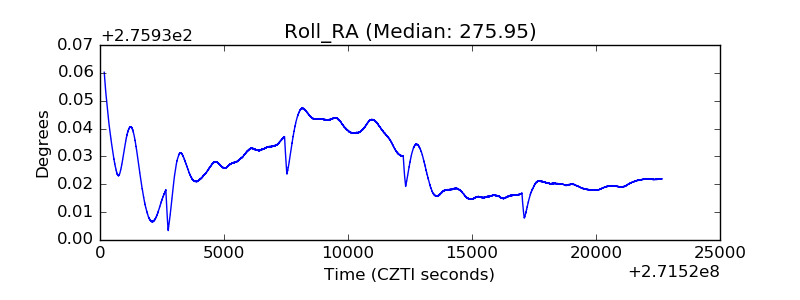 |
| Veto Counter | 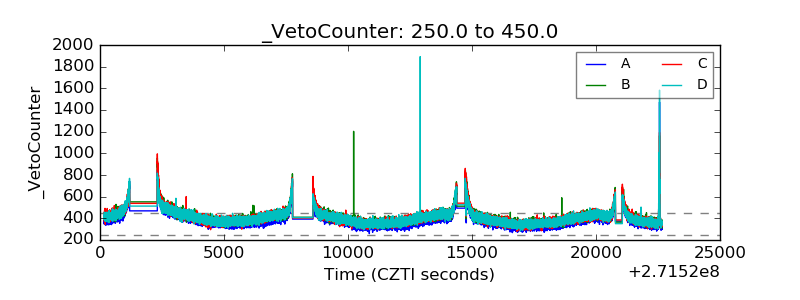 |