| Param | Original file | Final file |
|---|---|---|
| Filename | modeM0/AS1G08_036T01_9000002290_15490cztM0_level2.evt | modeM0/AS1G08_036T01_9000002290_15490cztM0_level2_quad_clean.evt |
| Size (bytes) | 508,345,920 | 100,716,480 |
| Size | 484.8 MB | 96.1 MB |
| Events in quadrant A | 3,275,324 | 660,215 |
| Events in quadrant B | 3,730,903 | 664,812 |
| Events in quadrant C | 3,297,831 | 640,994 |
| Events in quadrant D | 4,638,108 | 618,424 |
| Mode M0 | |||
|---|---|---|---|
| Quadrant | BADHDUFLAG | Total packets | Discarded packets |
| A | 0 | 13985 | 2 |
| B | 0 | 15226 | 1 |
| C | 0 | 13879 | 1 |
| D | 0 | 18386 | 1 |
| Mode SS | |||
|---|---|---|---|
| Quadrant | BADHDUFLAG | Total packets | Discarded packets |
| A | 0 | 136 | 0 |
| B | 0 | 136 | 0 |
| C | 0 | 136 | 0 |
| D | 0 | 136 | 0 |
| Mode M9 | |||
|---|---|---|---|
| Quadrant | BADHDUFLAG | Total packets | Discarded packets |
| A | 0 | 8 | 0 |
| B | 0 | 8 | 0 |
| C | 0 | 8 | 0 |
| D | 0 | 8 | 0 |
| Quadrant | Total seconds | Saturated seconds | Saturation percentage |
|---|---|---|---|
| A | 6680 | 83 | 1.242515% |
| B | 6680 | 108 | 1.616766% |
| C | 6680 | 73 | 1.092814% |
| D | 6680 | 198 | 2.964072% |
Noise dominated data is calculated using 1-second bins in cleaned event files. If a bin has >2000 counts, and if more than 50% of those come from <1% of pixels, then it is considered to be noise-dominated and hence unusable.
| Quadrant | # 1 sec bins | Bins with >0 counts | Bins with >2000 counts | High rate bins dominated by noise | Noise dominated (total time) | Noise dominated (detector-on time) | Marked lightcurve |
|---|---|---|---|---|---|---|---|
| A | 7506 | 6682 | 9 | 9 | 0.12% | 0.13% | 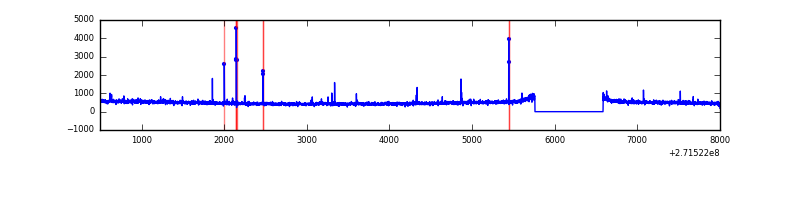 |
| B | 7506 | 6682 | 24 | 24 | 0.32% | 0.36% | 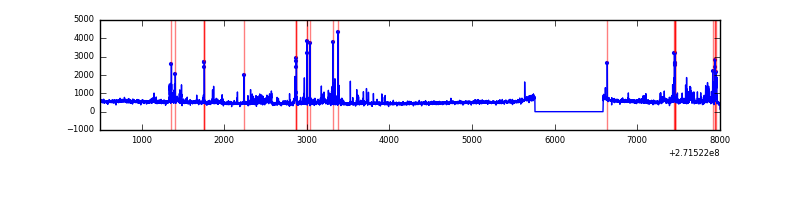 |
| C | 7506 | 6682 | 0 | 0 | 0.00% | 0.00% | 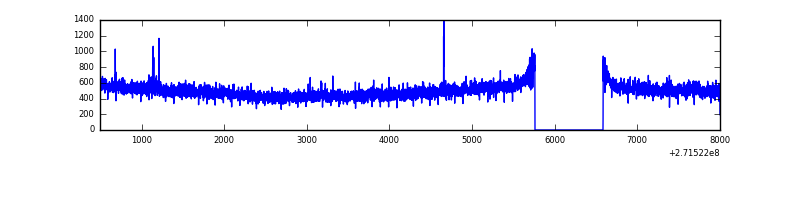 |
| D | 7506 | 6682 | 138 | 138 | 1.84% | 2.07% | 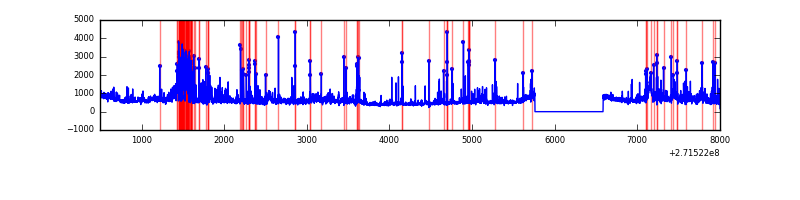 |
Top three noisy pixels from each quadrant. If the there are fewer than three noisy pixels in the level2.evt file, extra rows are filled as -1
| Pixel properties | Quadrant properties | ||||||
|---|---|---|---|---|---|---|---|
| Quadrant | DetID | PixID | Counts | Sigma | Mean | Median | Sigma |
| A | 0 | 253 | 50743 | 298.07 | 827 | 811 | 167.5 |
| A | 9 | 143 | 31004 | 180.24 | 827 | 811 | 167.5 |
| A | 0 | 226 | 7544 | 40.19 | 827 | 811 | 167.5 |
| B | 10 | 245 | 179043 | 1138.41 | 821 | 802 | 156.6 |
| B | 4 | 142 | 160917 | 1022.64 | 821 | 802 | 156.6 |
| B | 0 | 230 | 33144 | 206.56 | 821 | 802 | 156.6 |
| C | 14 | 238 | 120216 | 651.07 | 782 | 785 | 183.4 |
| C | 3 | 233 | 110871 | 600.13 | 782 | 785 | 183.4 |
| C | 9 | 54 | 9584 | 47.97 | 782 | 785 | 183.4 |
| D | 1 | 52 | 715556 | 3672.27 | 793 | 769 | 194.6 |
| D | 5 | 222 | 668969 | 3432.92 | 793 | 769 | 194.6 |
| D | 10 | 70 | 58639 | 297.31 | 793 | 769 | 194.6 |
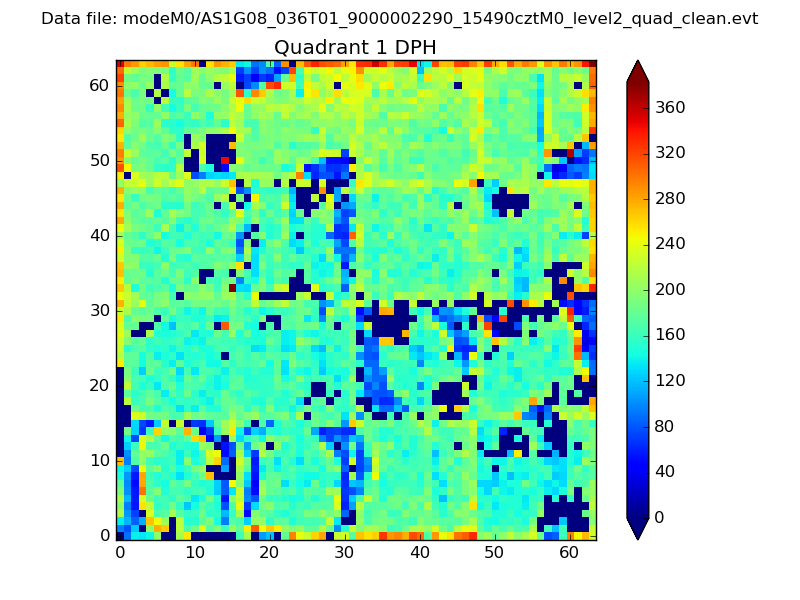
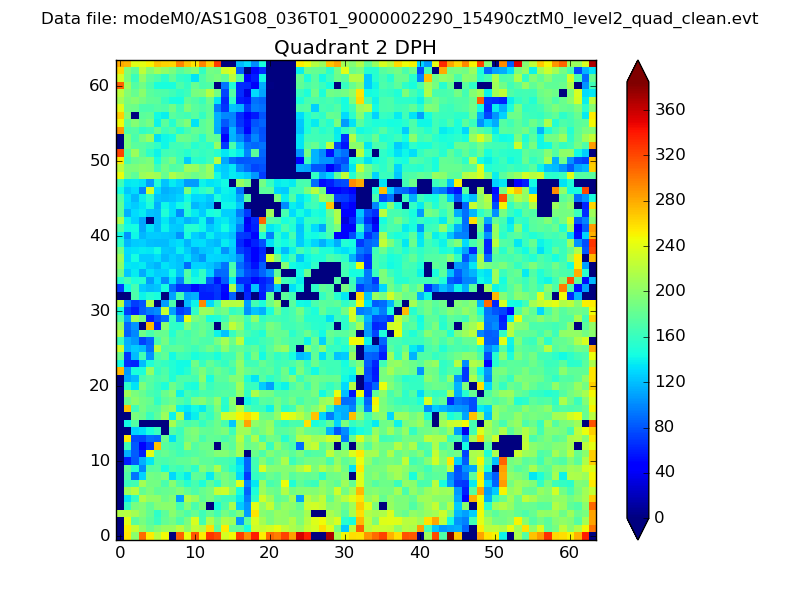
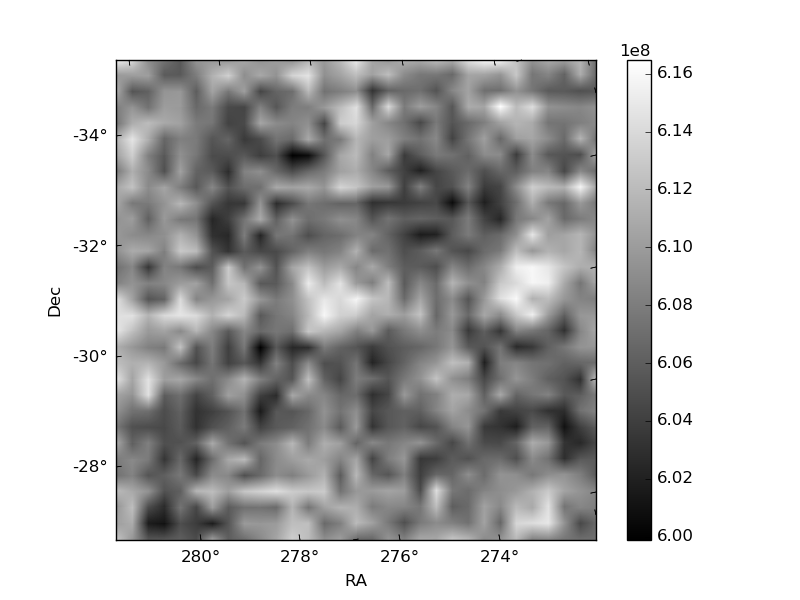
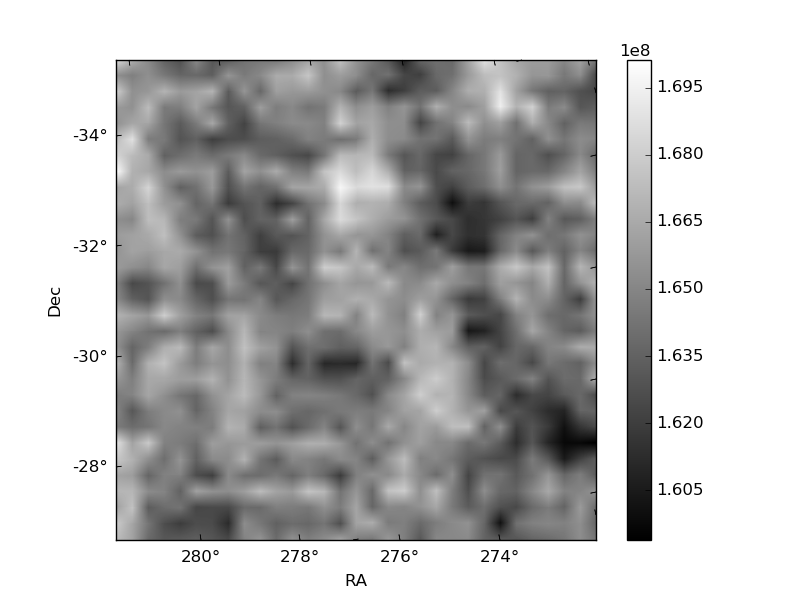
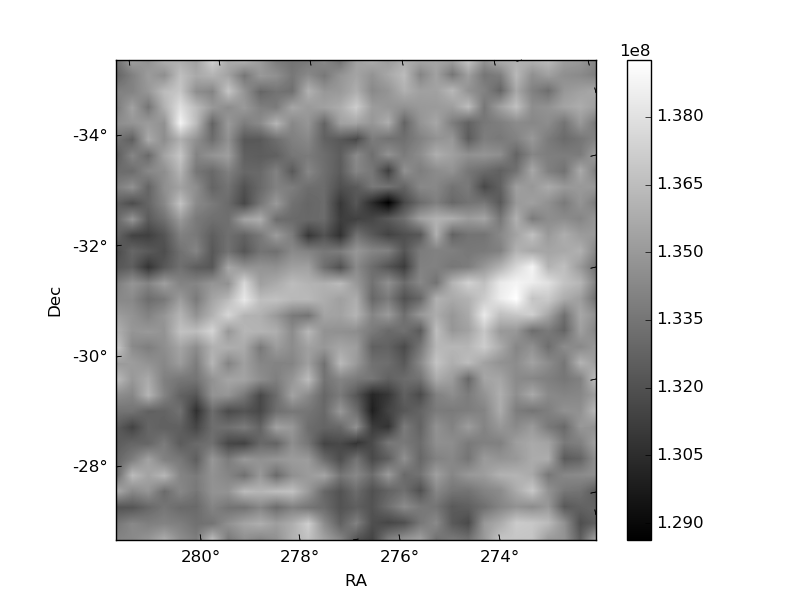
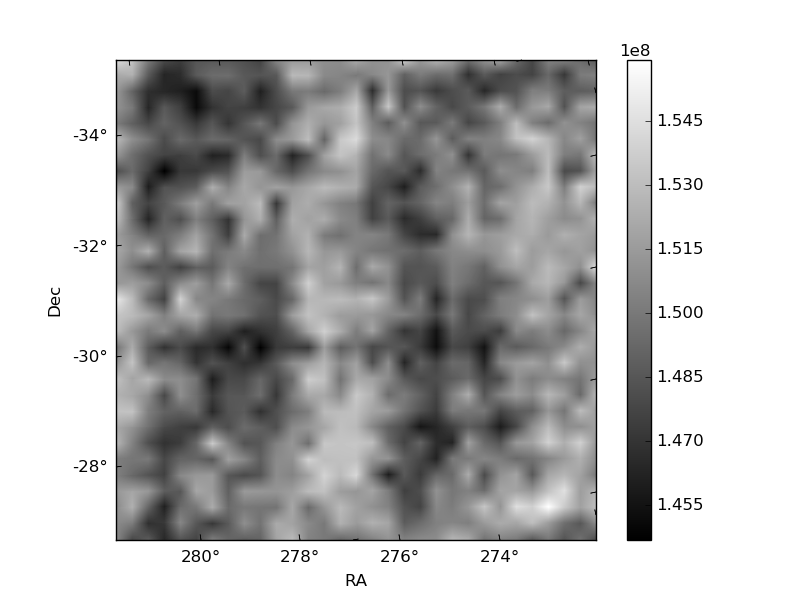
Histogram calculated using DETX and DETY for each event in the final _common_clean file
| Quadrant A |  |
 |
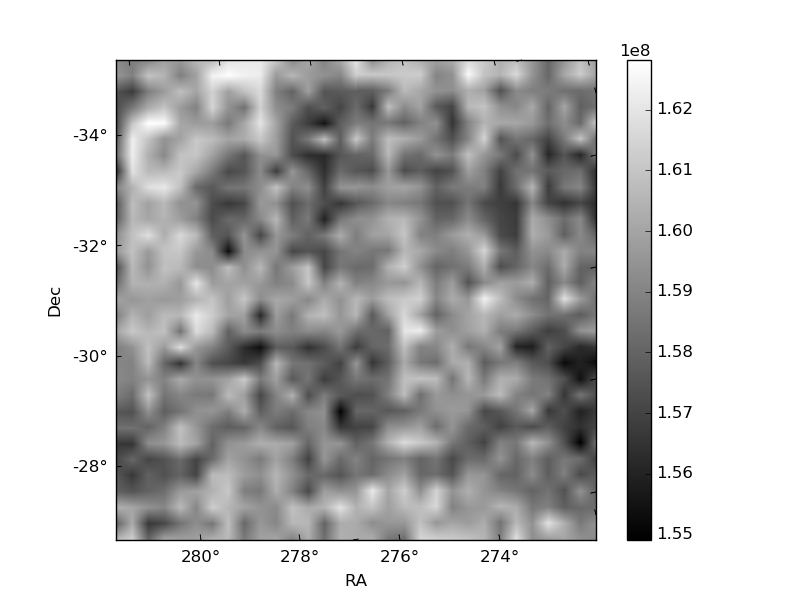
Quadrant B |
|---|---|---|---|
| Quadrant D | 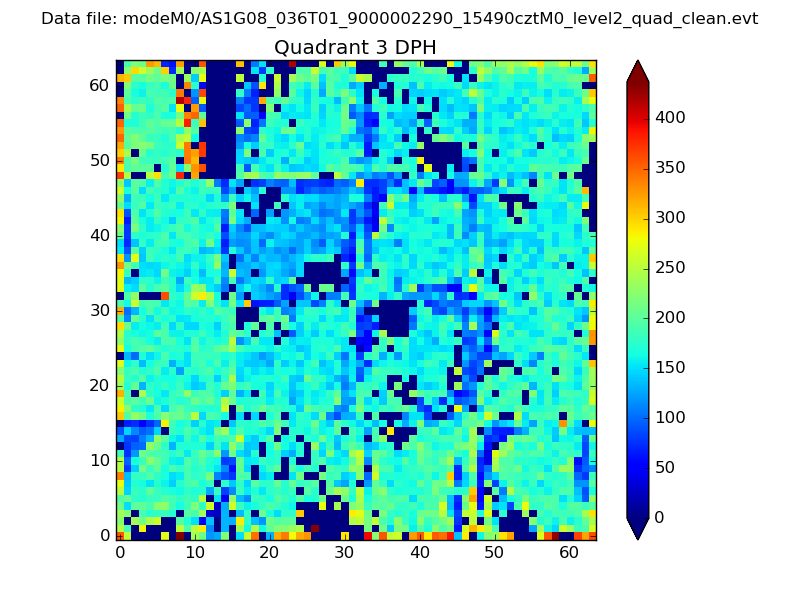 |
 |
Quadrant C |
| Plot type | Count rate plots | Images |
|---|---|---|
| Comparison with Poisson distribution Blue bars denote a histogram of data divided into 1 sec bins. Red curve is a Poisson curve with rate = median count rate of data. |
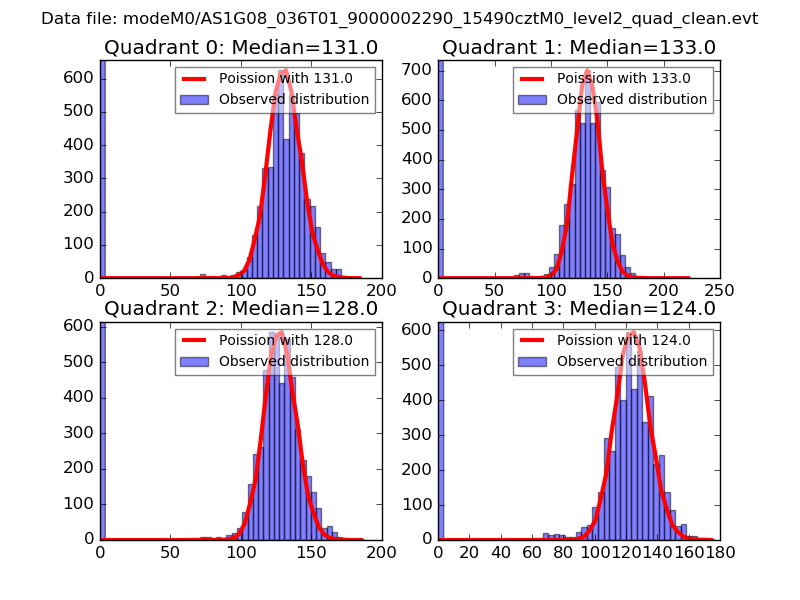 |
 |
| Quadrant-wise count rates Data is divided into 100 sec bins |
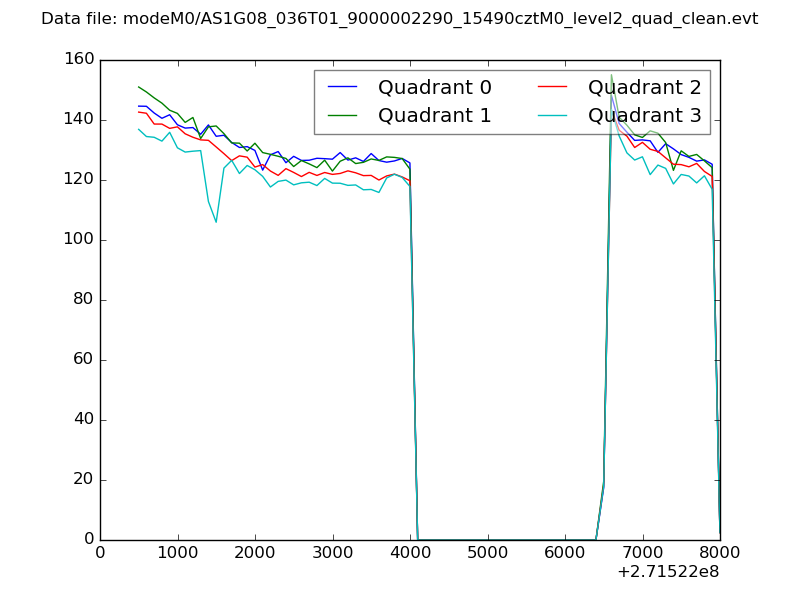 |
|
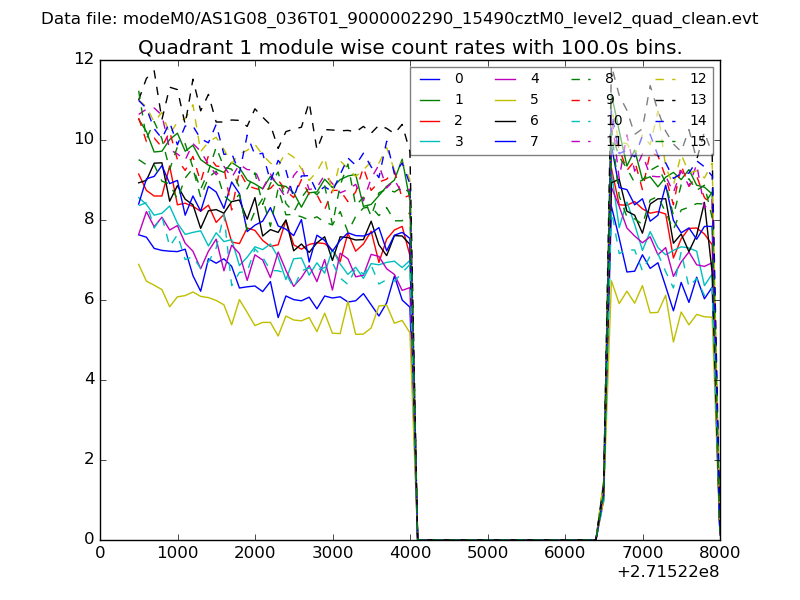
| Module-wise count rates for Quadrant A Data is divided into 100 sec bins |
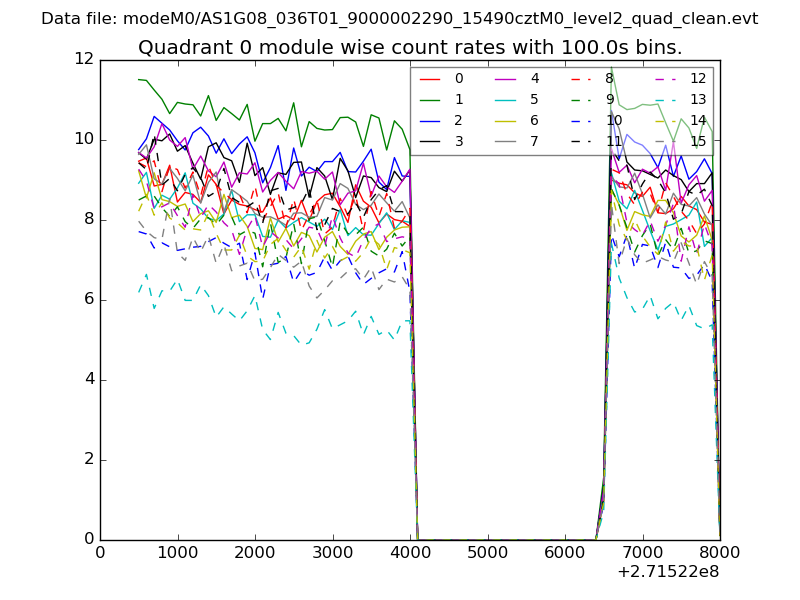 |
 |
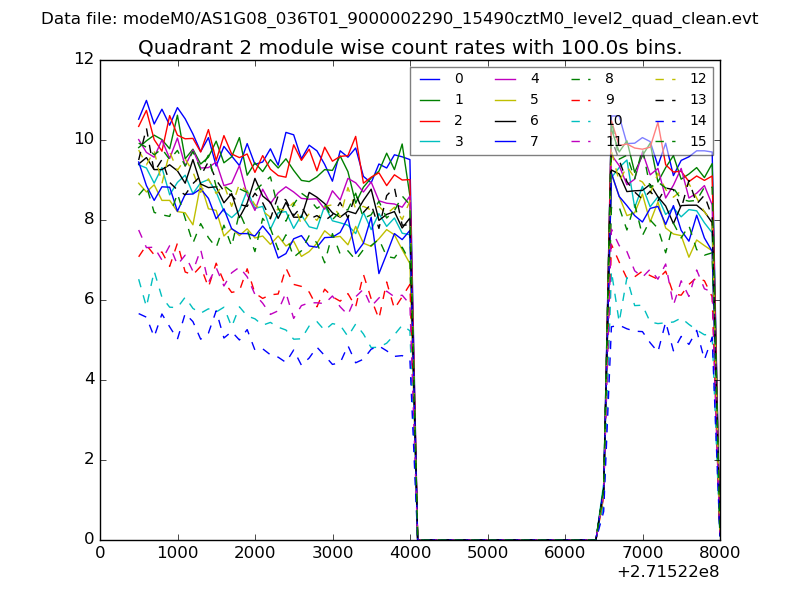
| Module-wise count rates for Quadrant B Data is divided into 100 sec bins |
 |
 |
| Module-wise count rates for Quadrant C Data is divided into 100 sec bins |
 |
 |
| Module-wise count rates for Quadrant D Data is divided into 100 sec bins |
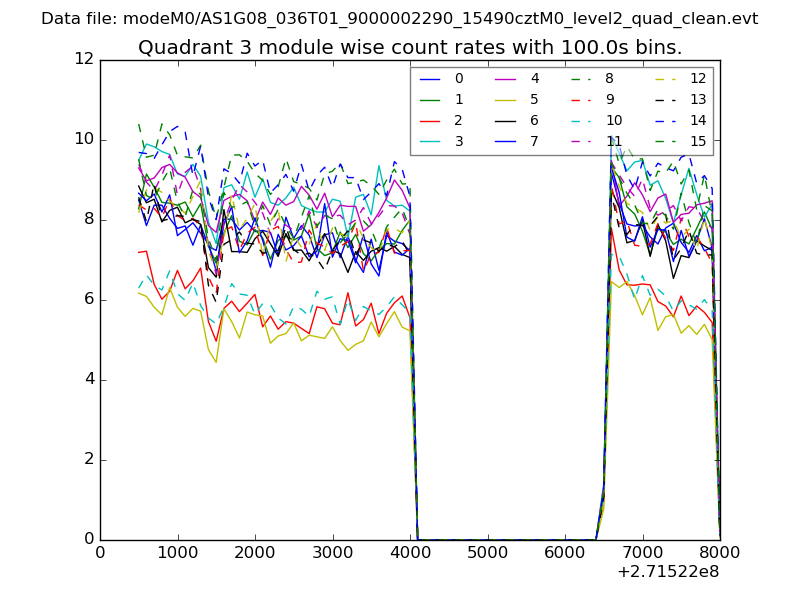 |
 |
| Parameter | Plot |
|---|---|
| CZT HV Monitor | 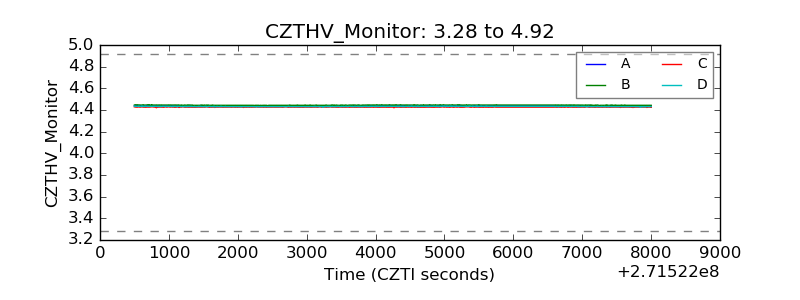 |
| D_VDD | 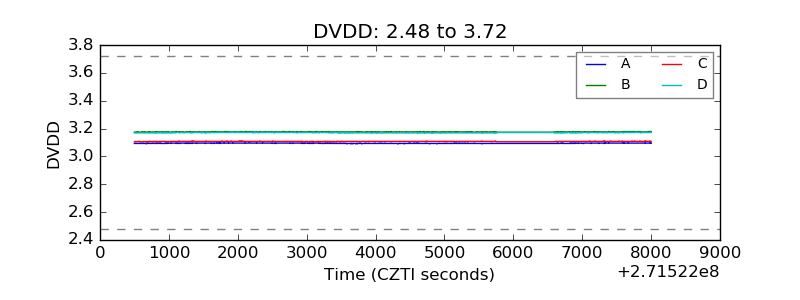 |
| Temperature 1 | 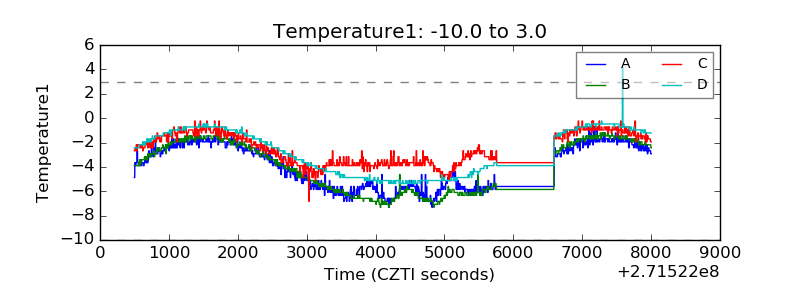 |
| Veto HV Monitor | 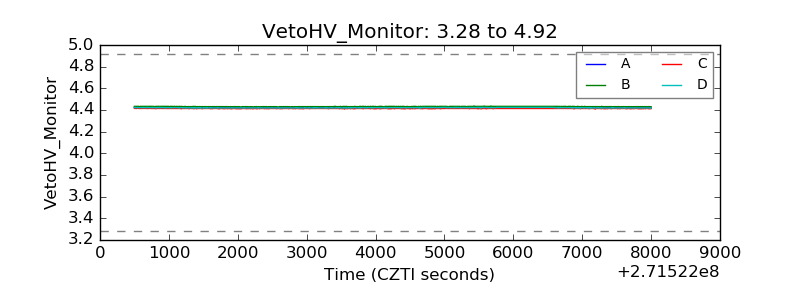 |
| Veto LLD | 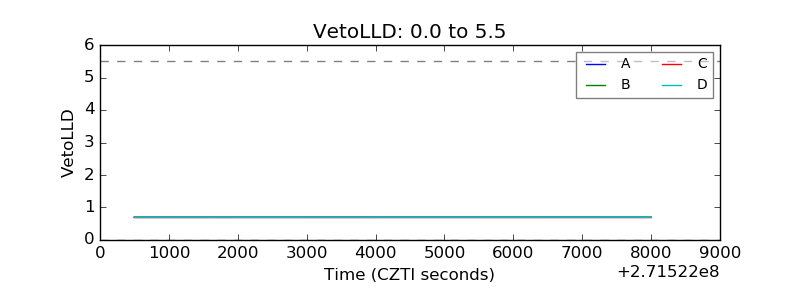 |
| Alpha Counter | 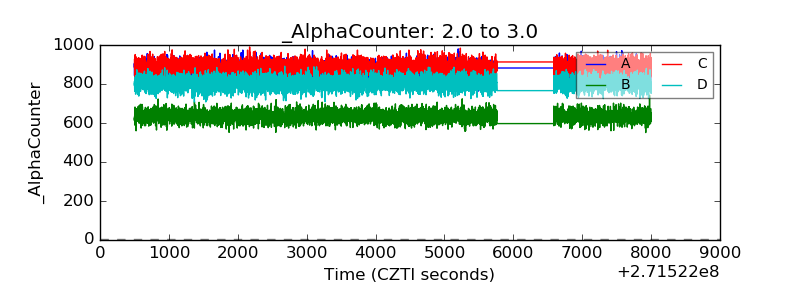 |
| _CPM_Rate |  |
| CZT Counter | 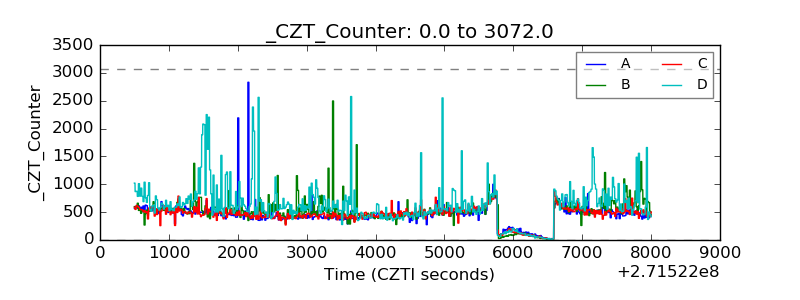 |
| +2.5 Volts monitor | 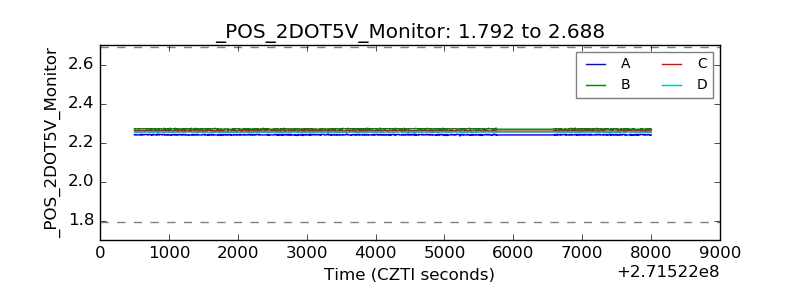 |
| +5 Volts monitor | 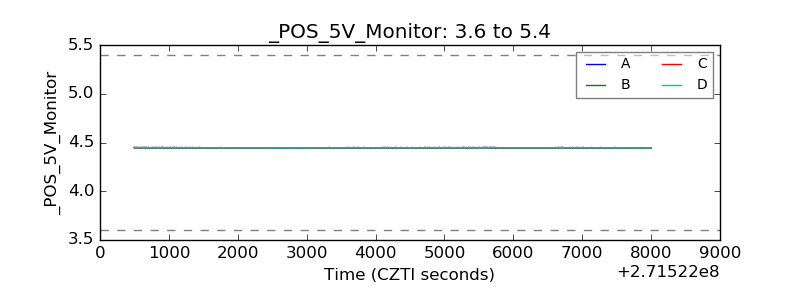 |
| _ROLL_ROT | 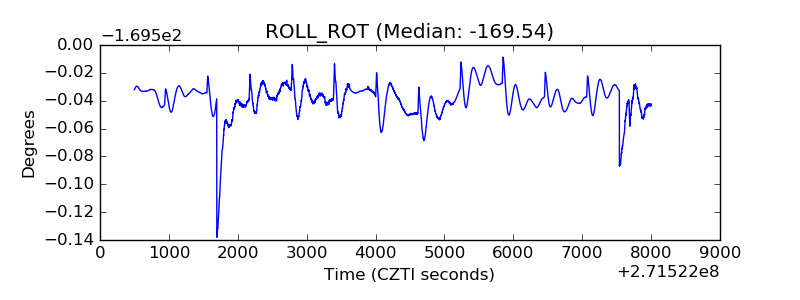 |
| _Roll_DEC |  |
| _Roll_RA |  |
| Veto Counter | 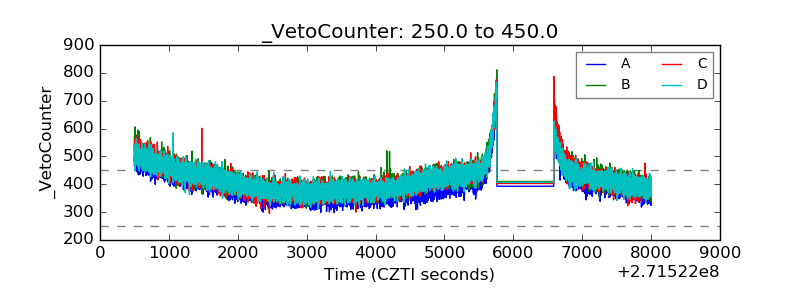 |