| Param | Original file | Final file |
|---|---|---|
| Filename | modeM0/AS1G08_036T01_9000002290_15493cztM0_level2.evt | modeM0/AS1G08_036T01_9000002290_15493cztM0_level2_quad_clean.evt |
| Size (bytes) | 520,865,280 | 104,964,480 |
| Size | 496.7 MB | 100.1 MB |
| Events in quadrant A | 3,616,333 | 675,625 |
| Events in quadrant B | 3,850,803 | 682,575 |
| Events in quadrant C | 3,647,736 | 659,875 |
| Events in quadrant D | 4,150,984 | 639,436 |
| Mode M0 | |||
|---|---|---|---|
| Quadrant | BADHDUFLAG | Total packets | Discarded packets |
| A | 0 | 15715 | 1 |
| B | 0 | 16246 | 1 |
| C | 0 | 15624 | 1 |
| D | 0 | 17419 | 1 |
| Mode SS | |||
|---|---|---|---|
| Quadrant | BADHDUFLAG | Total packets | Discarded packets |
| A | 0 | 152 | 0 |
| B | 0 | 152 | 0 |
| C | 0 | 152 | 0 |
| D | 0 | 152 | 0 |
| Mode M9 | |||
|---|---|---|---|
| Quadrant | BADHDUFLAG | Total packets | Discarded packets |
| A | 0 | 3 | 0 |
| B | 0 | 3 | 0 |
| C | 0 | 3 | 0 |
| D | 0 | 3 | 0 |
| Quadrant | Total seconds | Saturated seconds | Saturation percentage |
|---|---|---|---|
| A | 7492 | 29 | 0.387080% |
| B | 7492 | 52 | 0.694074% |
| C | 7492 | 53 | 0.707421% |
| D | 7492 | 105 | 1.401495% |
Noise dominated data is calculated using 1-second bins in cleaned event files. If a bin has >2000 counts, and if more than 50% of those come from <1% of pixels, then it is considered to be noise-dominated and hence unusable.
| Quadrant | # 1 sec bins | Bins with >0 counts | Bins with >2000 counts | High rate bins dominated by noise | Noise dominated (total time) | Noise dominated (detector-on time) | Marked lightcurve |
|---|---|---|---|---|---|---|---|
| A | 7773 | 7494 | 5 | 5 | 0.06% | 0.07% | 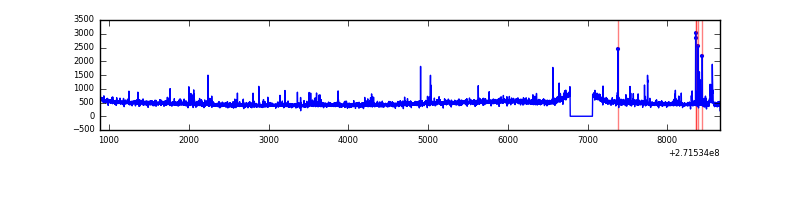 |
| B | 7773 | 7494 | 6 | 6 | 0.08% | 0.08% | 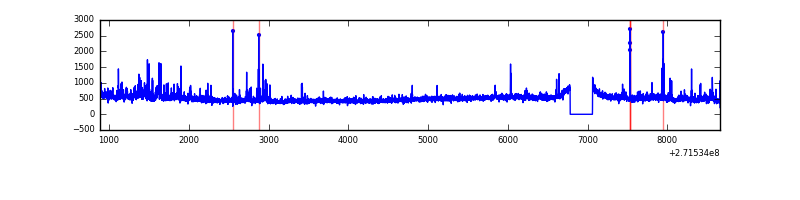 |
| C | 7773 | 7494 | 2 | 2 | 0.03% | 0.03% | 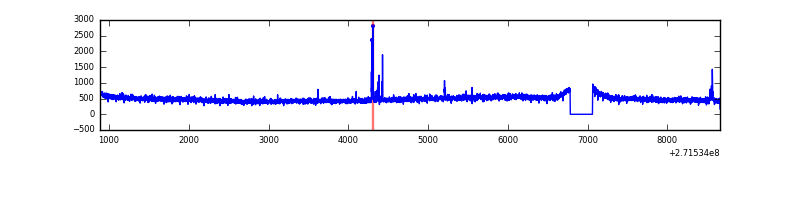 |
| D | 7773 | 7494 | 78 | 78 | 1.00% | 1.04% | 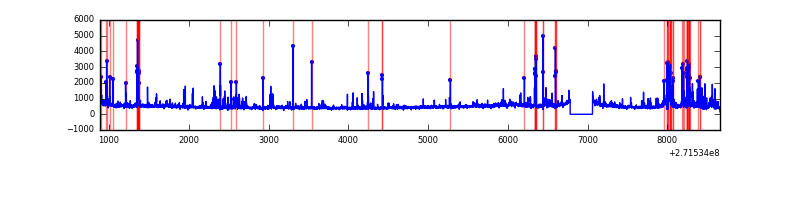 |
Top three noisy pixels from each quadrant. If the there are fewer than three noisy pixels in the level2.evt file, extra rows are filled as -1
| Pixel properties | Quadrant properties | ||||||
|---|---|---|---|---|---|---|---|
| Quadrant | DetID | PixID | Counts | Sigma | Mean | Median | Sigma |
| A | 4 | 2 | 45883 | 242.17 | 907 | 888 | 185.8 |
| A | 9 | 143 | 32279 | 168.95 | 907 | 888 | 185.8 |
| A | 0 | 253 | 20136 | 103.6 | 907 | 888 | 185.8 |
| B | 4 | 142 | 110745 | 641.59 | 902 | 879 | 171.2 |
| B | 0 | 189 | 42916 | 245.49 | 902 | 879 | 171.2 |
| B | 10 | 245 | 41011 | 234.36 | 902 | 879 | 171.2 |
| C | 3 | 233 | 136682 | 673.8 | 858 | 863 | 201.6 |
| C | 14 | 238 | 129749 | 639.4 | 858 | 863 | 201.6 |
| C | 9 | 54 | 32661 | 157.75 | 858 | 863 | 201.6 |
| D | 1 | 52 | 584211 | 2729.57 | 871 | 845 | 213.7 |
| D | 2 | 16 | 65941 | 304.58 | 871 | 845 | 213.7 |
| D | 7 | 38 | 39273 | 179.8 | 871 | 845 | 213.7 |
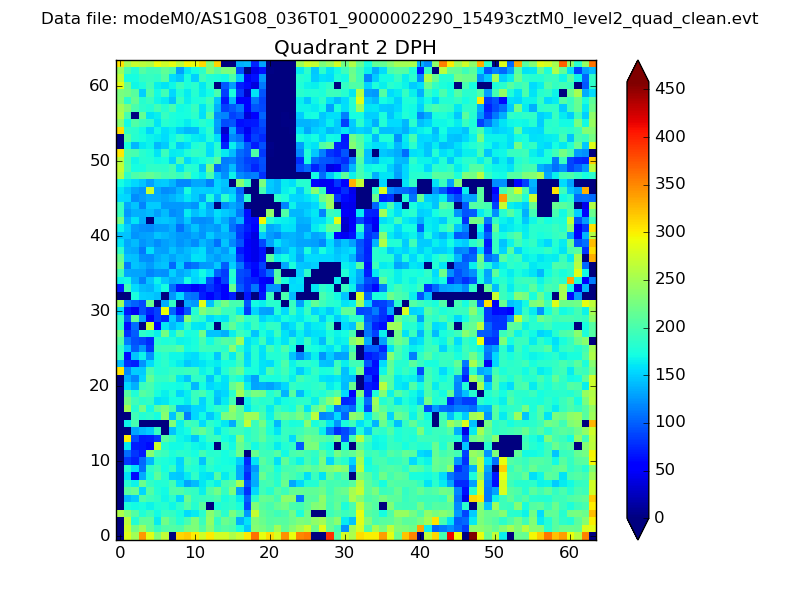
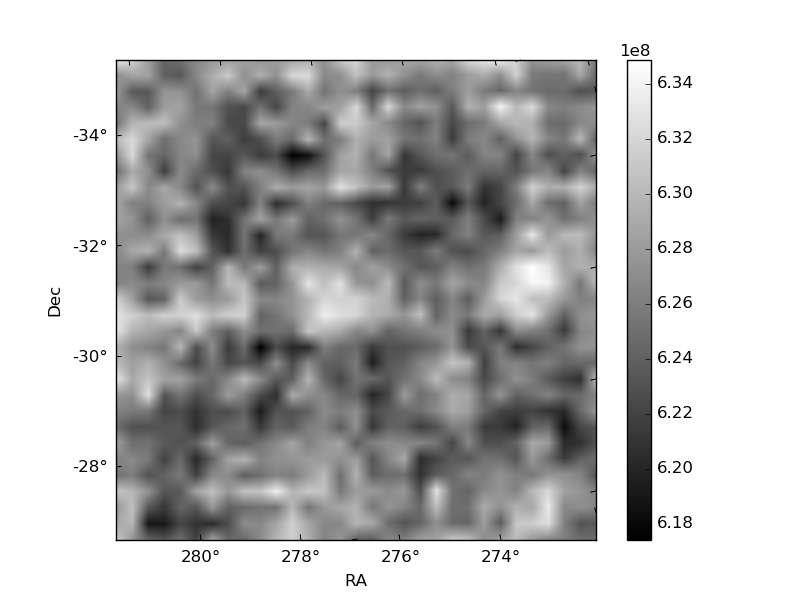
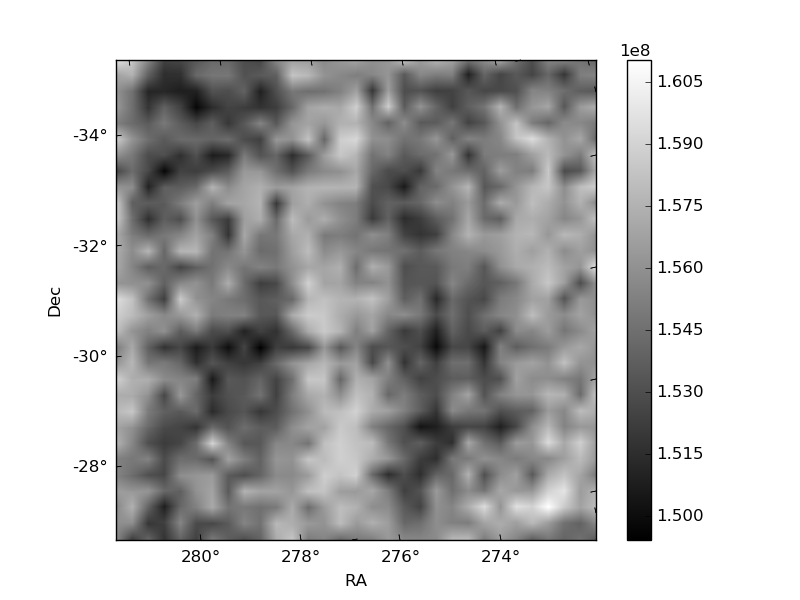
Histogram calculated using DETX and DETY for each event in the final _common_clean file
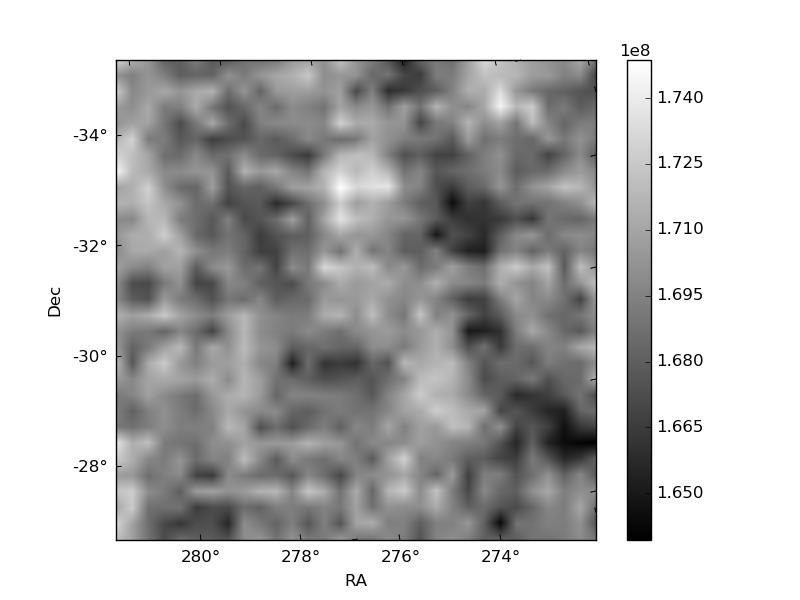
| Quadrant A | 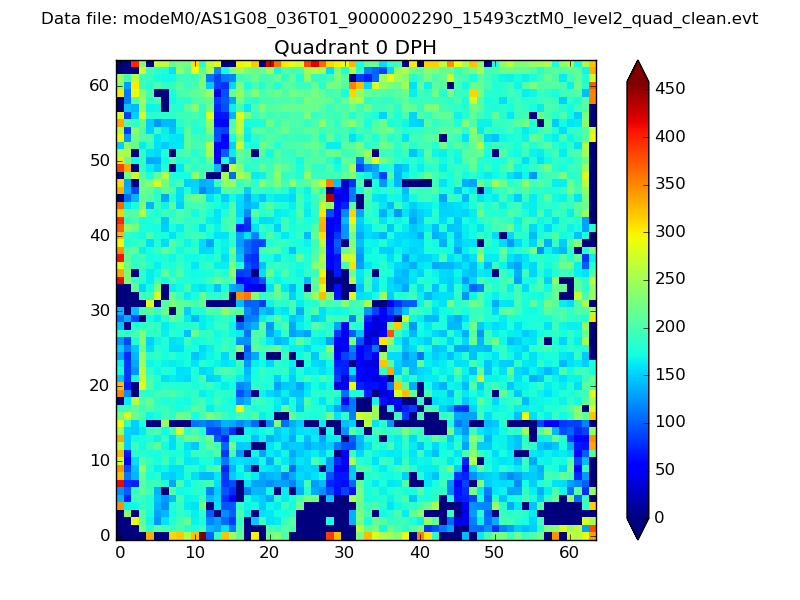 |
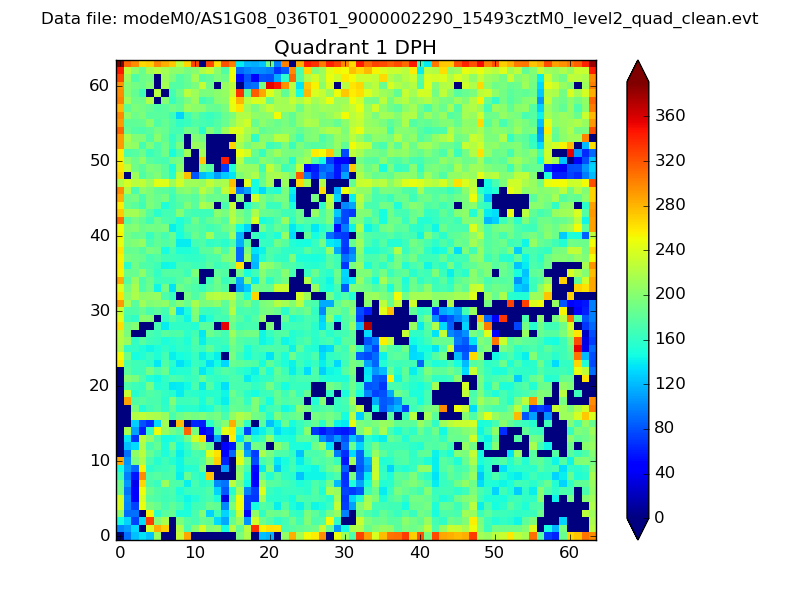 |
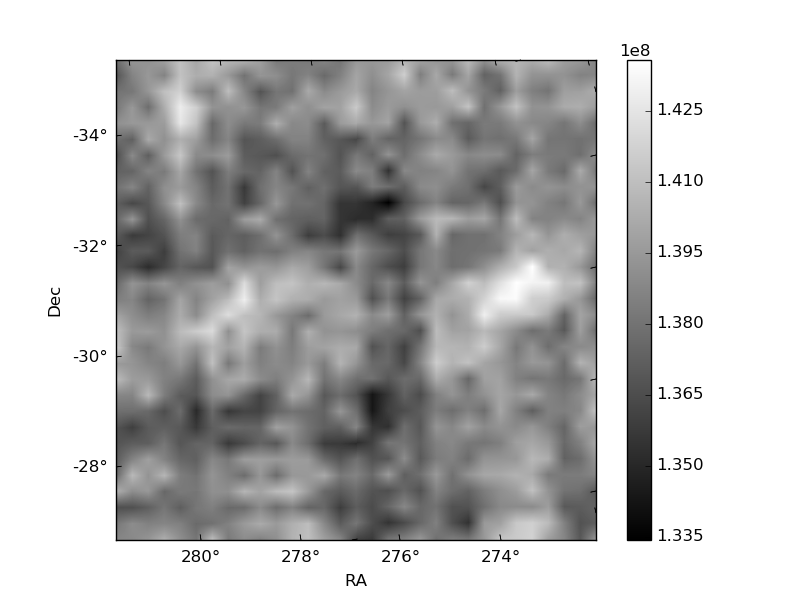
Quadrant B |
|---|---|---|---|
| Quadrant D | 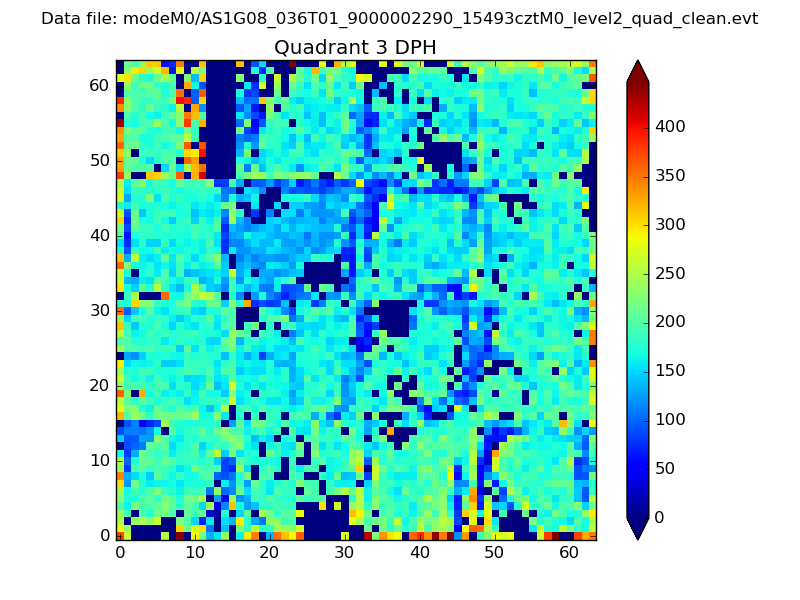 |
 |
Quadrant C |
| Plot type | Count rate plots | Images |
|---|---|---|
| Comparison with Poisson distribution Blue bars denote a histogram of data divided into 1 sec bins. Red curve is a Poisson curve with rate = median count rate of data. |
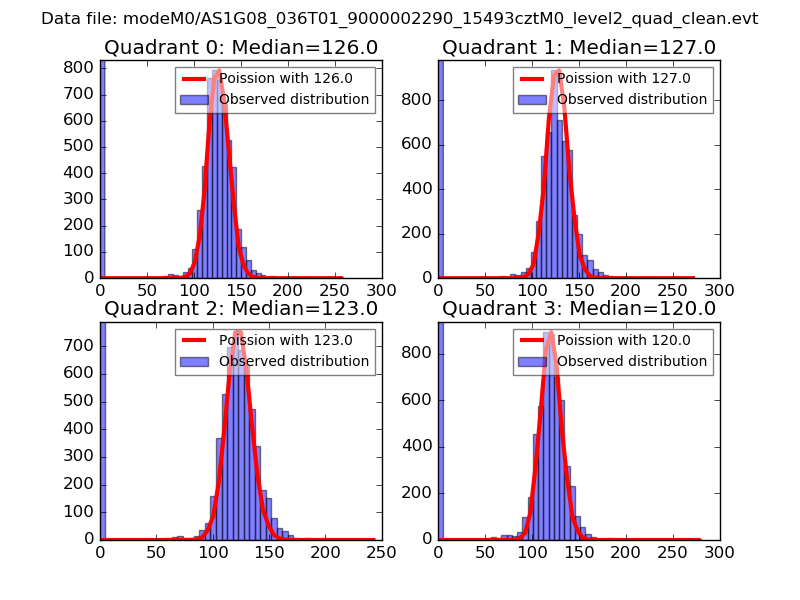 |
 |
| Quadrant-wise count rates Data is divided into 100 sec bins |
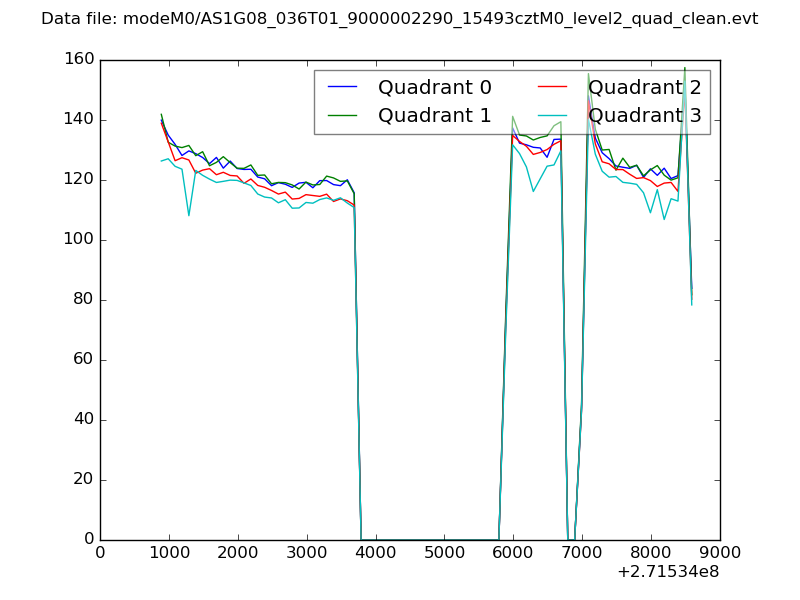 |
|
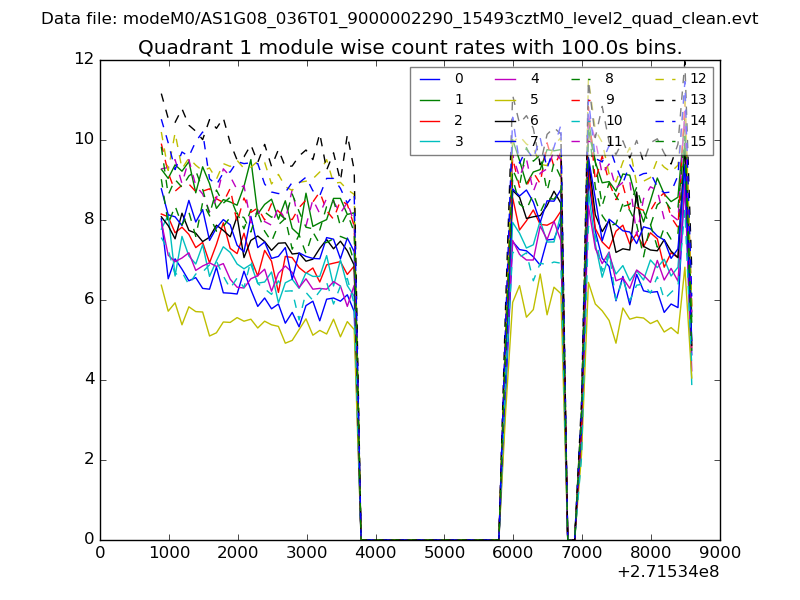
| Module-wise count rates for Quadrant A Data is divided into 100 sec bins |
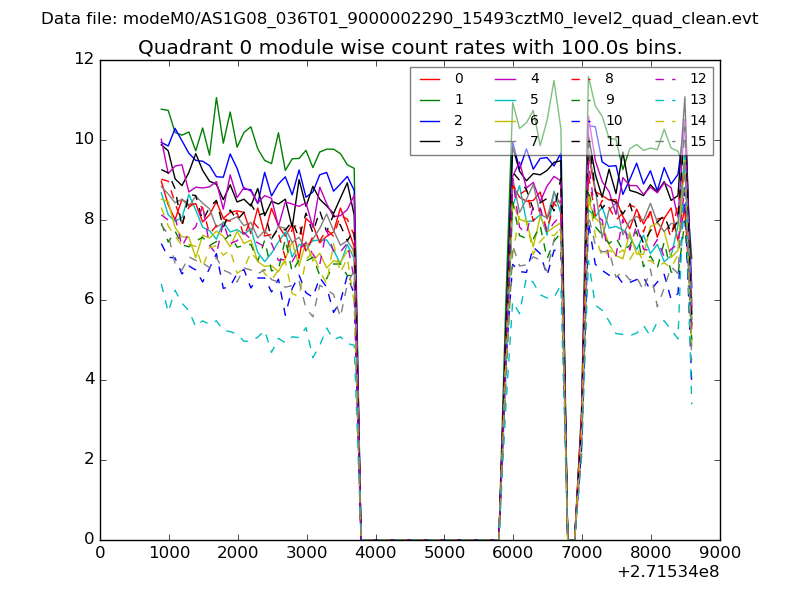 |
 |
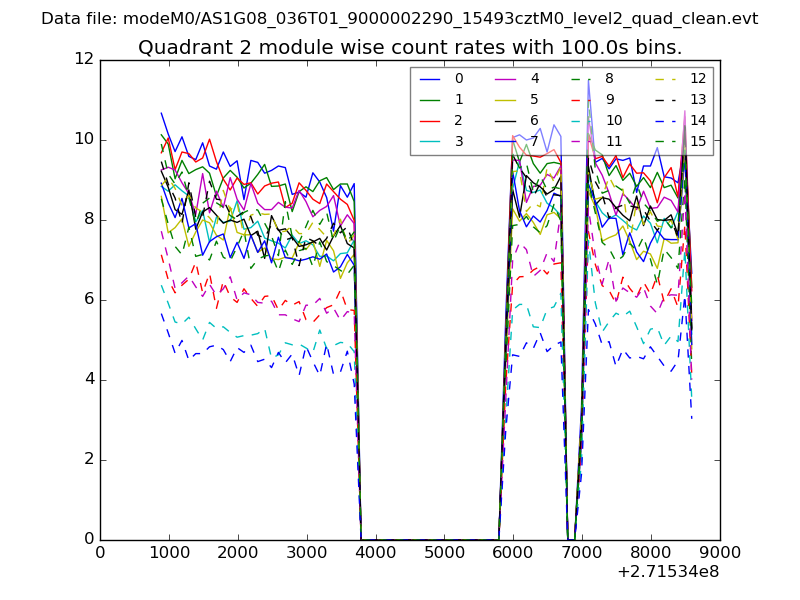
| Module-wise count rates for Quadrant B Data is divided into 100 sec bins |
 |
 |
| Module-wise count rates for Quadrant C Data is divided into 100 sec bins |
 |
 |
| Module-wise count rates for Quadrant D Data is divided into 100 sec bins |
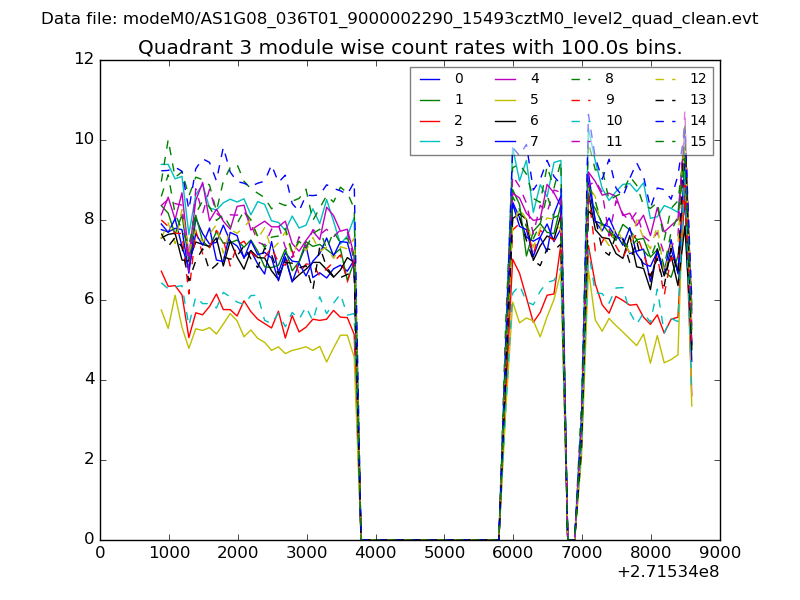 |
 |
| Parameter | Plot |
|---|---|
| CZT HV Monitor | 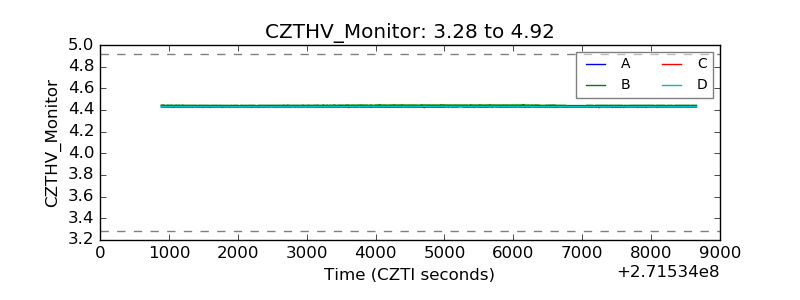 |
| D_VDD | 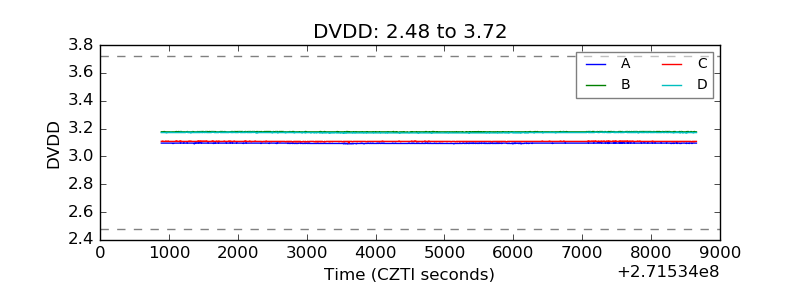 |
| Temperature 1 | 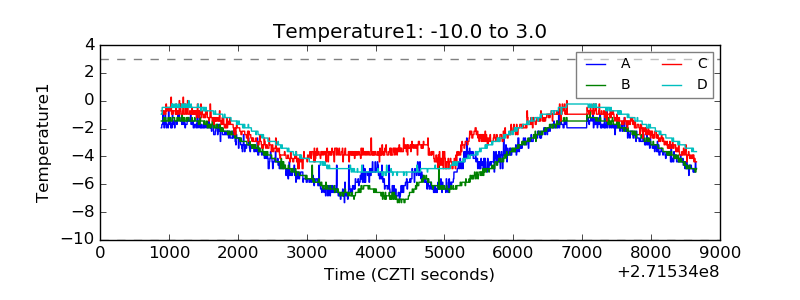 |
| Veto HV Monitor | 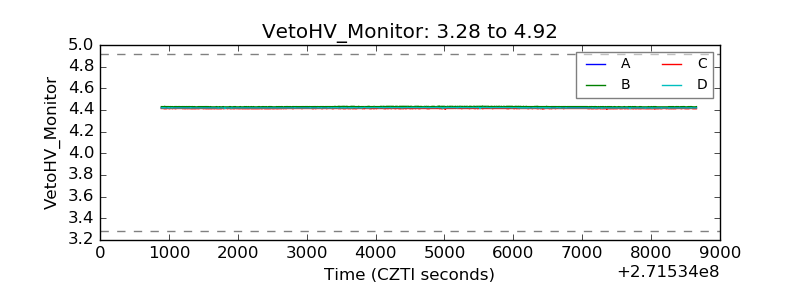 |
| Veto LLD | 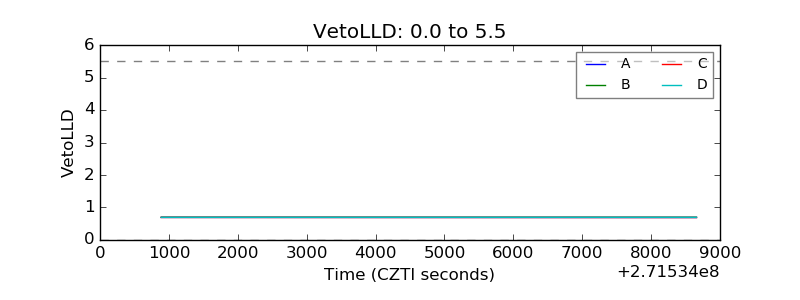 |
| Alpha Counter | 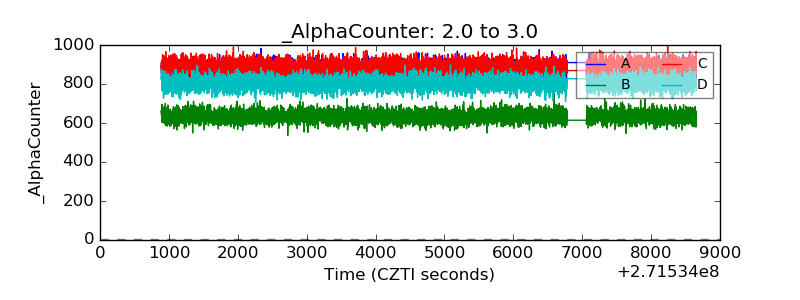 |
| _CPM_Rate | 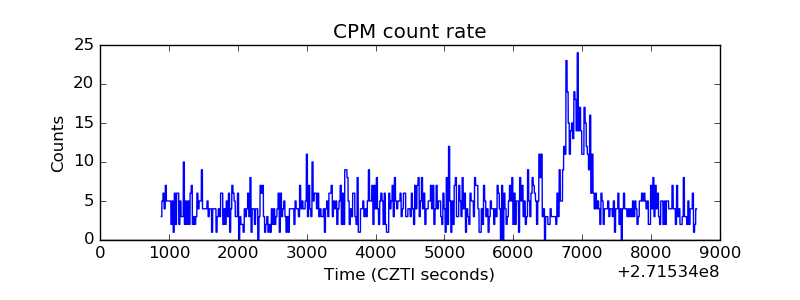 |
| CZT Counter | 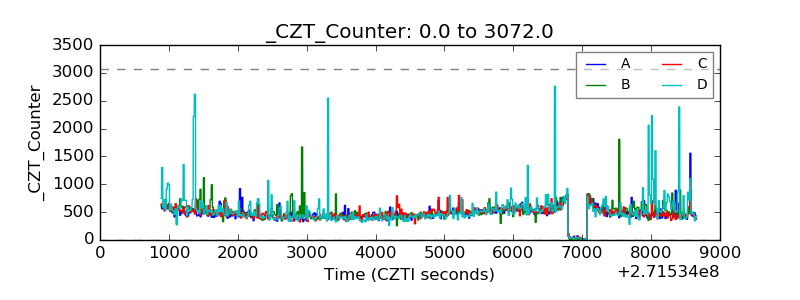 |
| +2.5 Volts monitor |  |
| +5 Volts monitor | 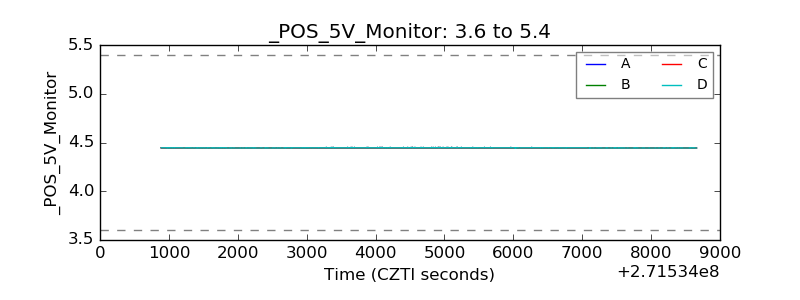 |
| _ROLL_ROT | 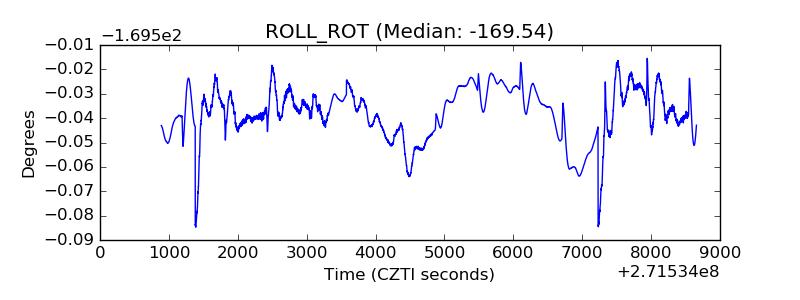 |
| _Roll_DEC | 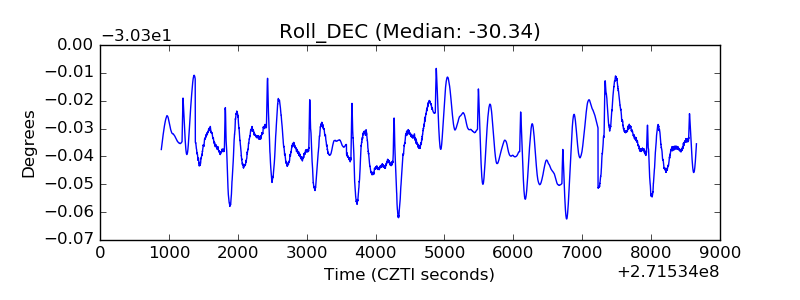 |
| _Roll_RA | 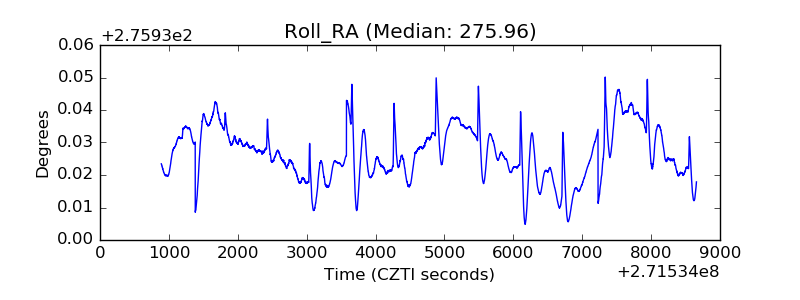 |
| Veto Counter | 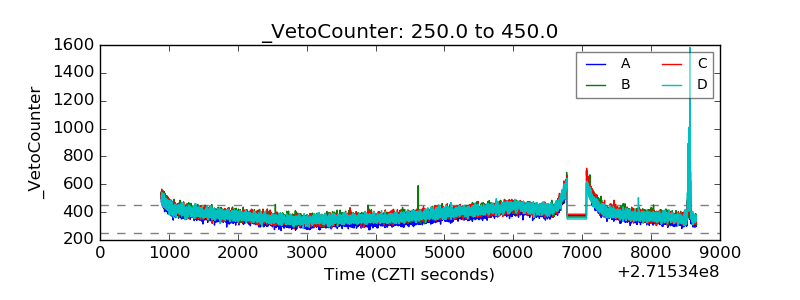 |