| Param | Original file | Final file |
|---|---|---|
| Filename | modeM0/AS1G08_039T01_9000002292cztM0_level2.fits | modeM0/AS1G08_039T01_9000002292cztM0_level2_quad_clean.evt |
| Size (bytes) | 224,887,680 | 217,313,280 |
| Size | 214.5 MB | 207.2 MB |
| Events in quadrant A | 1,350,314 | 1,265,677 |
| Events in quadrant B | 1,300,630 | 1,286,358 |
| Events in quadrant C | 1,329,116 | 1,229,673 |
| Events in quadrant D | 1,155,906 | 1,124,116 |
| Mode M0 | |||
|---|---|---|---|
| Quadrant | BADHDUFLAG | Total packets | Discarded packets |
| A | 0 | 55604 | 0 |
| B | 0 | 53363 | 0 |
| C | 0 | 52698 | 0 |
| D | 0 | 56504 | 0 |
| Mode M9 | |||
|---|---|---|---|
| Quadrant | BADHDUFLAG | Total packets | Discarded packets |
| A | 0 | 26 | 0 |
| B | 0 | 26 | 0 |
| C | 0 | 26 | 0 |
| D | 0 | 26 | 0 |
| Mode SS | |||
|---|---|---|---|
| Quadrant | BADHDUFLAG | Total packets | Discarded packets |
| A | 0 | 496 | 0 |
| B | 0 | 496 | 0 |
| C | 0 | 496 | 0 |
| D | 0 | 496 | 0 |
| Quadrant | Total seconds | Saturated seconds | Saturation percentage |
|---|---|---|---|
| A | 24338 | 517 | 2.124250% |
| B | 24338 | 296 | 1.216205% |
| C | 24338 | 160 | 0.657408% |
| D | 24338 | 377 | 1.549018% |
Noise dominated data is calculated using 1-second bins in cleaned event files. If a bin has >2000 counts, and if more than 50% of those come from <1% of pixels, then it is considered to be noise-dominated and hence unusable.
| Quadrant | # 1 sec bins | Bins with >0 counts | Bins with >2000 counts | High rate bins dominated by noise | Noise dominated (total time) | Noise dominated (detector-on time) | Marked lightcurve |
|---|---|---|---|---|---|---|---|
| A | 26933 | 24337 | 0 | 0 | 0.00% | 0.00% |  |
| B | 26933 | 24338 | 0 | 0 | 0.00% | 0.00% |  |
| C | 26933 | 24338 | 0 | 0 | 0.00% | 0.00% |  |
| D | 26933 | 24335 | 0 | 0 | 0.00% | 0.00% |  |
Top three noisy pixels from each quadrant. If the there are fewer than three noisy pixels in the level2.evt file, extra rows are filled as -1
| Pixel properties | Quadrant properties | ||||||
|---|---|---|---|---|---|---|---|
| Quadrant | DetID | PixID | Counts | Sigma | Mean | Median | Sigma |
| A | 0 | 29 | 1286 | 10.71 | 351 | 329 | 89.4 |
| A | 7 | 110 | 1102 | 8.65 | 351 | 329 | 89.4 |
| A | 15 | 236 | 1034 | 7.89 | 351 | 329 | 89.4 |
| B | 2 | 9 | 1106 | 11.23 | 344 | 327 | 69.4 |
| B | 2 | 8 | 888 | 8.08 | 344 | 327 | 69.4 |
| B | 14 | 254 | 861 | 7.7 | 344 | 327 | 69.4 |
| C | 1 | 80 | 1028 | 7.51 | 351 | 325 | 93.7 |
| C | 1 | 81 | 1020 | 7.42 | 351 | 325 | 93.7 |
| C | 12 | 241 | 958 | 6.76 | 351 | 325 | 93.7 |
| D | 6 | 231 | 873 | 6.4 | 330 | 300 | 89.5 |
| D | 3 | 14 | 812 | 5.72 | 330 | 300 | 89.5 |
| D | 7 | 3 | 803 | 5.62 | 330 | 300 | 89.5 |
Histogram calculated using DETX and DETY for each event in the final _common_clean file
| Quadrant A | 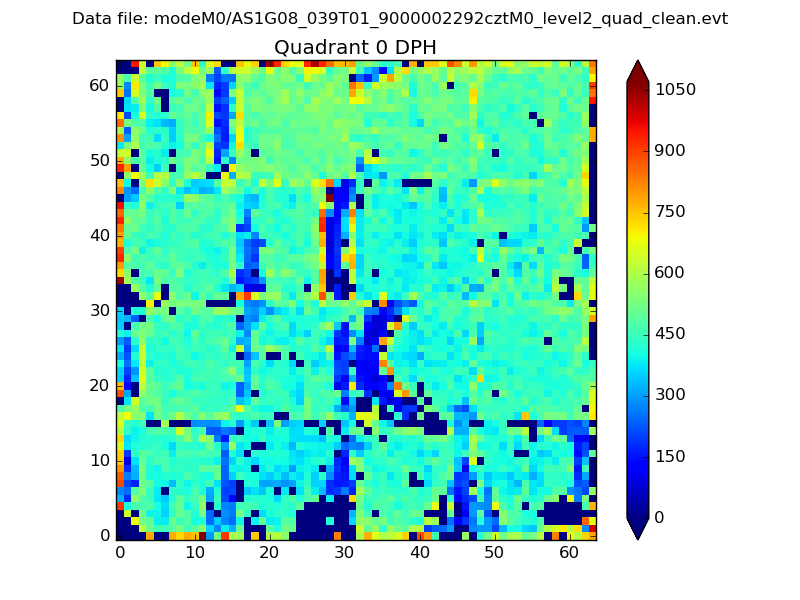 |
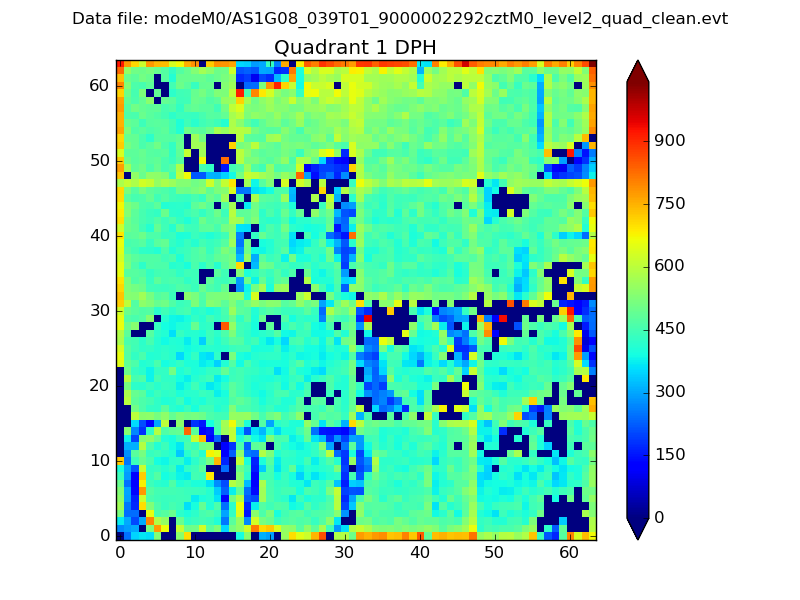 |
Quadrant B |
|---|---|---|---|
| Quadrant D |  |
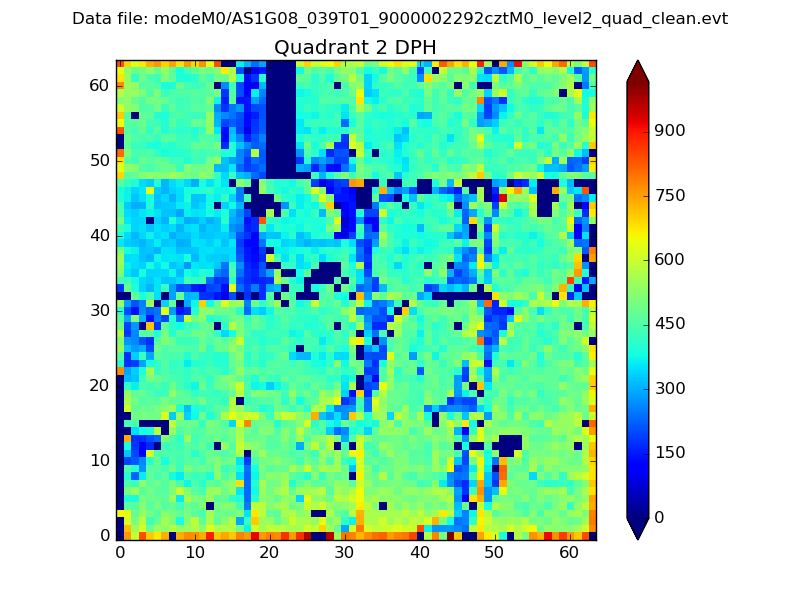 |
Quadrant C |
| Plot type | Count rate plots | Images |
|---|---|---|
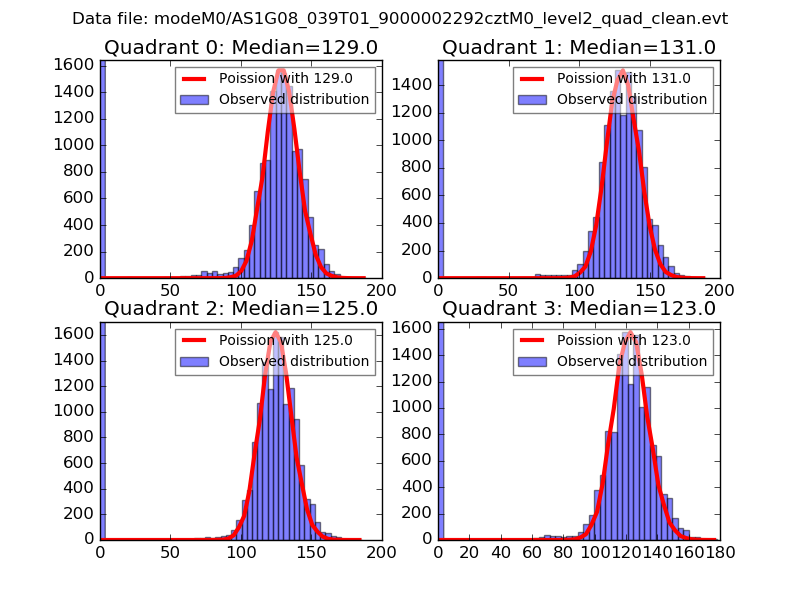
| Comparison with Poisson distribution Blue bars denote a histogram of data divided into 1 sec bins. Red curve is a Poisson curve with rate = median count rate of data. |
 |
 |
| Quadrant-wise count rates Data is divided into 100 sec bins |
 |
|
| Module-wise count rates for Quadrant A Data is divided into 100 sec bins |
 |
 |
| Module-wise count rates for Quadrant B Data is divided into 100 sec bins |
 |
 |
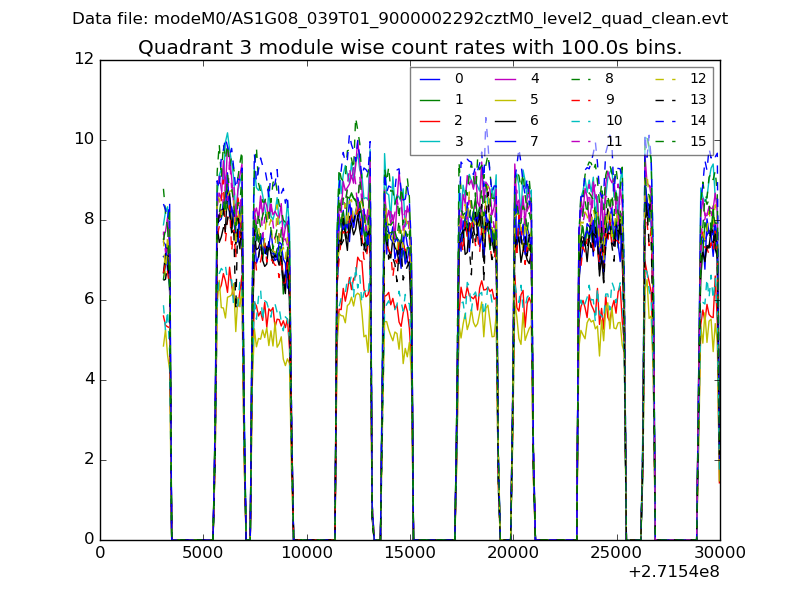
| Module-wise count rates for Quadrant C Data is divided into 100 sec bins |
 |
 |
| Module-wise count rates for Quadrant D Data is divided into 100 sec bins |
 |
 |
| Parameter | Plot |
|---|---|
| CZT HV Monitor |  |
| D_VDD |  |
| Temperature 1 | 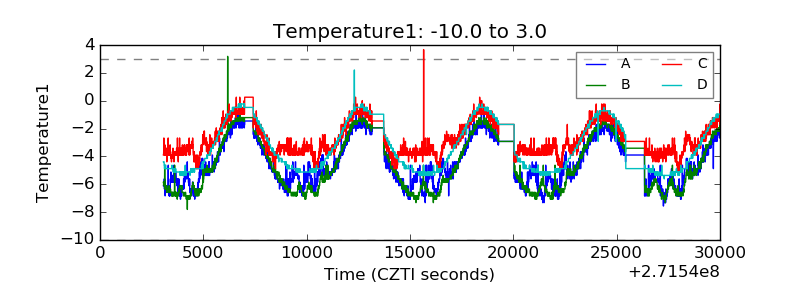 |
| Veto HV Monitor |  |
| Veto LLD |  |
| Alpha Counter |  |
| _CPM_Rate |  |
| CZT Counter |  |
| +2.5 Volts monitor | 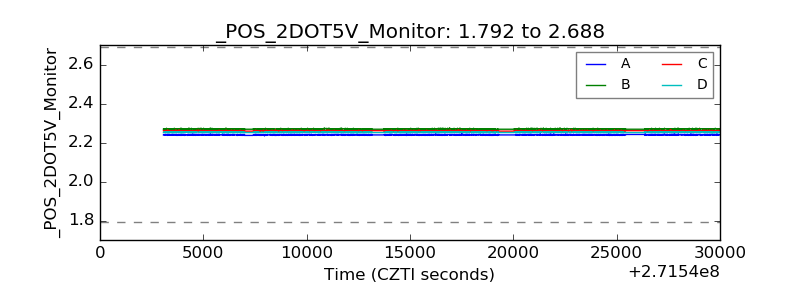 |
| +5 Volts monitor | 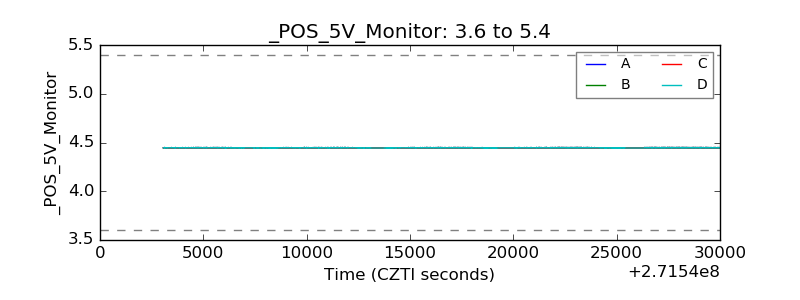 |
| _ROLL_ROT |  |
| _Roll_DEC |  |
| _Roll_RA |  |
| Veto Counter | 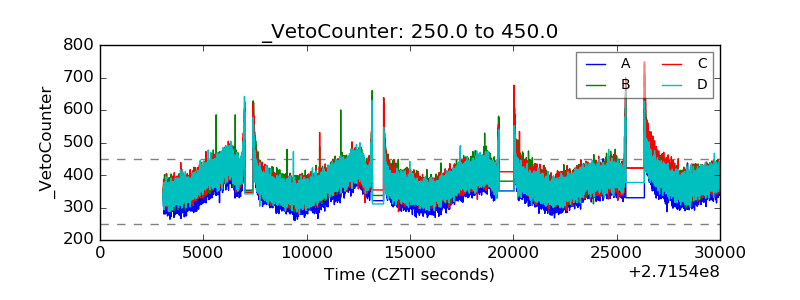 |