| Param | Original file | Final file |
|---|---|---|
| Filename | modeM0/AS1G08_039T01_9000002292_15495cztM0_level2.evt | modeM0/AS1G08_039T01_9000002292_15495cztM0_level2_quad_clean.evt |
| Size (bytes) | 930,101,760 | 159,217,920 |
| Size | 887.0 MB | 151.8 MB |
| Events in quadrant A | 7,185,746 | 993,640 |
| Events in quadrant B | 6,381,583 | 1,019,198 |
| Events in quadrant C | 6,928,348 | 974,208 |
| Events in quadrant D | 6,809,356 | 953,069 |
| Mode M0 | |||
|---|---|---|---|
| Quadrant | BADHDUFLAG | Total packets | Discarded packets |
| A | 0 | 29719 | 3 |
| B | 0 | 27254 | 2 |
| C | 0 | 28668 | 2 |
| D | 0 | 28964 | 2 |
| Mode M9 | |||
|---|---|---|---|
| Quadrant | BADHDUFLAG | Total packets | Discarded packets |
| A | 0 | 13 | 0 |
| B | 0 | 13 | 0 |
| C | 0 | 13 | 0 |
| D | 0 | 13 | 0 |
| Mode SS | |||
|---|---|---|---|
| Quadrant | BADHDUFLAG | Total packets | Discarded packets |
| A | 0 | 258 | 0 |
| B | 0 | 258 | 0 |
| C | 0 | 258 | 0 |
| D | 0 | 258 | 0 |
| Quadrant | Total seconds | Saturated seconds | Saturation percentage |
|---|---|---|---|
| A | 12766 | 286 | 2.240326% |
| B | 12766 | 81 | 0.634498% |
| C | 12766 | 72 | 0.563998% |
| D | 12766 | 132 | 1.033997% |
Noise dominated data is calculated using 1-second bins in cleaned event files. If a bin has >2000 counts, and if more than 50% of those come from <1% of pixels, then it is considered to be noise-dominated and hence unusable.
| Quadrant | # 1 sec bins | Bins with >0 counts | Bins with >2000 counts | High rate bins dominated by noise | Noise dominated (total time) | Noise dominated (detector-on time) | Marked lightcurve |
|---|---|---|---|---|---|---|---|
| A | 14052 | 12769 | 176 | 176 | 1.25% | 1.38% | 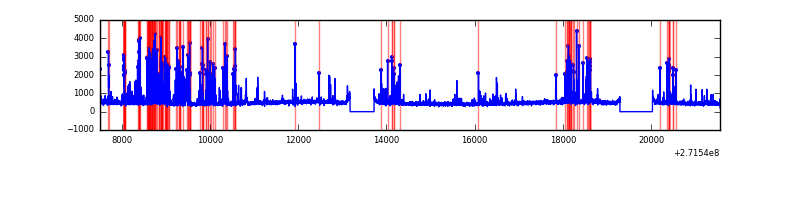 |
| B | 14052 | 12769 | 10 | 10 | 0.07% | 0.08% | 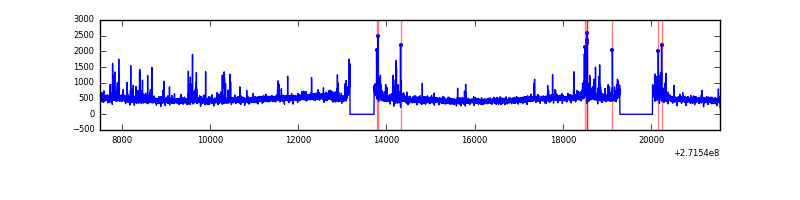 |
| C | 14052 | 12769 | 0 | 0 | 0.00% | 0.00% | 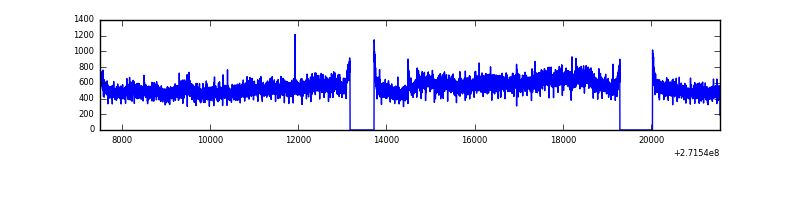 |
| D | 14052 | 12769 | 108 | 108 | 0.77% | 0.85% | 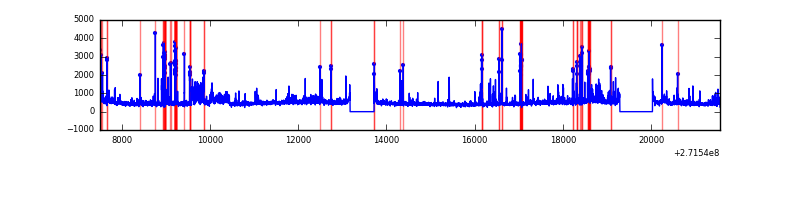 |
Top three noisy pixels from each quadrant. If the there are fewer than three noisy pixels in the level2.evt file, extra rows are filled as -1
| Pixel properties | Quadrant properties | ||||||
|---|---|---|---|---|---|---|---|
| Quadrant | DetID | PixID | Counts | Sigma | Mean | Median | Sigma |
| A | 14 | 237 | 927879 | 3058.49 | 1494 | 1463 | 302.9 |
| A | 14 | 238 | 398789 | 1311.74 | 1494 | 1463 | 302.9 |
| A | 4 | 2 | 73338 | 237.29 | 1494 | 1463 | 302.9 |
| B | 4 | 142 | 153649 | 529.84 | 1507 | 1468 | 287.2 |
| B | 0 | 189 | 88690 | 303.68 | 1507 | 1468 | 287.2 |
| B | 10 | 245 | 57129 | 193.79 | 1507 | 1468 | 287.2 |
| C | 3 | 233 | 1074198 | 3198.99 | 1436 | 1442 | 335.3 |
| C | 14 | 238 | 220531 | 653.33 | 1436 | 1442 | 335.3 |
| C | 8 | 128 | 14661 | 39.42 | 1436 | 1442 | 335.3 |
| D | 5 | 222 | 740592 | 2074.44 | 1450 | 1407 | 356.3 |
| D | 1 | 52 | 128422 | 356.45 | 1450 | 1407 | 356.3 |
| D | 12 | 221 | 105708 | 292.71 | 1450 | 1407 | 356.3 |
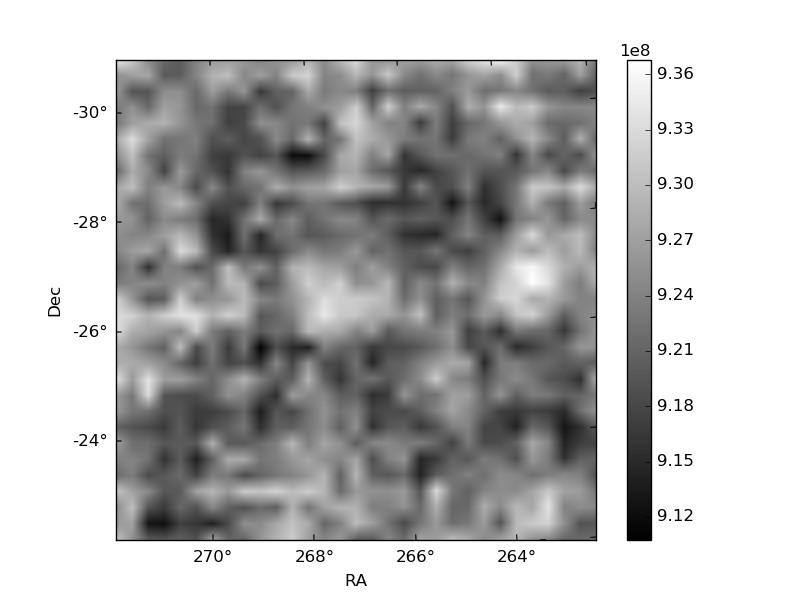
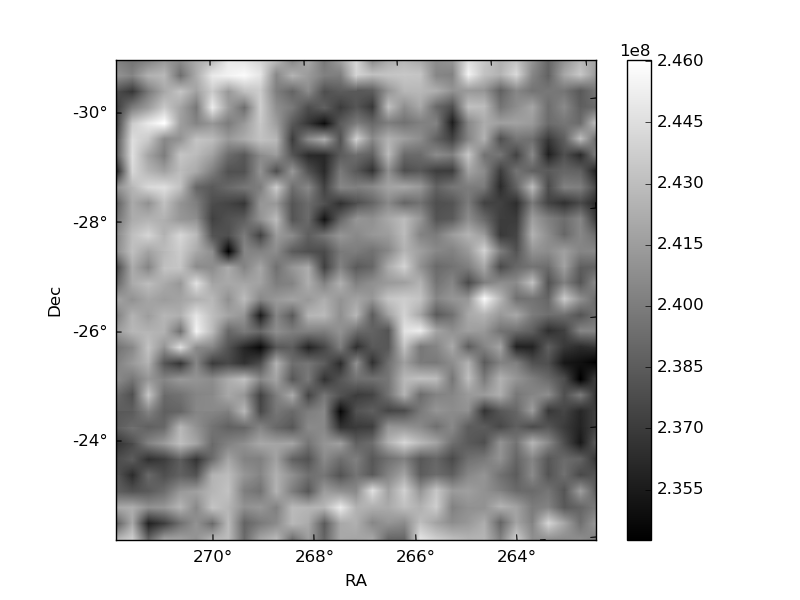
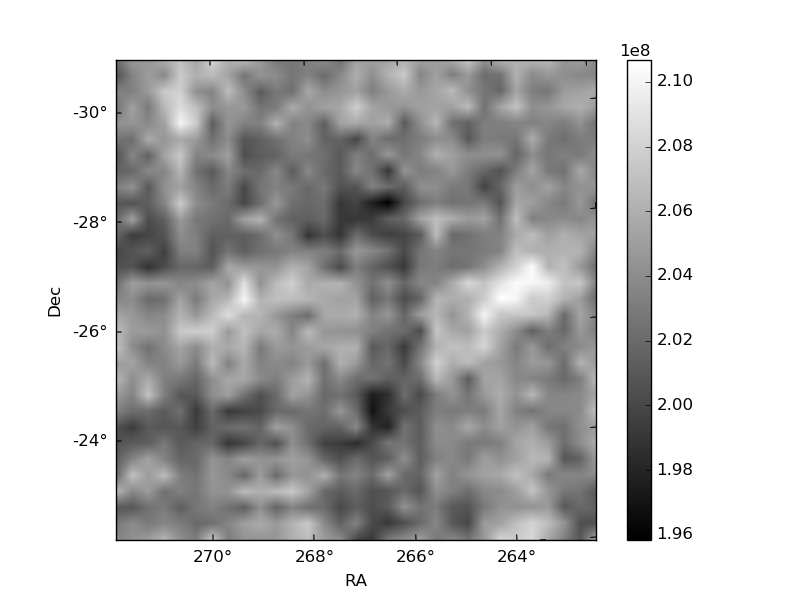
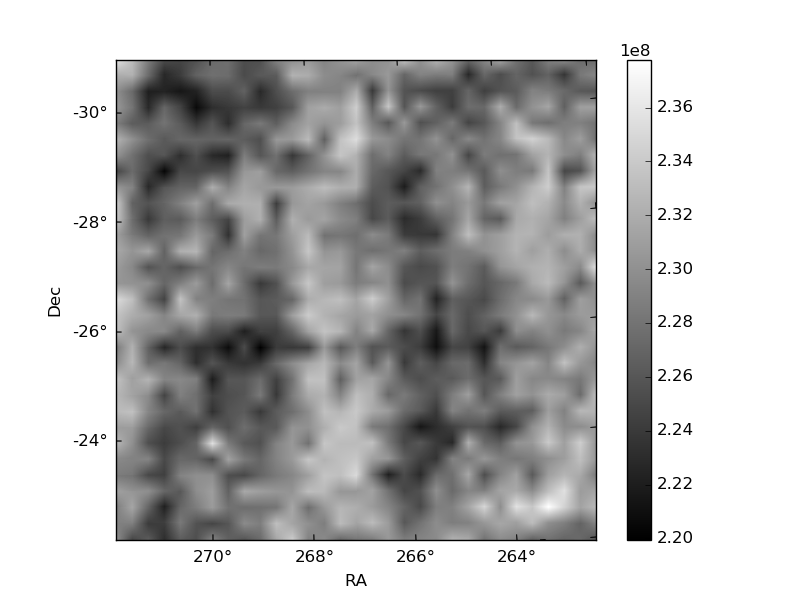
Histogram calculated using DETX and DETY for each event in the final _common_clean file
| Quadrant A | 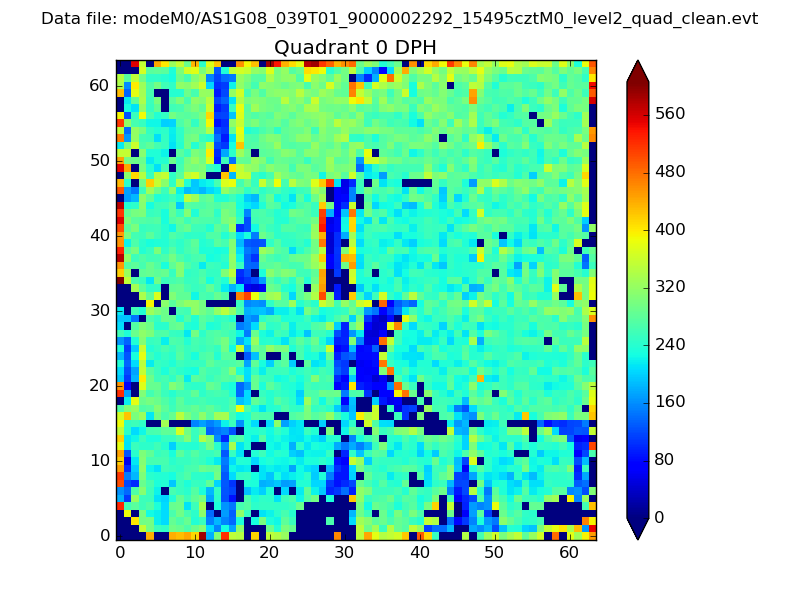 |
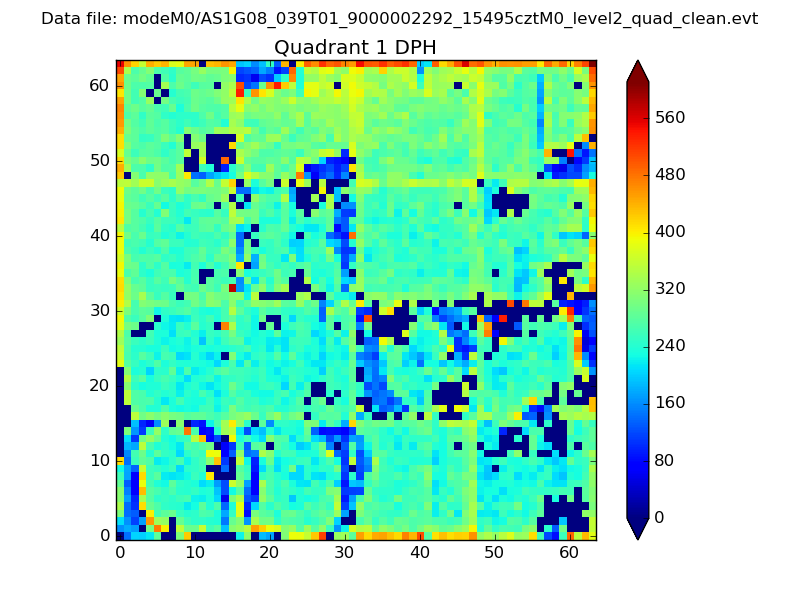 |
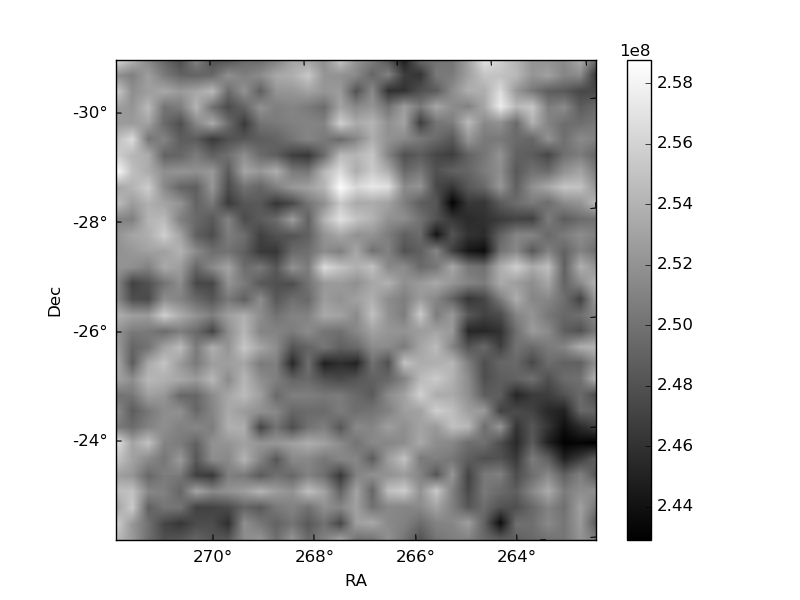
Quadrant B |
|---|---|---|---|
| Quadrant D | 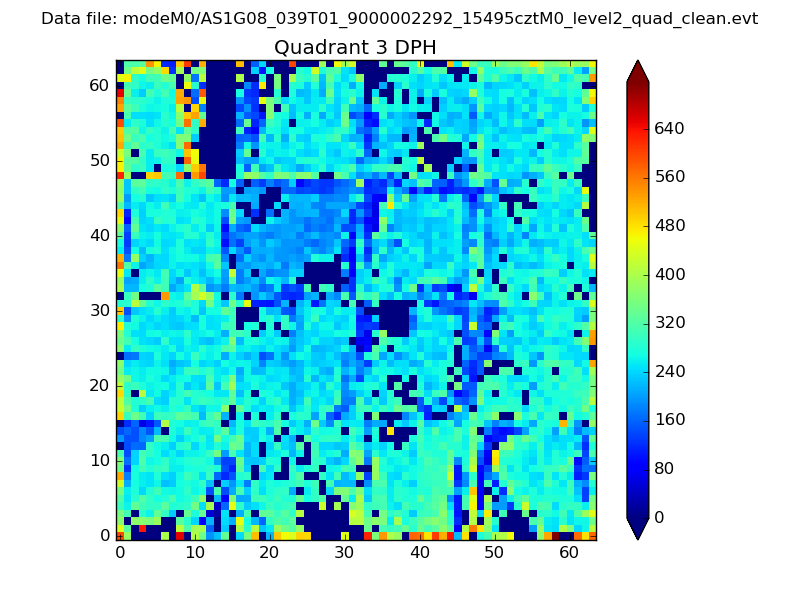 |
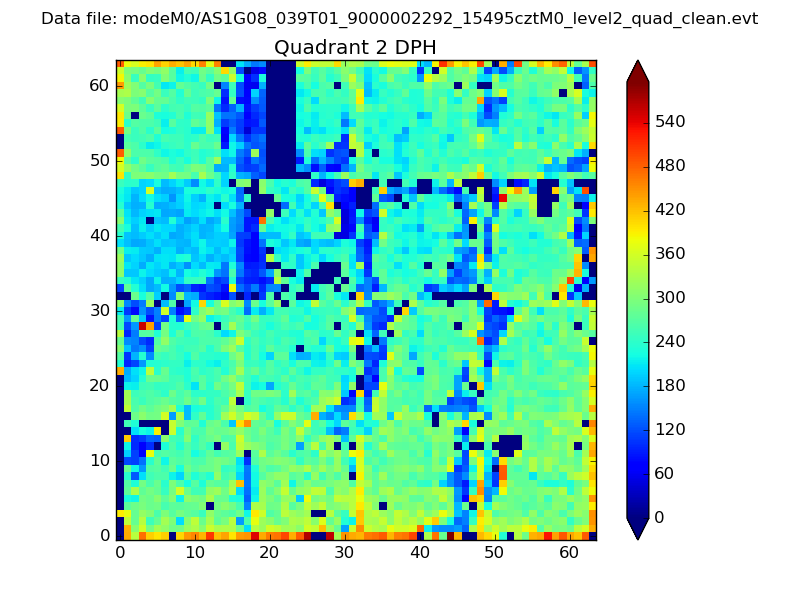 |
Quadrant C |
| Plot type | Count rate plots | Images |
|---|---|---|
| Comparison with Poisson distribution Blue bars denote a histogram of data divided into 1 sec bins. Red curve is a Poisson curve with rate = median count rate of data. |
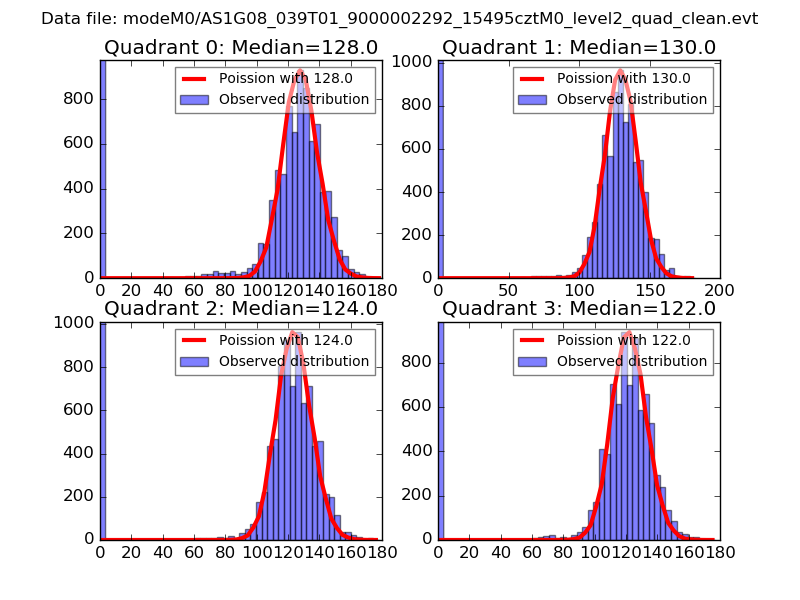 |
 |
| Quadrant-wise count rates Data is divided into 100 sec bins |
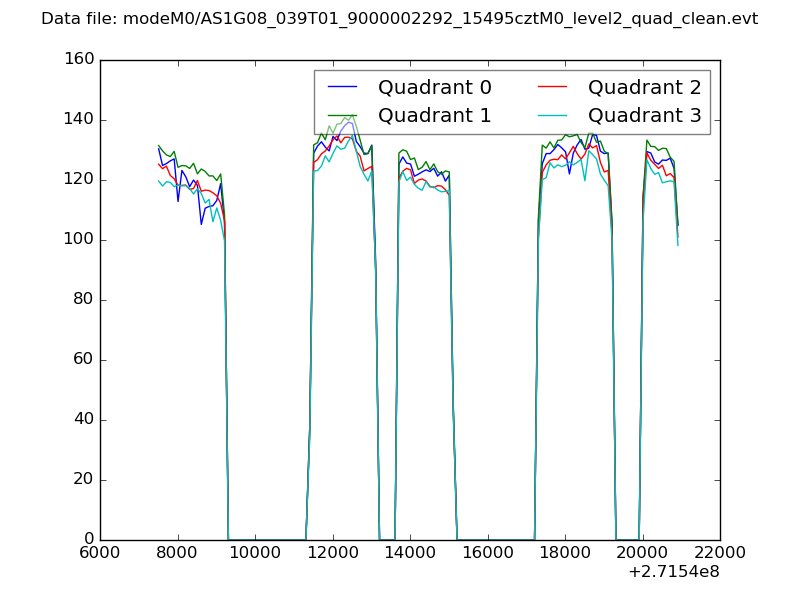 |
|
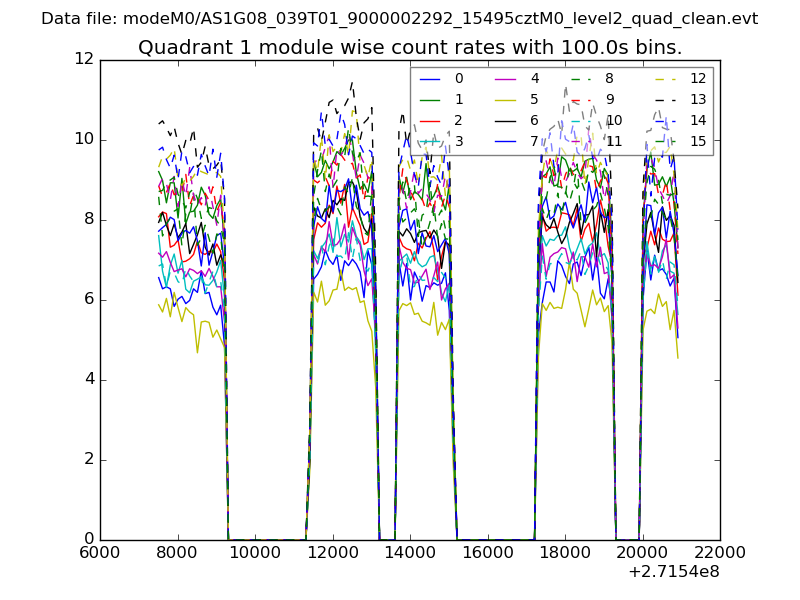
| Module-wise count rates for Quadrant A Data is divided into 100 sec bins |
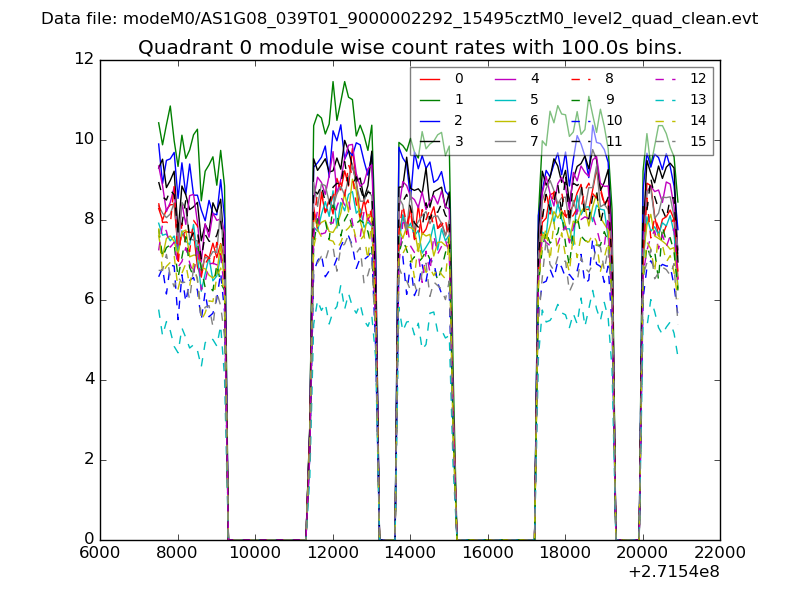 |
 |
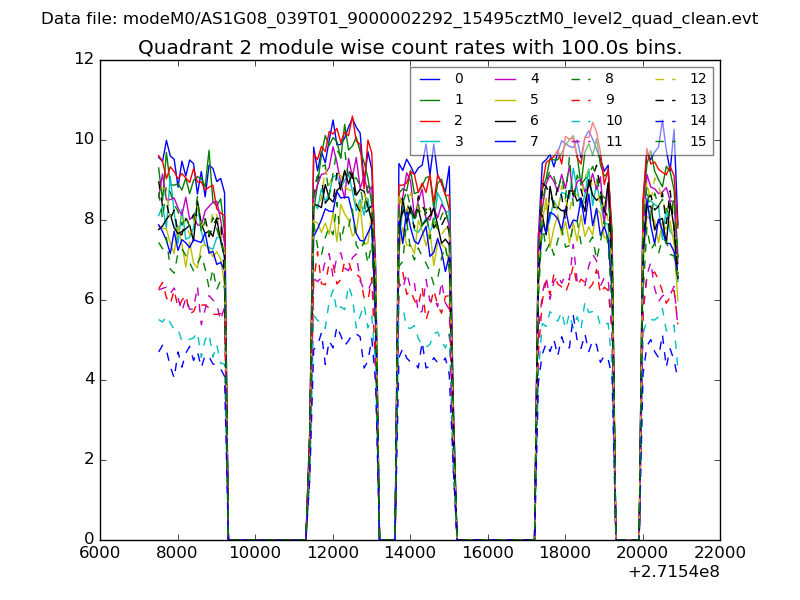
| Module-wise count rates for Quadrant B Data is divided into 100 sec bins |
 |
 |
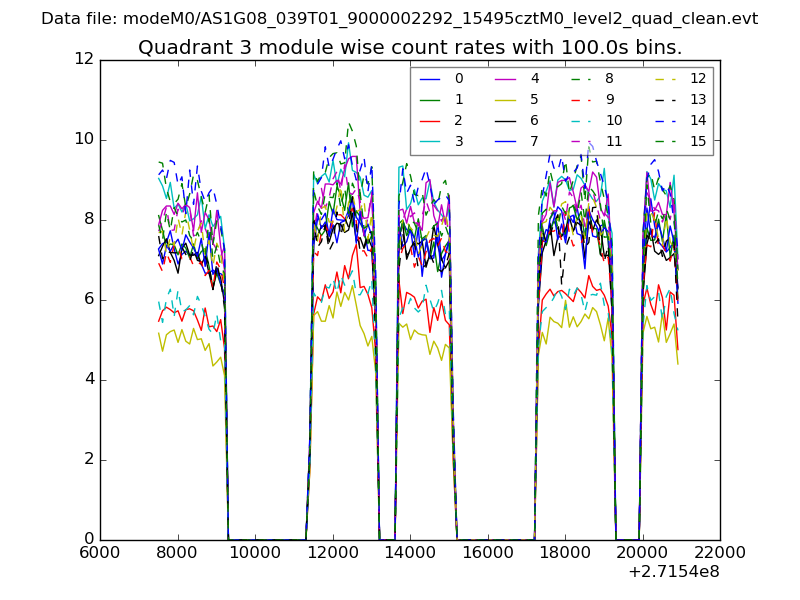
| Module-wise count rates for Quadrant C Data is divided into 100 sec bins |
 |
 |
| Module-wise count rates for Quadrant D Data is divided into 100 sec bins |
 |
 |
| Parameter | Plot |
|---|---|
| CZT HV Monitor | 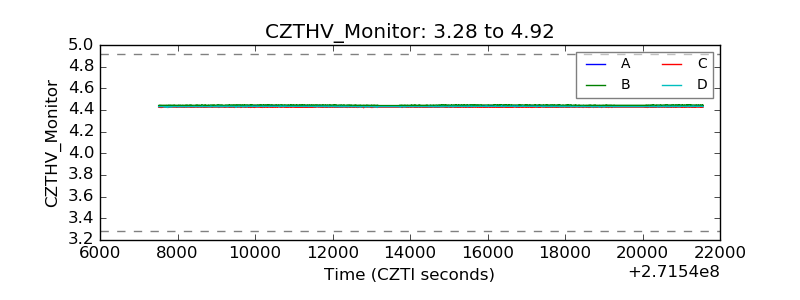 |
| D_VDD | 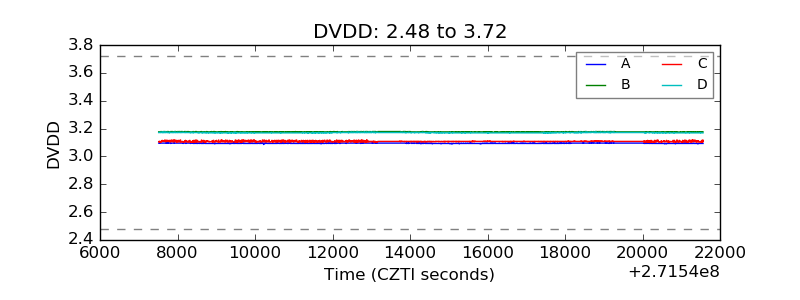 |
| Temperature 1 | 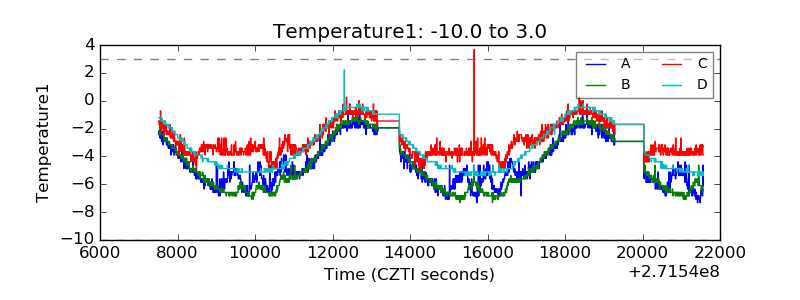 |
| Veto HV Monitor | 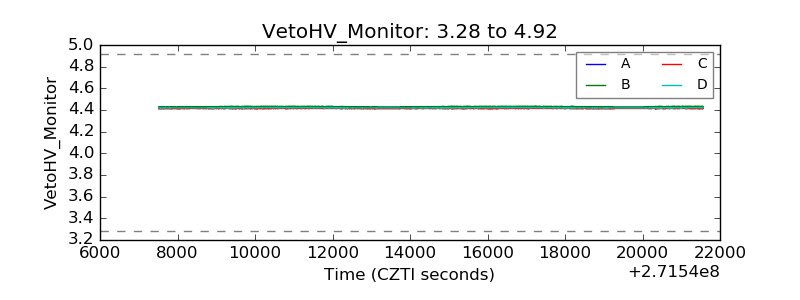 |
| Veto LLD | 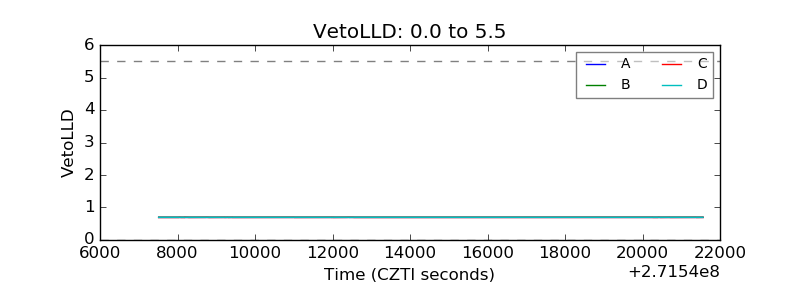 |
| Alpha Counter | 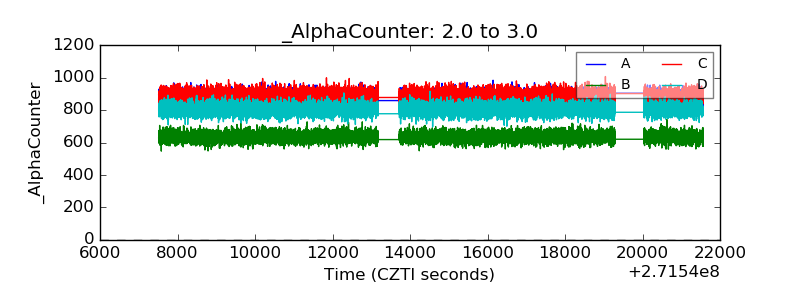 |
| _CPM_Rate | 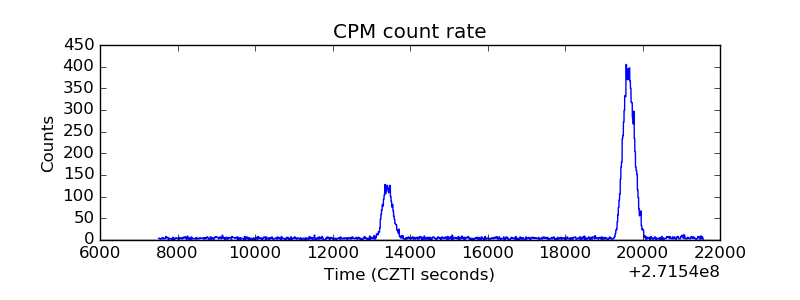 |
| CZT Counter | 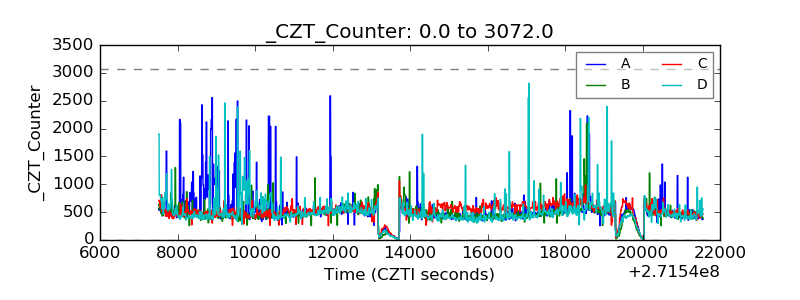 |
| +2.5 Volts monitor |  |
| +5 Volts monitor |  |
| _ROLL_ROT | 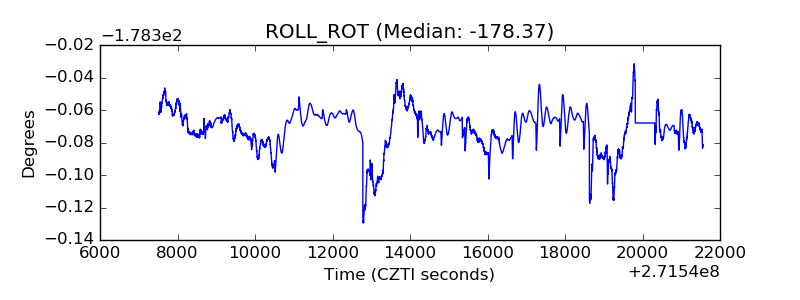 |
| _Roll_DEC | 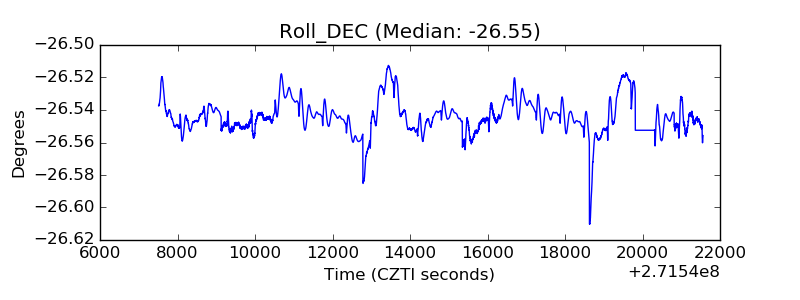 |
| _Roll_RA | 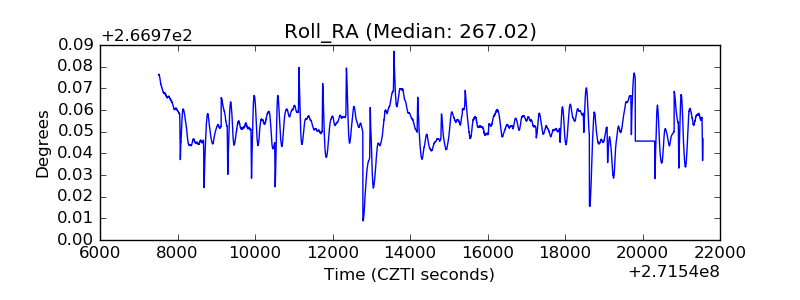 |
| Veto Counter | 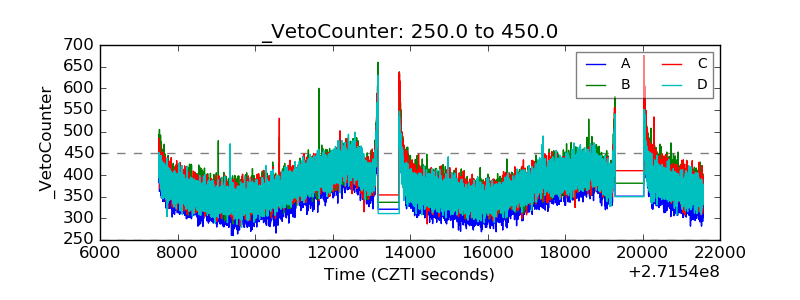 |