| Param | Original file | Final file |
|---|---|---|
| Filename | modeM0/AS1G08_039T01_9000002292_15496cztM0_level2.evt | modeM0/AS1G08_039T01_9000002292_15496cztM0_level2_quad_clean.evt |
| Size (bytes) | 549,432,000 | 91,831,680 |
| Size | 524.0 MB | 87.6 MB |
| Events in quadrant A | 3,994,745 | 569,895 |
| Events in quadrant B | 3,832,335 | 580,567 |
| Events in quadrant C | 3,790,840 | 558,614 |
| Events in quadrant D | 4,507,087 | 544,188 |
| Mode M0 | |||
|---|---|---|---|
| Quadrant | BADHDUFLAG | Total packets | Discarded packets |
| A | 0 | 16748 | 3 |
| B | 0 | 16200 | 2 |
| C | 0 | 15722 | 2 |
| D | 0 | 18511 | 2 |
| Mode M9 | |||
|---|---|---|---|
| Quadrant | BADHDUFLAG | Total packets | Discarded packets |
| A | 0 | 16 | 0 |
| B | 0 | 16 | 0 |
| C | 0 | 16 | 0 |
| D | 0 | 16 | 0 |
| Mode SS | |||
|---|---|---|---|
| Quadrant | BADHDUFLAG | Total packets | Discarded packets |
| A | 0 | 156 | 0 |
| B | 0 | 156 | 0 |
| C | 0 | 156 | 0 |
| D | 0 | 156 | 0 |
| Quadrant | Total seconds | Saturated seconds | Saturation percentage |
|---|---|---|---|
| A | 7583 | 142 | 1.872610% |
| B | 7583 | 54 | 0.712119% |
| C | 7583 | 59 | 0.778056% |
| D | 7583 | 187 | 2.466042% |
Noise dominated data is calculated using 1-second bins in cleaned event files. If a bin has >2000 counts, and if more than 50% of those come from <1% of pixels, then it is considered to be noise-dominated and hence unusable.
| Quadrant | # 1 sec bins | Bins with >0 counts | Bins with >2000 counts | High rate bins dominated by noise | Noise dominated (total time) | Noise dominated (detector-on time) | Marked lightcurve |
|---|---|---|---|---|---|---|---|
| A | 9229 | 7586 | 72 | 72 | 0.78% | 0.95% | 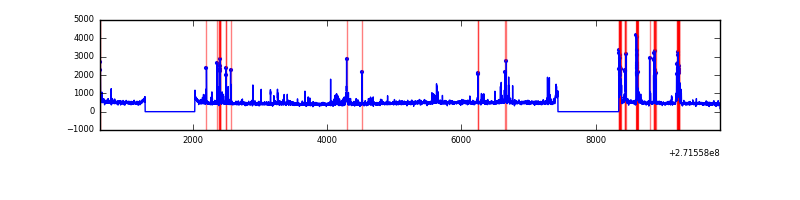 |
| B | 9229 | 7586 | 5 | 5 | 0.05% | 0.07% | 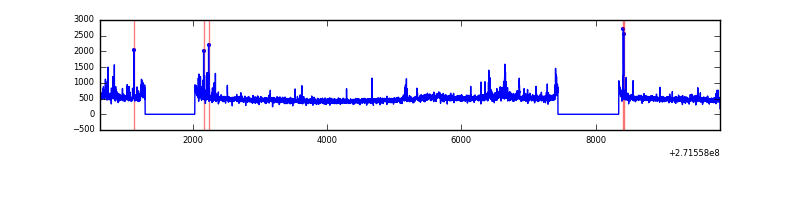 |
| C | 9229 | 7586 | 1 | 1 | 0.01% | 0.01% | 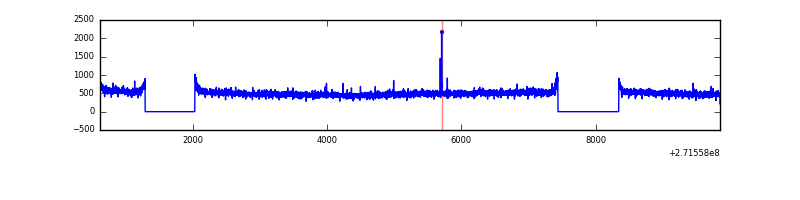 |
| D | 9229 | 7586 | 146 | 146 | 1.58% | 1.92% | 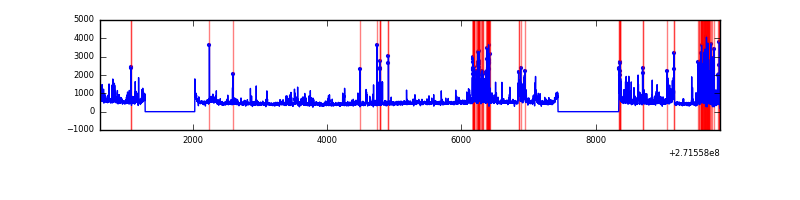 |
Top three noisy pixels from each quadrant. If the there are fewer than three noisy pixels in the level2.evt file, extra rows are filled as -1
| Pixel properties | Quadrant properties | ||||||
|---|---|---|---|---|---|---|---|
| Quadrant | DetID | PixID | Counts | Sigma | Mean | Median | Sigma |
| A | 14 | 238 | 402081 | 2169.25 | 905 | 886 | 184.9 |
| A | 14 | 237 | 51893 | 275.79 | 905 | 886 | 184.9 |
| A | 0 | 253 | 45411 | 240.75 | 905 | 886 | 184.9 |
| B | 4 | 142 | 86492 | 485.03 | 915 | 891 | 176.5 |
| B | 0 | 189 | 59322 | 331.08 | 915 | 891 | 176.5 |
| B | 0 | 229 | 24929 | 136.2 | 915 | 891 | 176.5 |
| C | 3 | 233 | 240229 | 1169.51 | 870 | 876 | 204.7 |
| C | 14 | 238 | 133302 | 647.05 | 870 | 876 | 204.7 |
| C | 10 | 22 | 7908 | 34.36 | 870 | 876 | 204.7 |
| D | 10 | 70 | 292666 | 1367.44 | 873 | 846 | 213.4 |
| D | 5 | 222 | 248740 | 1161.61 | 873 | 846 | 213.4 |
| D | 1 | 52 | 242462 | 1132.19 | 873 | 846 | 213.4 |
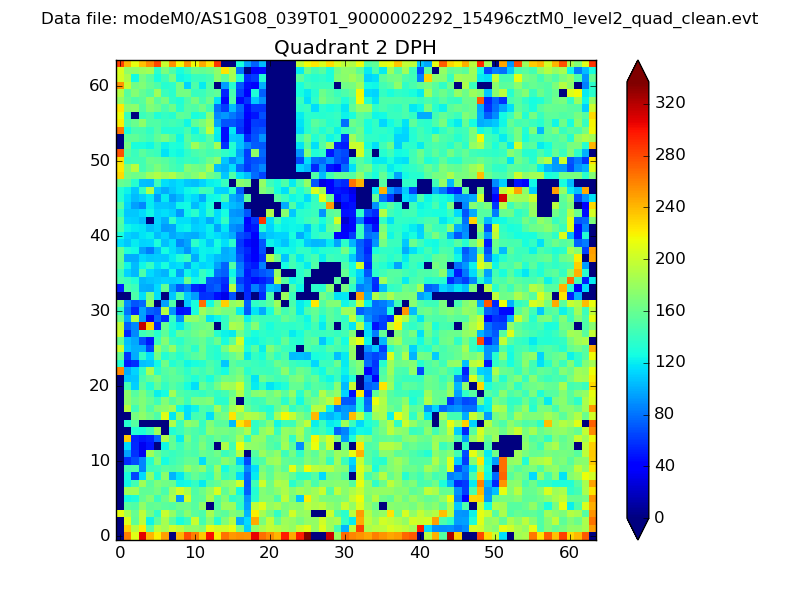
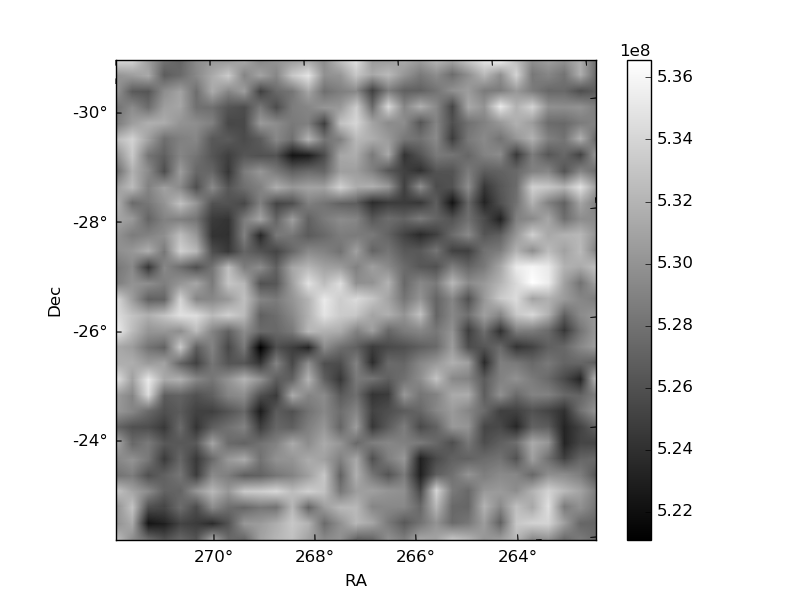
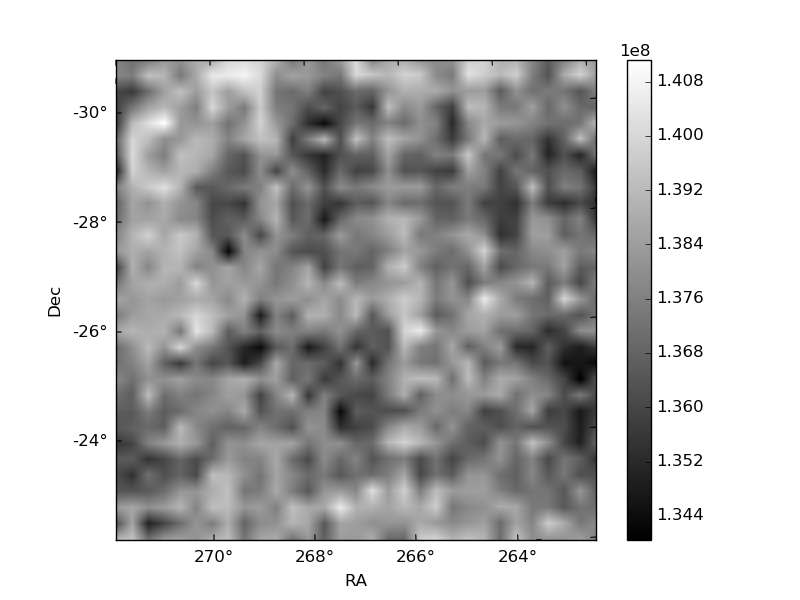
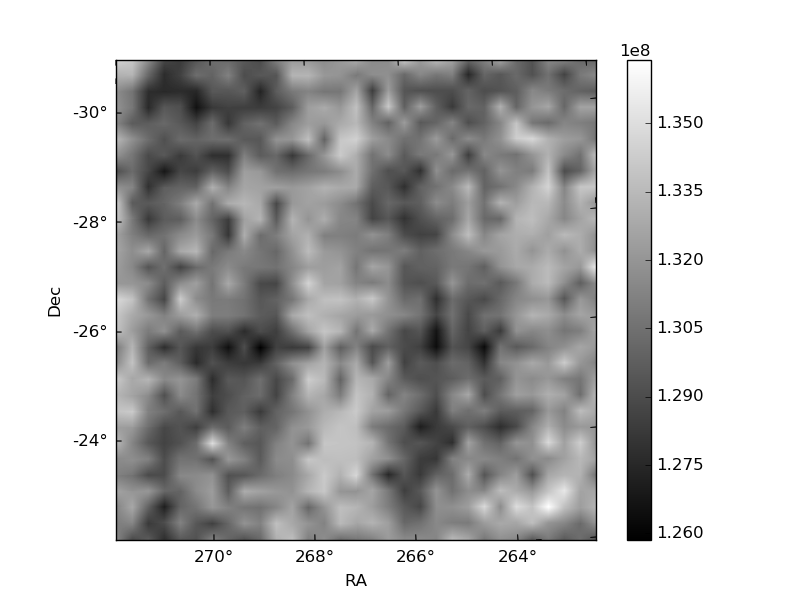
Histogram calculated using DETX and DETY for each event in the final _common_clean file
| Quadrant A | 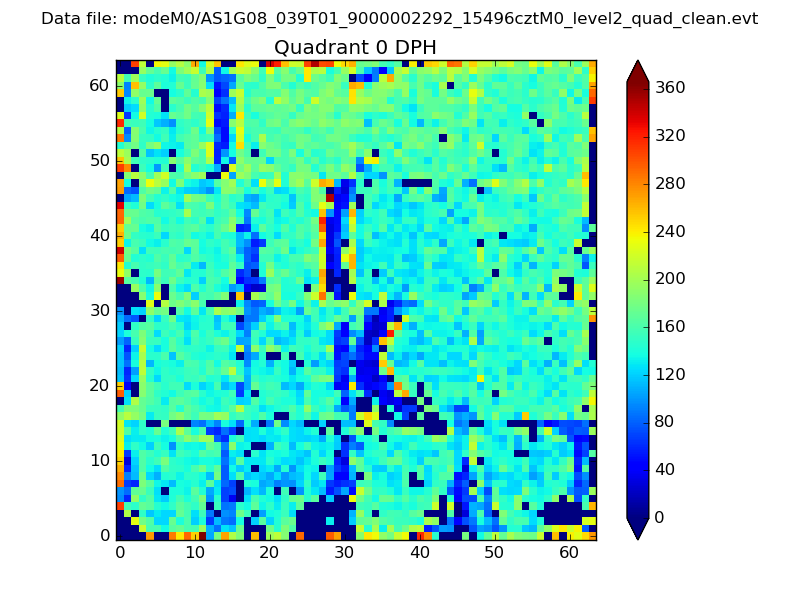 |
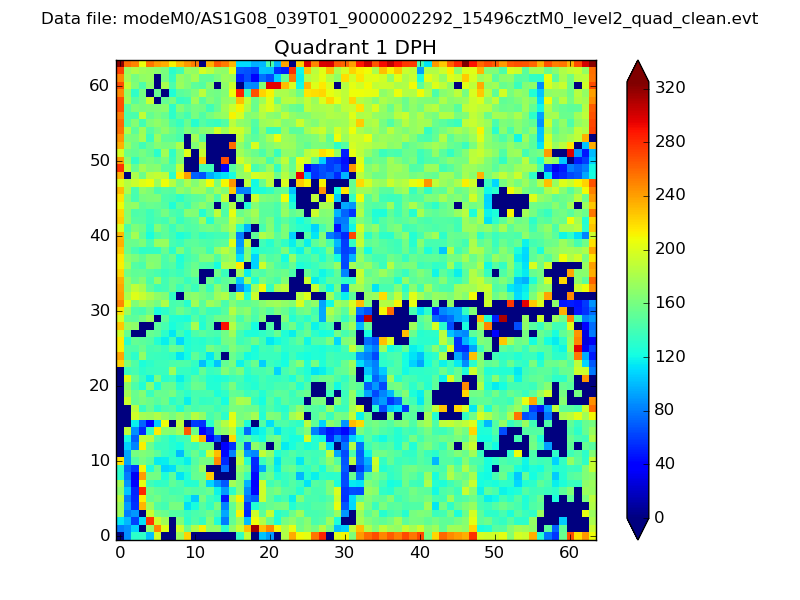 |
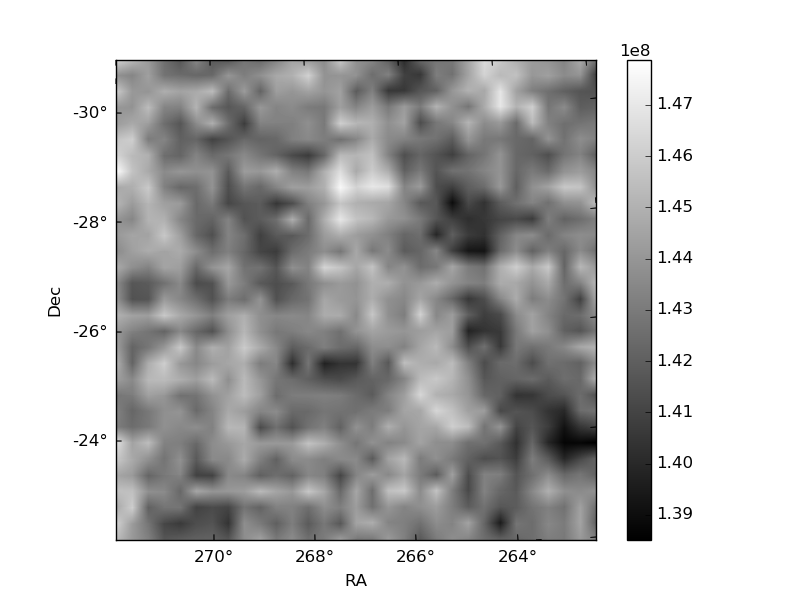
Quadrant B |
|---|---|---|---|
| Quadrant D | 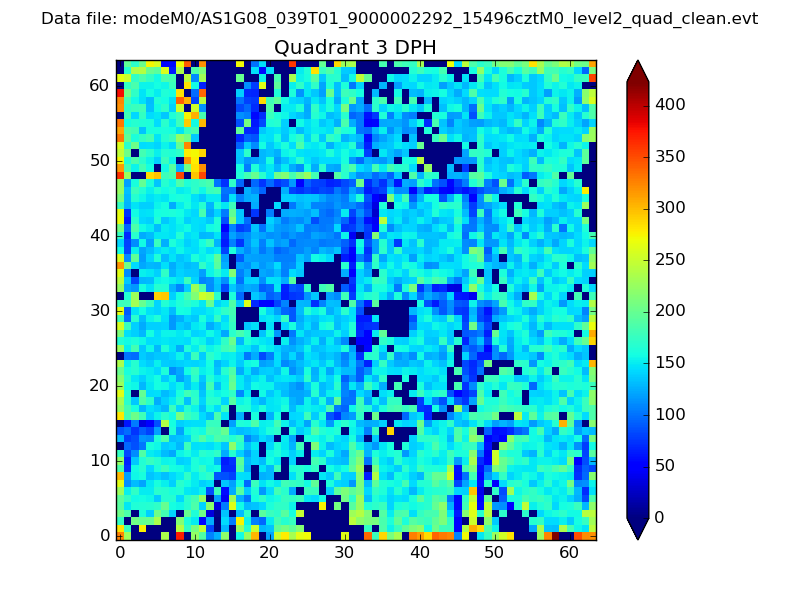 |
 |
Quadrant C |
| Plot type | Count rate plots | Images |
|---|---|---|
| Comparison with Poisson distribution Blue bars denote a histogram of data divided into 1 sec bins. Red curve is a Poisson curve with rate = median count rate of data. |
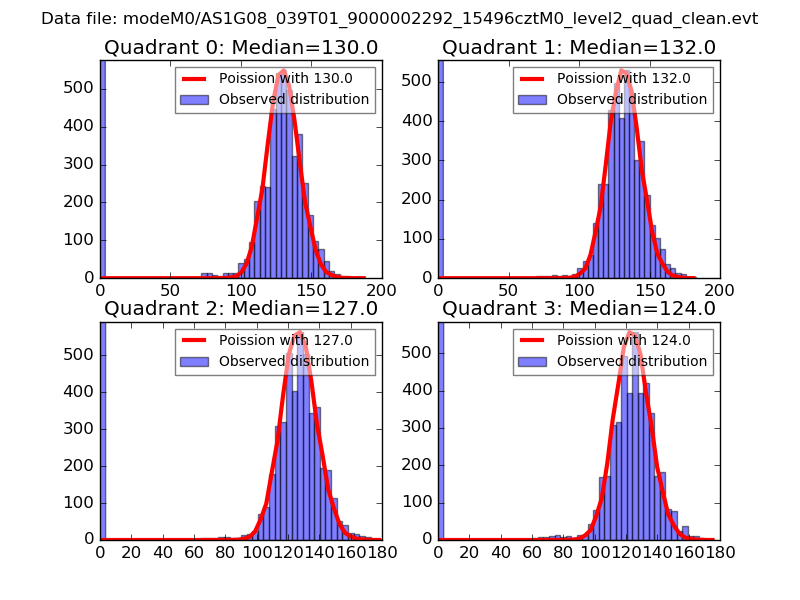 |
 |
| Quadrant-wise count rates Data is divided into 100 sec bins |
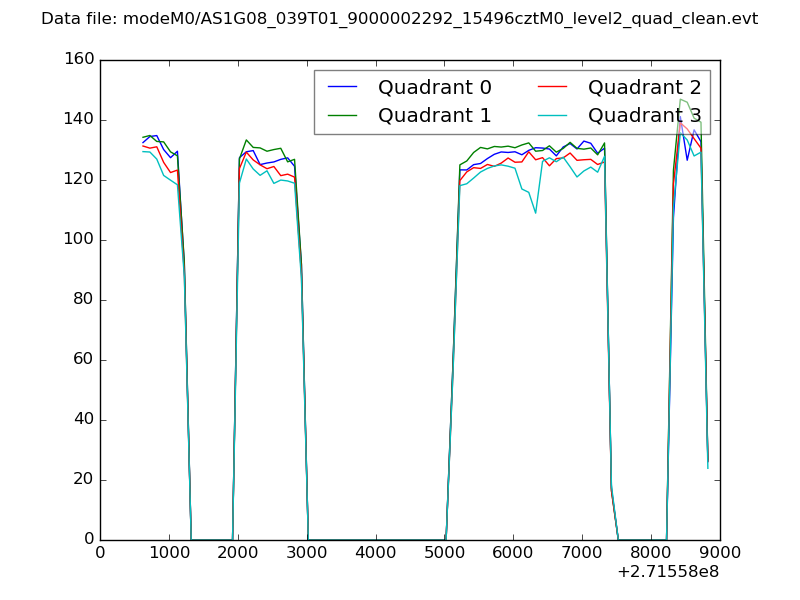 |
|
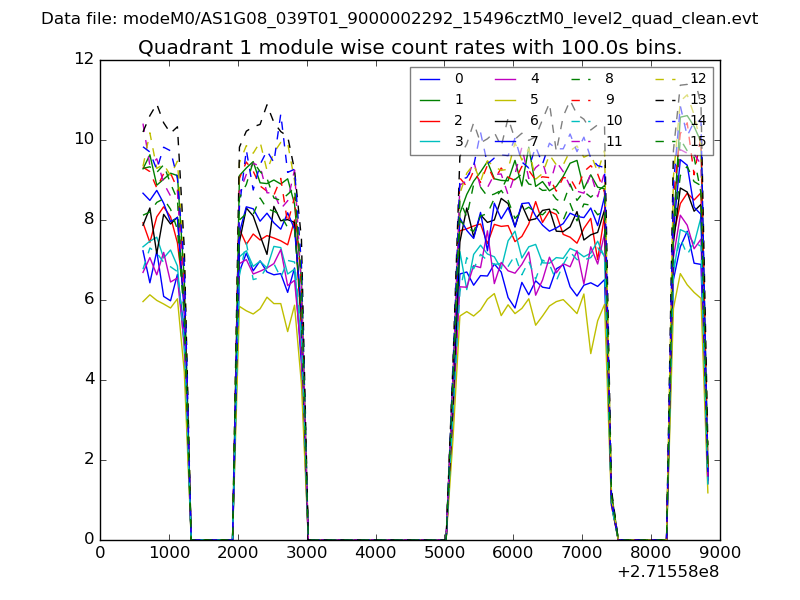
| Module-wise count rates for Quadrant A Data is divided into 100 sec bins |
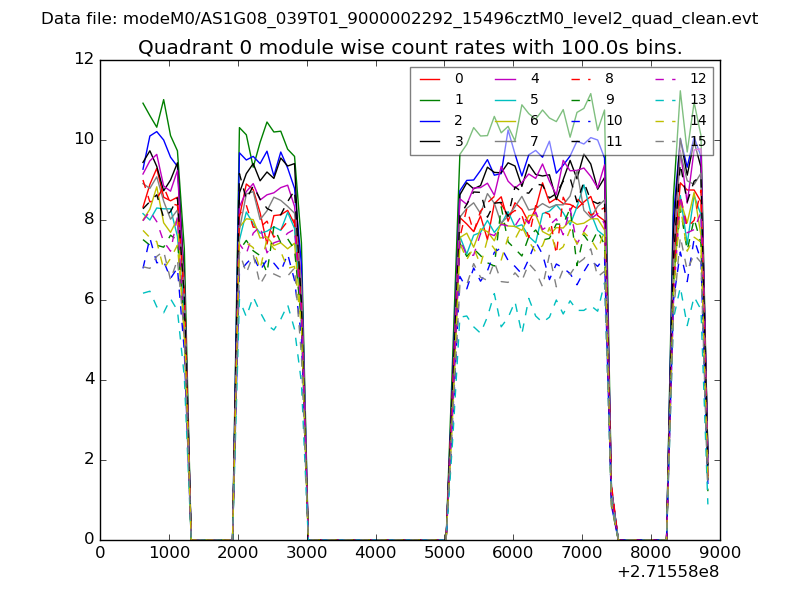 |
 |
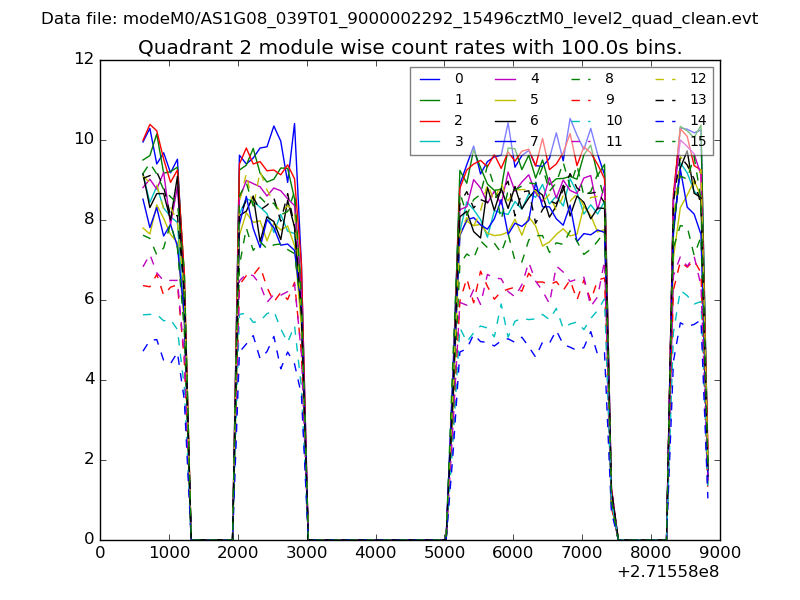
| Module-wise count rates for Quadrant B Data is divided into 100 sec bins |
 |
 |
| Module-wise count rates for Quadrant C Data is divided into 100 sec bins |
 |
 |
| Module-wise count rates for Quadrant D Data is divided into 100 sec bins |
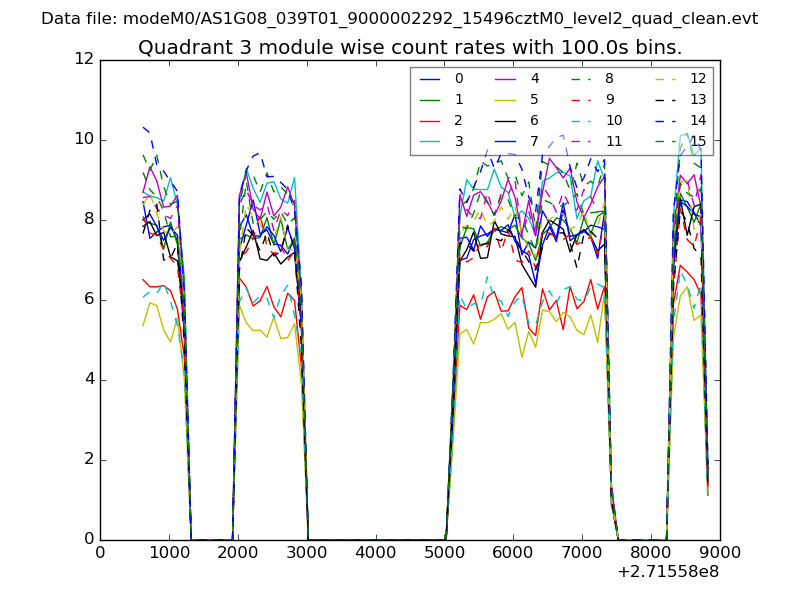 |
 |
| Parameter | Plot |
|---|---|
| CZT HV Monitor | 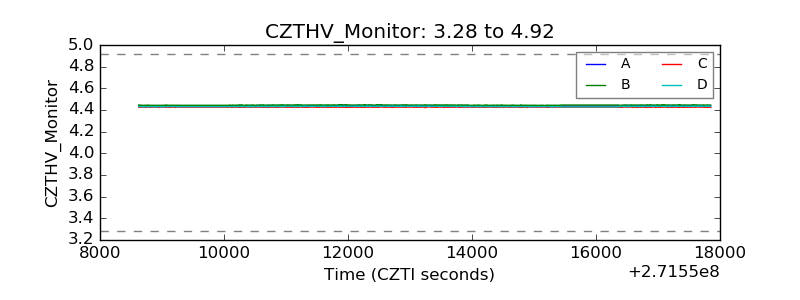 |
| D_VDD | 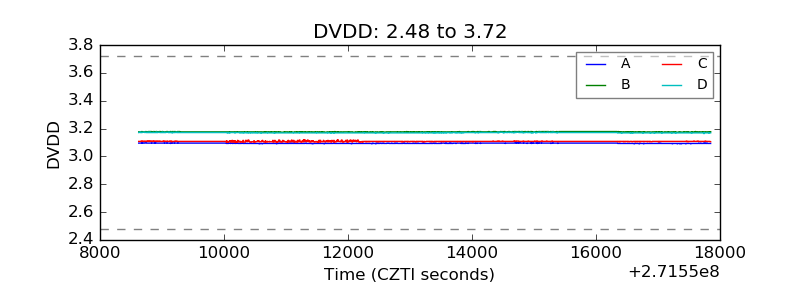 |
| Temperature 1 | 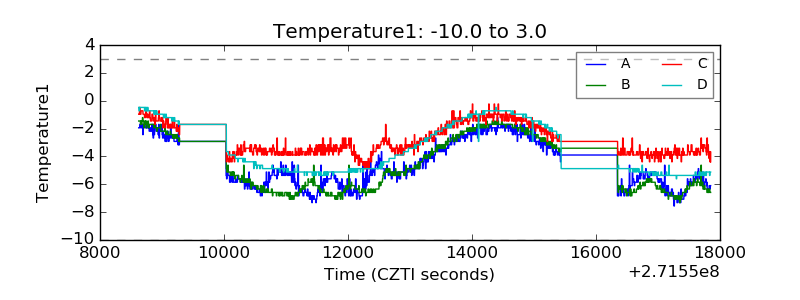 |
| Veto HV Monitor | 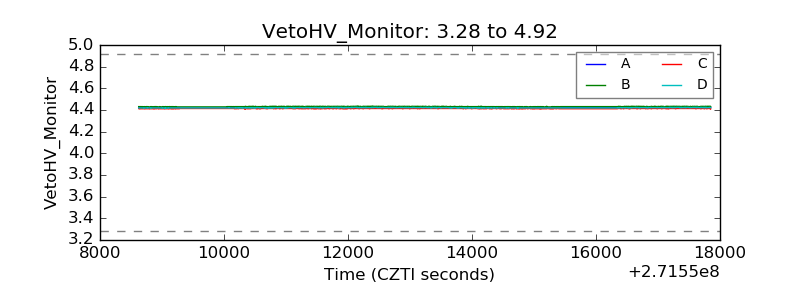 |
| Veto LLD |  |
| Alpha Counter | 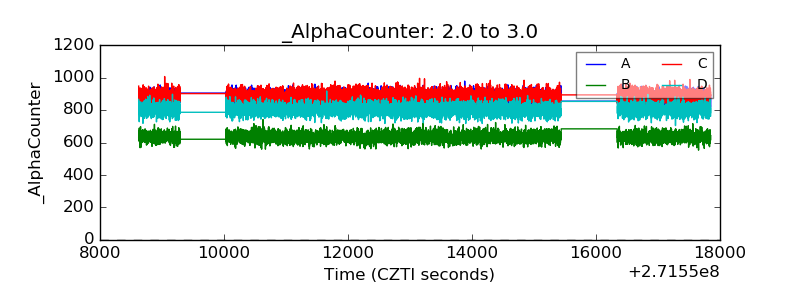 |
| _CPM_Rate | 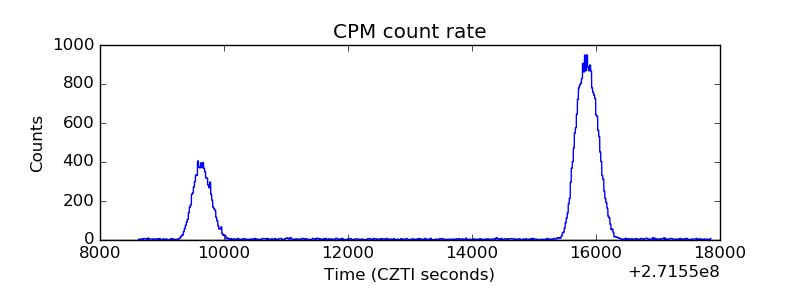 |
| CZT Counter | 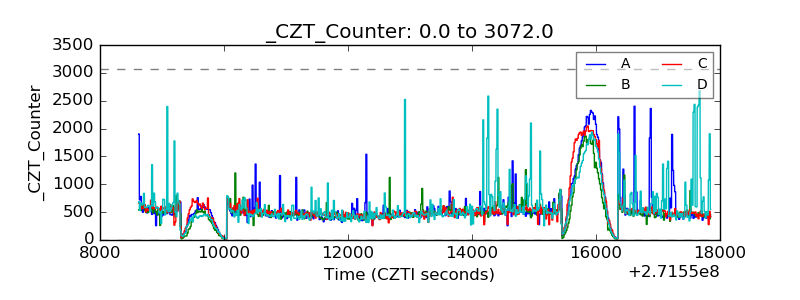 |
| +2.5 Volts monitor |  |
| +5 Volts monitor |  |
| _ROLL_ROT | 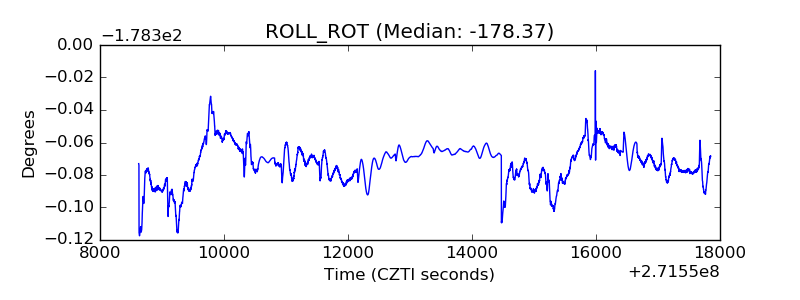 |
| _Roll_DEC | 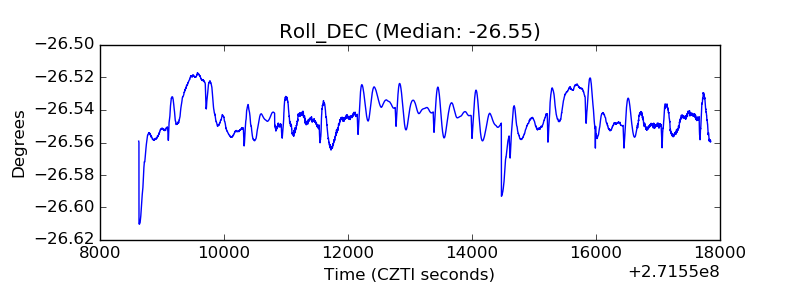 |
| _Roll_RA | 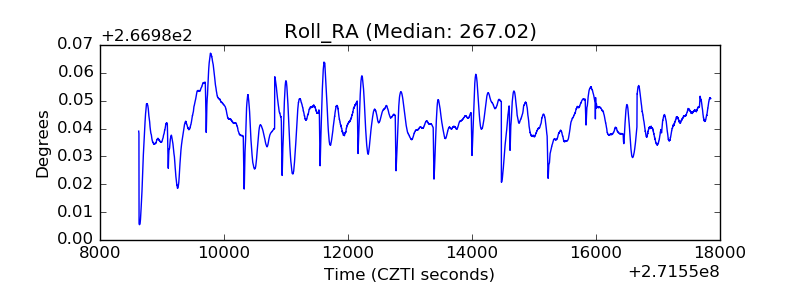 |
| Veto Counter | 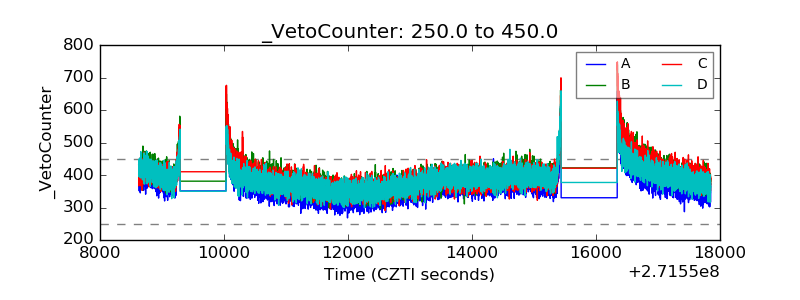 |