| Param | Original file | Final file |
|---|---|---|
| Filename | modeM0/AS1G08_039T01_9000002292_15497cztM0_level2.evt | modeM0/AS1G08_039T01_9000002292_15497cztM0_level2_quad_clean.evt |
| Size (bytes) | 295,456,320 | 37,753,920 |
| Size | 281.8 MB | 36.0 MB |
| Events in quadrant A | 2,076,658 | 218,006 |
| Events in quadrant B | 2,391,610 | 220,871 |
| Events in quadrant C | 1,901,162 | 217,468 |
| Events in quadrant D | 2,313,423 | 212,321 |
| Mode M0 | |||
|---|---|---|---|
| Quadrant | BADHDUFLAG | Total packets | Discarded packets |
| A | 0 | 8754 | 1 |
| B | 0 | 9533 | 1 |
| C | 0 | 7940 | 1 |
| D | 0 | 9536 | 1 |
| Mode M9 | |||
|---|---|---|---|
| Quadrant | BADHDUFLAG | Total packets | Discarded packets |
| A | 0 | 9 | 0 |
| B | 0 | 9 | 0 |
| C | 0 | 9 | 0 |
| D | 0 | 9 | 0 |
| Mode SS | |||
|---|---|---|---|
| Quadrant | BADHDUFLAG | Total packets | Discarded packets |
| A | 0 | 80 | 0 |
| B | 0 | 80 | 0 |
| C | 0 | 80 | 0 |
| D | 0 | 80 | 0 |
| Quadrant | Total seconds | Saturated seconds | Saturation percentage |
|---|---|---|---|
| A | 3880 | 119 | 3.067010% |
| B | 3880 | 173 | 4.458763% |
| C | 3880 | 35 | 0.902062% |
| D | 3880 | 128 | 3.298969% |
Noise dominated data is calculated using 1-second bins in cleaned event files. If a bin has >2000 counts, and if more than 50% of those come from <1% of pixels, then it is considered to be noise-dominated and hence unusable.
| Quadrant | # 1 sec bins | Bins with >0 counts | Bins with >2000 counts | High rate bins dominated by noise | Noise dominated (total time) | Noise dominated (detector-on time) | Marked lightcurve |
|---|---|---|---|---|---|---|---|
| A | 4786 | 3882 | 61 | 61 | 1.27% | 1.57% | 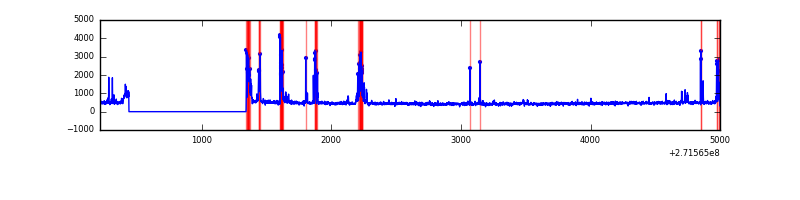 |
| B | 4786 | 3882 | 117 | 117 | 2.44% | 3.01% | 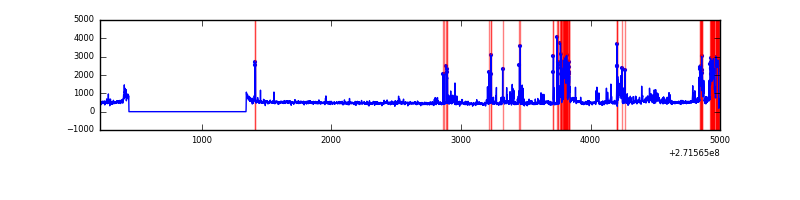 |
| C | 4786 | 3882 | 0 | 0 | 0.00% | 0.00% | 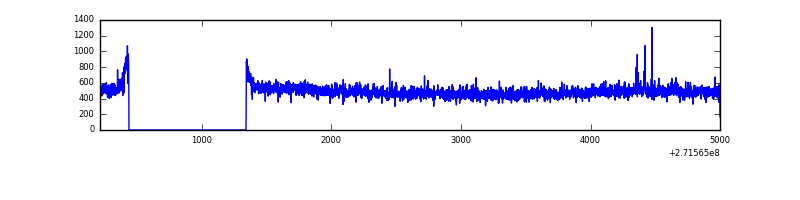 |
| D | 4786 | 3882 | 94 | 94 | 1.96% | 2.42% | 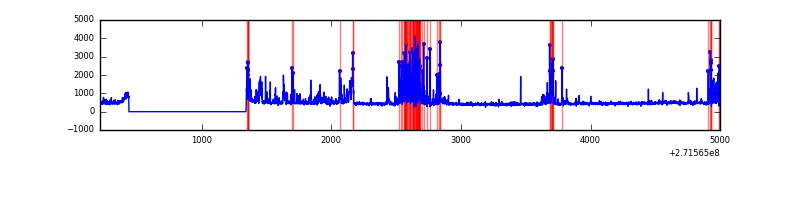 |
Top three noisy pixels from each quadrant. If the there are fewer than three noisy pixels in the level2.evt file, extra rows are filled as -1
| Pixel properties | Quadrant properties | ||||||
|---|---|---|---|---|---|---|---|
| Quadrant | DetID | PixID | Counts | Sigma | Mean | Median | Sigma |
| A | 14 | 238 | 291004 | 3095.77 | 455 | 446 | 93.9 |
| A | 14 | 237 | 23923 | 250.14 | 455 | 446 | 93.9 |
| A | 0 | 253 | 6986 | 69.68 | 455 | 446 | 93.9 |
| B | 10 | 245 | 551908 | 6242.38 | 455 | 444 | 88.3 |
| B | 0 | 189 | 23072 | 256.14 | 455 | 444 | 88.3 |
| B | 0 | 244 | 10762 | 116.8 | 455 | 444 | 88.3 |
| C | 3 | 233 | 91641 | 868.89 | 443 | 445 | 105.0 |
| C | 14 | 238 | 68815 | 651.41 | 443 | 445 | 105.0 |
| C | 10 | 22 | 6005 | 52.97 | 443 | 445 | 105.0 |
| D | 10 | 70 | 287364 | 2630.78 | 443 | 430 | 109.1 |
| D | 7 | 223 | 169521 | 1550.33 | 443 | 430 | 109.1 |
| D | 1 | 52 | 153684 | 1405.12 | 443 | 430 | 109.1 |
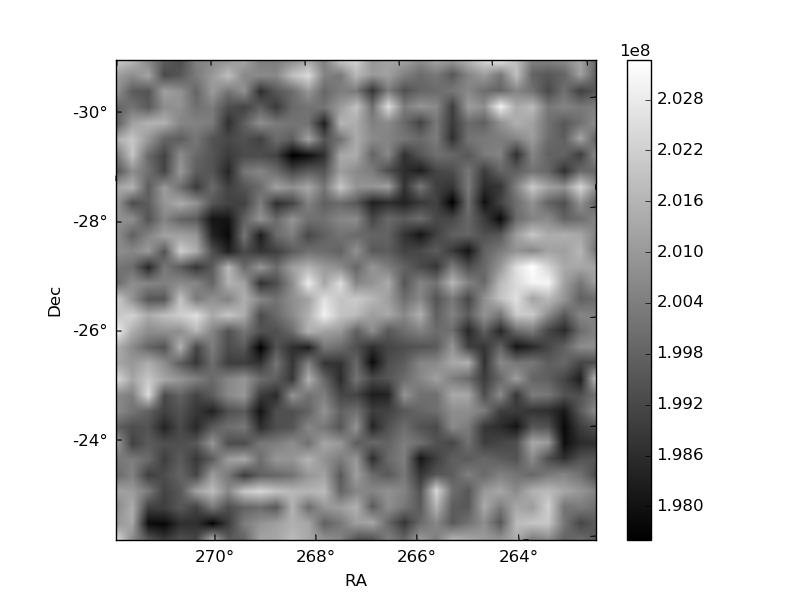
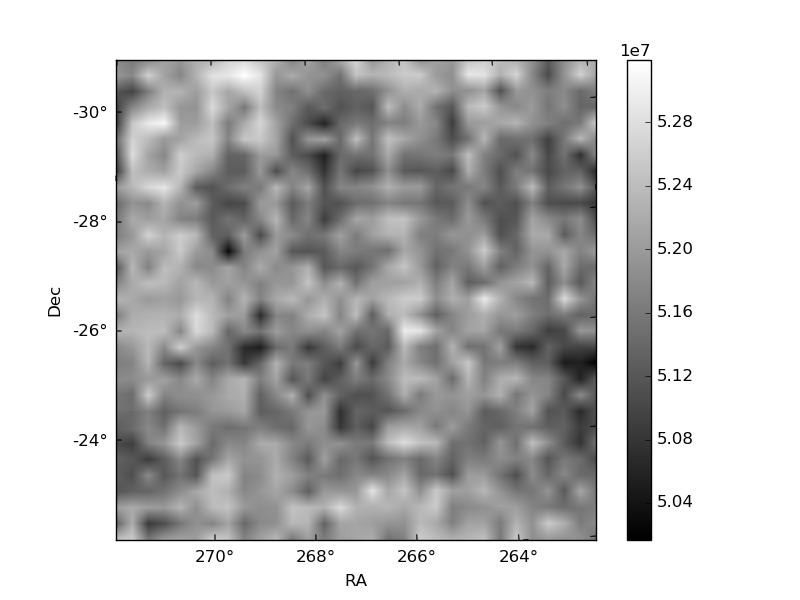
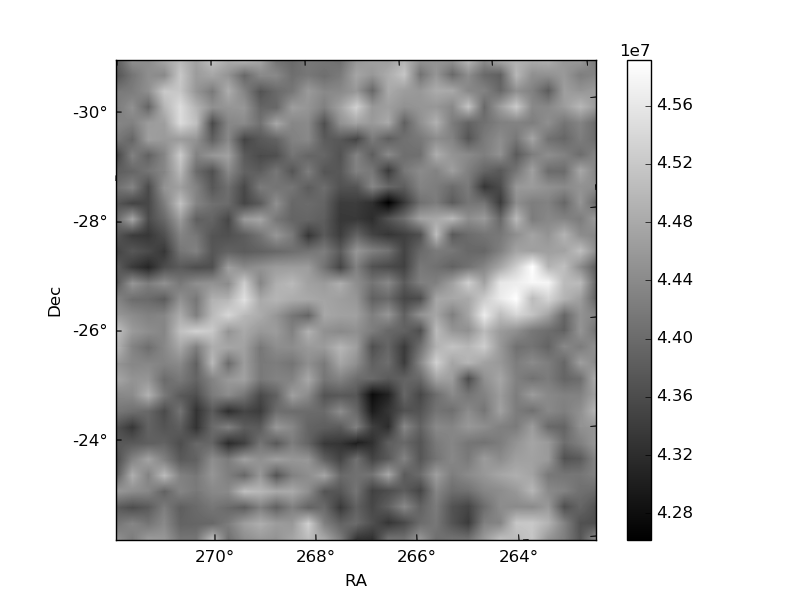
Histogram calculated using DETX and DETY for each event in the final _common_clean file
| Quadrant A | 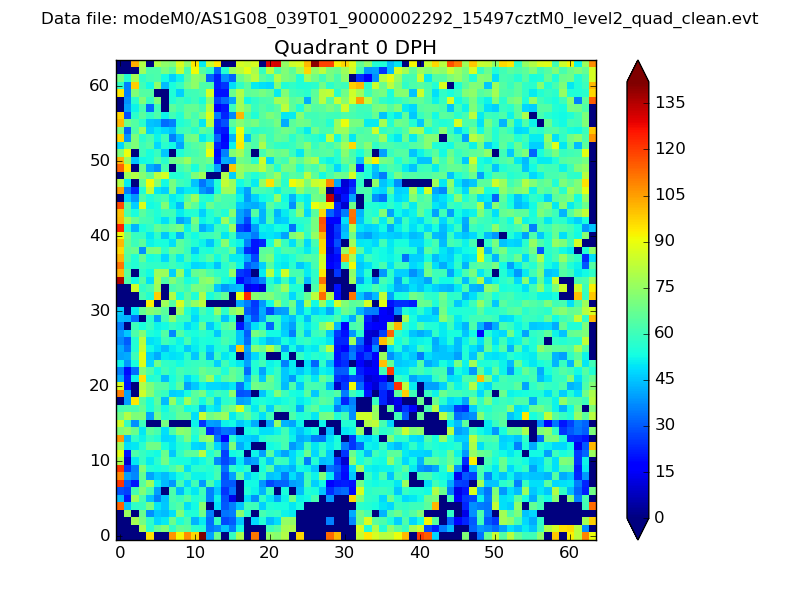 |
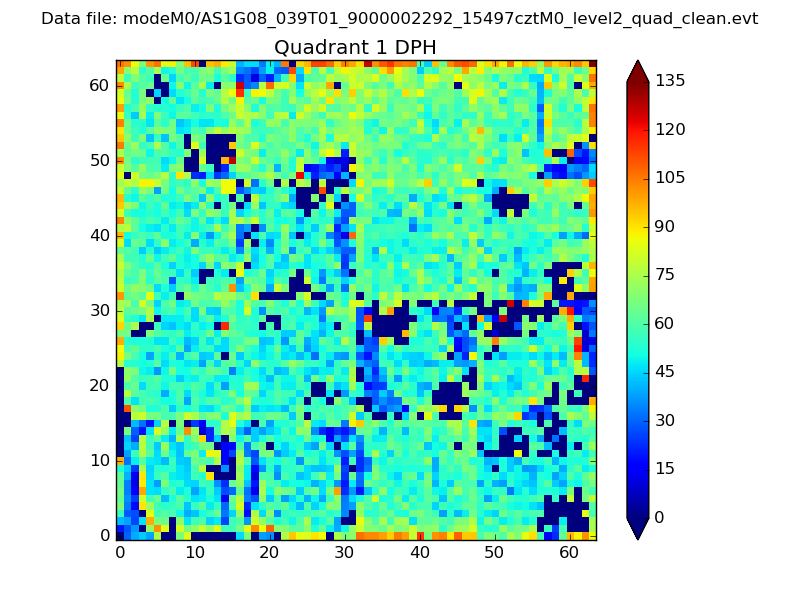 |
Quadrant B |
|---|---|---|---|
| Quadrant D | 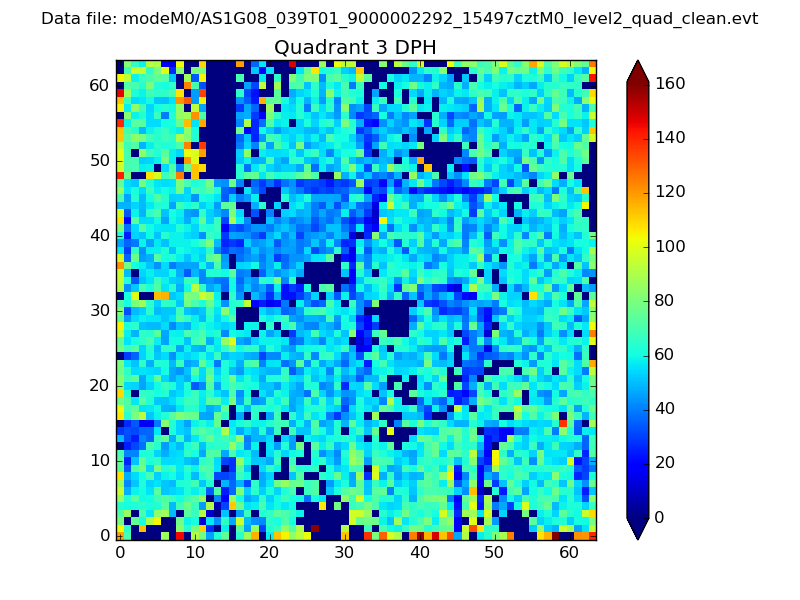 |
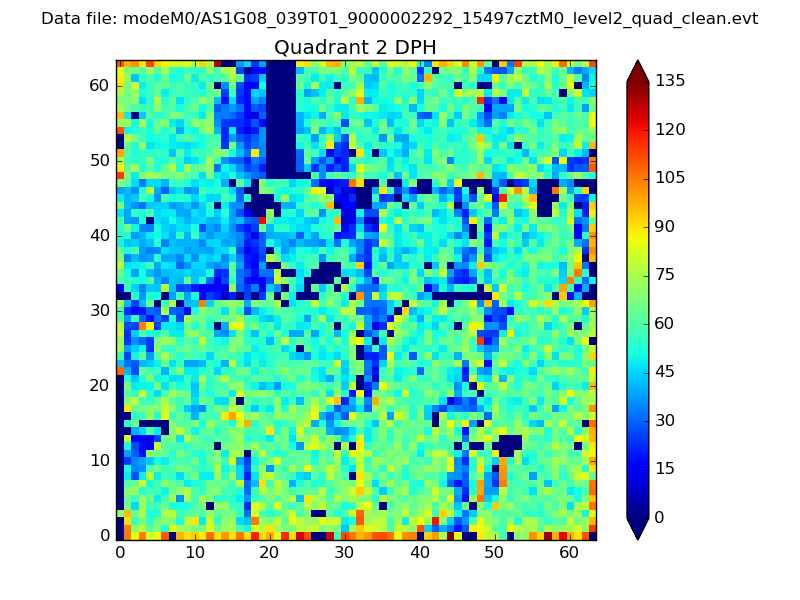 |
Quadrant C |
| Plot type | Count rate plots | Images |
|---|---|---|
| Comparison with Poisson distribution Blue bars denote a histogram of data divided into 1 sec bins. Red curve is a Poisson curve with rate = median count rate of data. |
 |
 |
| Quadrant-wise count rates Data is divided into 100 sec bins |
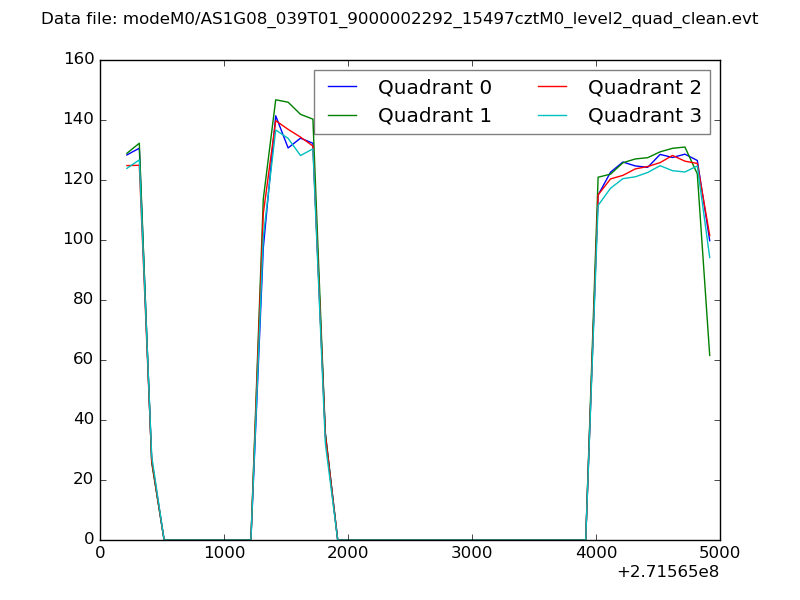 |
|
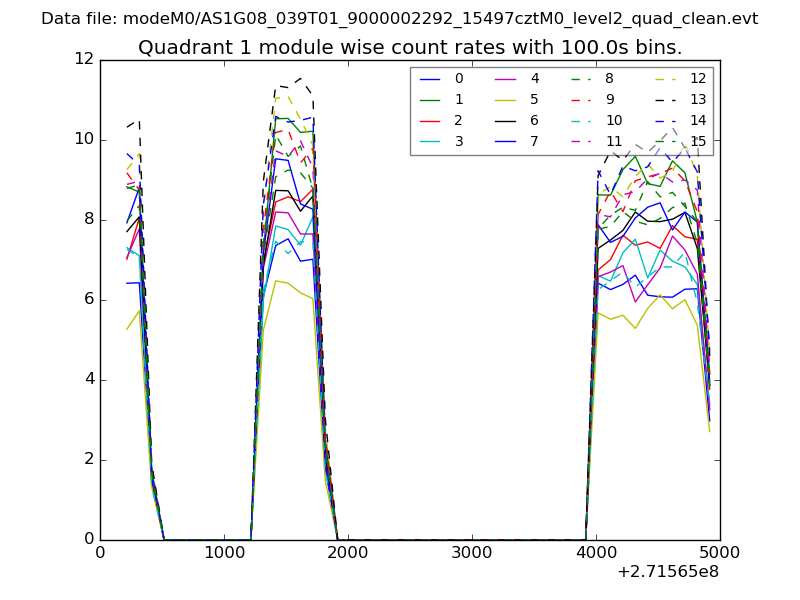
| Module-wise count rates for Quadrant A Data is divided into 100 sec bins |
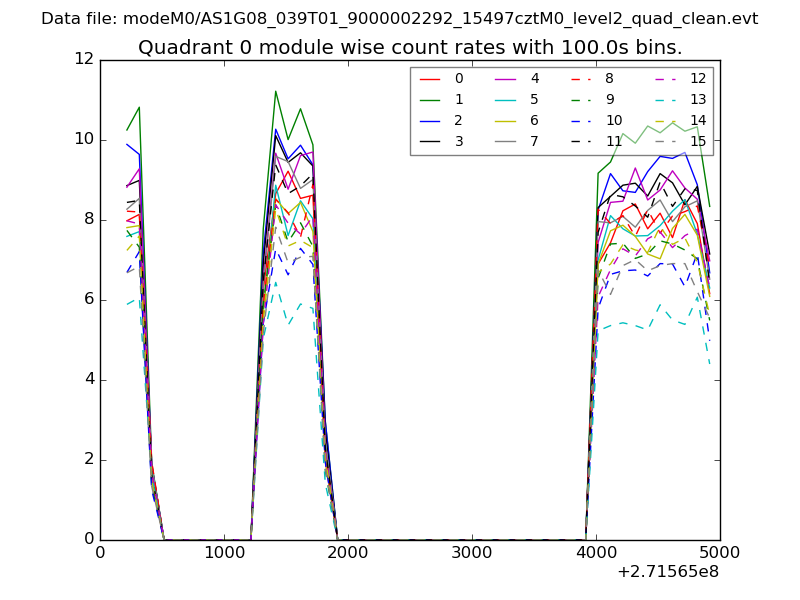 |
 |
| Module-wise count rates for Quadrant B Data is divided into 100 sec bins |
 |
 |
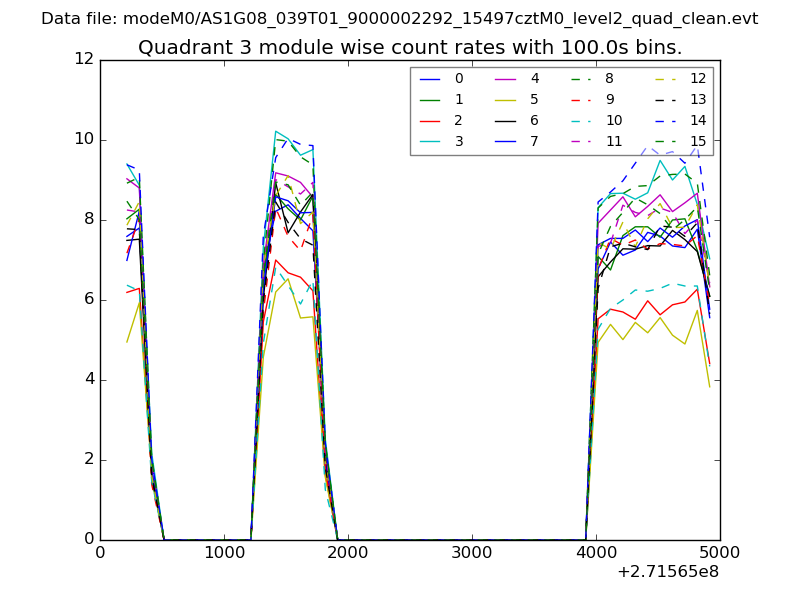
| Module-wise count rates for Quadrant C Data is divided into 100 sec bins |
 |
 |
| Module-wise count rates for Quadrant D Data is divided into 100 sec bins |
 |
 |
| Parameter | Plot |
|---|---|
| CZT HV Monitor | 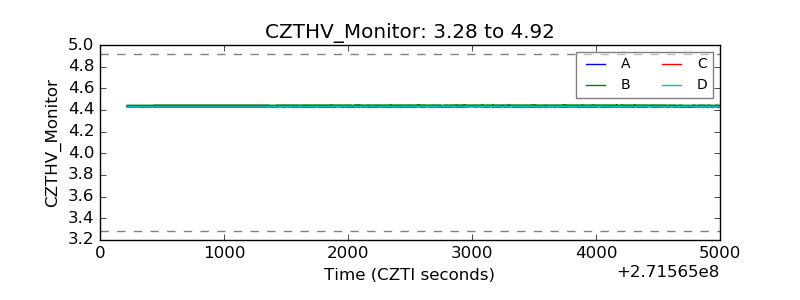 |
| D_VDD | 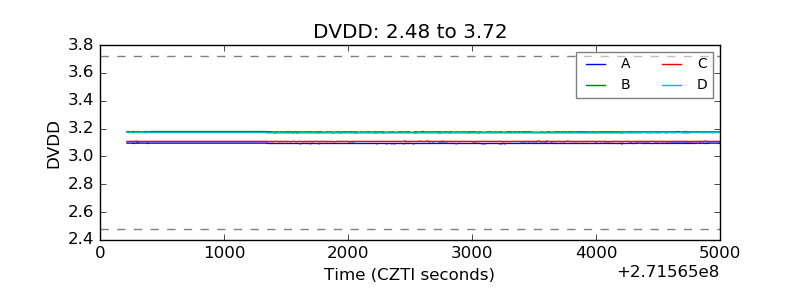 |
| Temperature 1 | 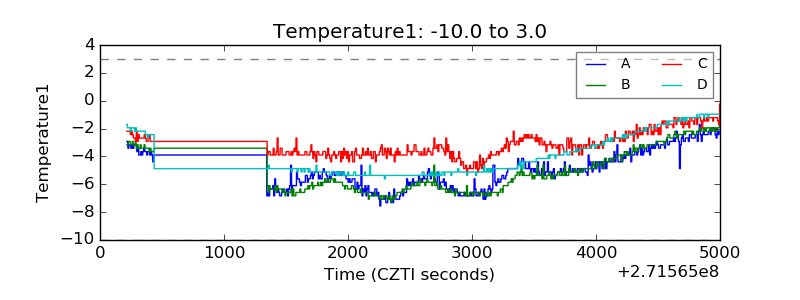 |
| Veto HV Monitor | 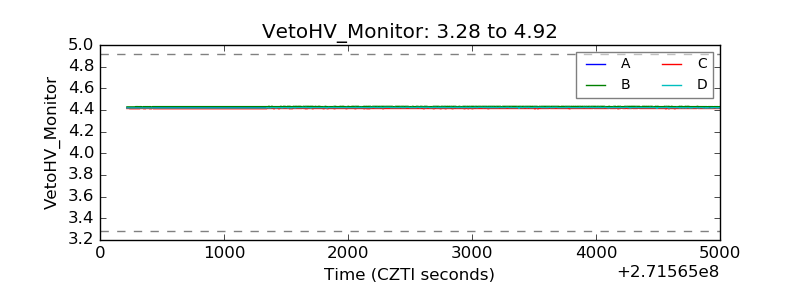 |
| Veto LLD | 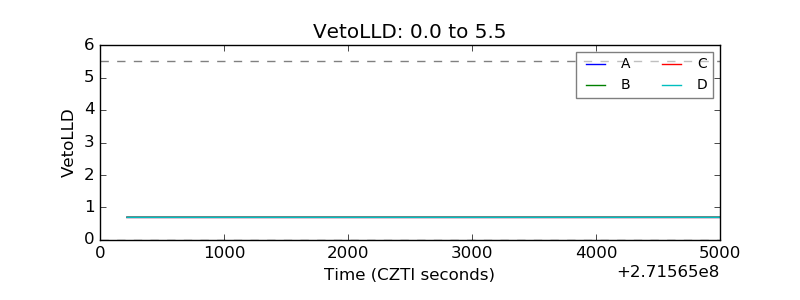 |
| Alpha Counter | 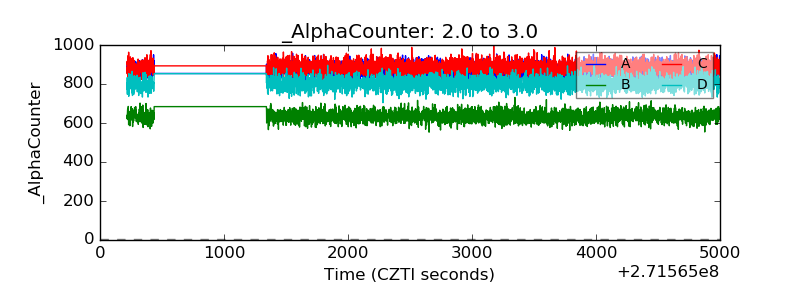 |
| _CPM_Rate | 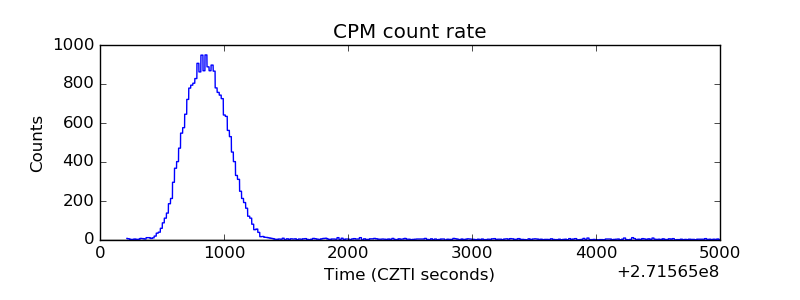 |
| CZT Counter | 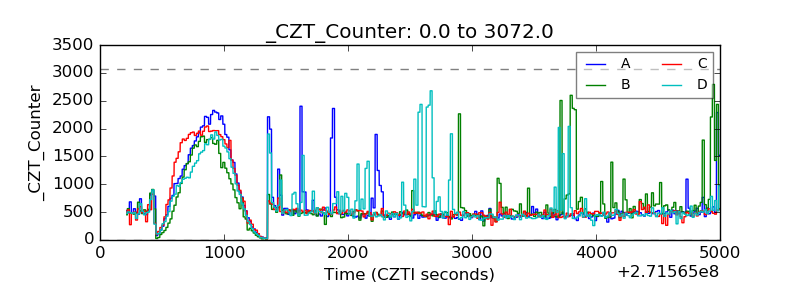 |
| +2.5 Volts monitor |  |
| +5 Volts monitor |  |
| _ROLL_ROT | 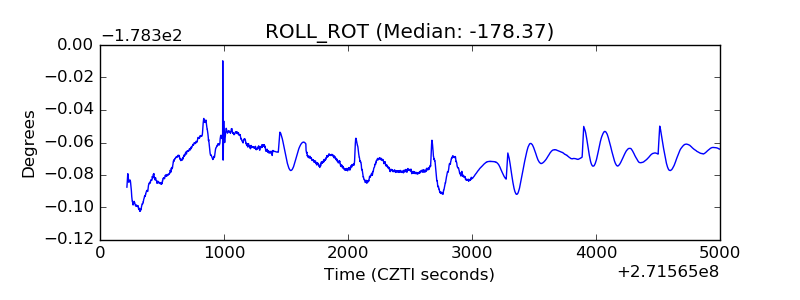 |
| _Roll_DEC | 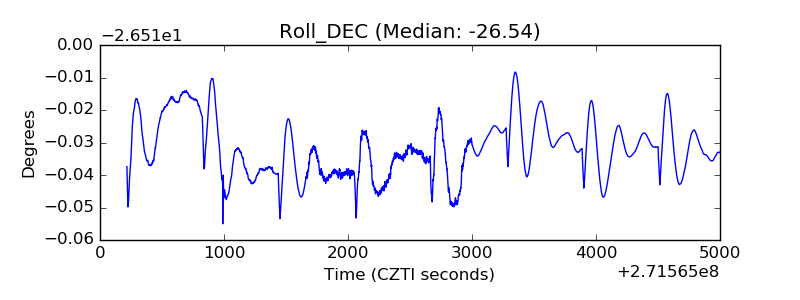 |
| _Roll_RA | 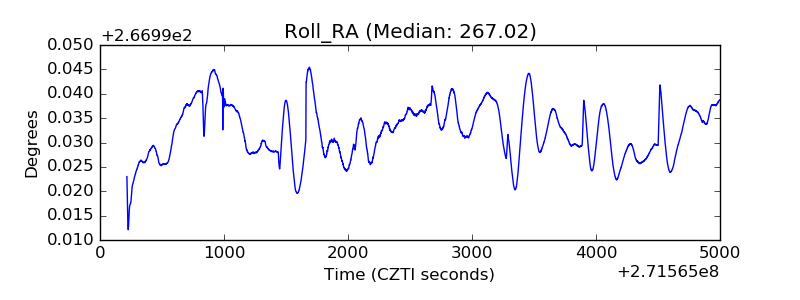 |
| Veto Counter | 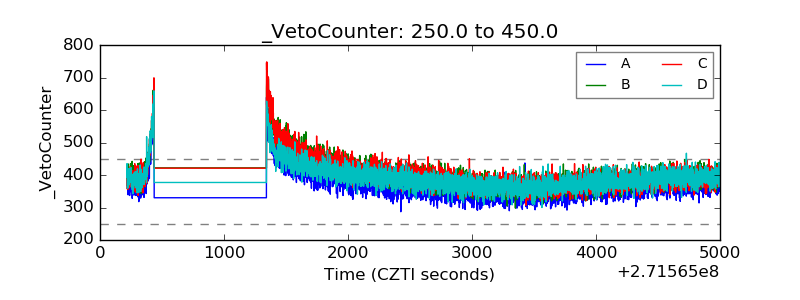 |