| Param | Original file | Final file |
|---|---|---|
| Filename | modeM0/AS1G08_043T01_9000002288cztM0_level2.fits | modeM0/AS1G08_043T01_9000002288cztM0_level2_quad_clean.evt |
| Size (bytes) | 268,842,240 | 237,556,800 |
| Size | 256.4 MB | 226.6 MB |
| Events in quadrant A | 1,703,698 | 1,427,604 |
| Events in quadrant B | 1,607,126 | 1,401,289 |
| Events in quadrant C | 1,641,094 | 1,369,920 |
| Events in quadrant D | 1,439,174 | 1,243,760 |
| Mode SS | |||
|---|---|---|---|
| Quadrant | BADHDUFLAG | Total packets | Discarded packets |
| A | 0 | 518 | 0 |
| B | 0 | 518 | 0 |
| C | 0 | 518 | 0 |
| D | 0 | 518 | 0 |
| Mode M9 | |||
|---|---|---|---|
| Quadrant | BADHDUFLAG | Total packets | Discarded packets |
| A | 0 | 62 | 0 |
| B | 0 | 62 | 0 |
| C | 0 | 62 | 0 |
| D | 0 | 62 | 0 |
| Mode M0 | |||
|---|---|---|---|
| Quadrant | BADHDUFLAG | Total packets | Discarded packets |
| A | 0 | 54299 | 0 |
| B | 0 | 58368 | 0 |
| C | 0 | 54992 | 0 |
| D | 0 | 62256 | 0 |
| Quadrant | Total seconds | Saturated seconds | Saturation percentage |
|---|---|---|---|
| A | 25455 | 361 | 1.418189% |
| B | 25455 | 452 | 1.775683% |
| C | 25455 | 476 | 1.869967% |
| D | 25455 | 810 | 3.182086% |
Noise dominated data is calculated using 1-second bins in cleaned event files. If a bin has >2000 counts, and if more than 50% of those come from <1% of pixels, then it is considered to be noise-dominated and hence unusable.
| Quadrant | # 1 sec bins | Bins with >0 counts | Bins with >2000 counts | High rate bins dominated by noise | Noise dominated (total time) | Noise dominated (detector-on time) | Marked lightcurve |
|---|---|---|---|---|---|---|---|
| A | 31665 | 25451 | 0 | 0 | 0.00% | 0.00% |  |
| B | 31665 | 25452 | 0 | 0 | 0.00% | 0.00% |  |
| C | 31665 | 25452 | 0 | 0 | 0.00% | 0.00% |  |
| D | 31665 | 25441 | 0 | 0 | 0.00% | 0.00% |  |
Top three noisy pixels from each quadrant. If the there are fewer than three noisy pixels in the level2.evt file, extra rows are filled as -1
| Pixel properties | Quadrant properties | ||||||
|---|---|---|---|---|---|---|---|
| Quadrant | DetID | PixID | Counts | Sigma | Mean | Median | Sigma |
| A | 0 | 29 | 1607 | 10.87 | 444 | 422 | 109.0 |
| A | 7 | 110 | 1310 | 8.15 | 444 | 422 | 109.0 |
| A | 0 | 30 | 1271 | 7.79 | 444 | 422 | 109.0 |
| B | 2 | 9 | 1221 | 9.64 | 426 | 411 | 84.0 |
| B | 14 | 254 | 1093 | 8.12 | 426 | 411 | 84.0 |
| B | 3 | 80 | 1061 | 7.73 | 426 | 411 | 84.0 |
| C | 1 | 80 | 1303 | 8.05 | 433 | 409 | 111.1 |
| C | 1 | 81 | 1259 | 7.65 | 433 | 409 | 111.1 |
| C | 3 | 126 | 1177 | 6.91 | 433 | 409 | 111.1 |
| D | 6 | 231 | 1091 | 6.41 | 412 | 378 | 111.3 |
| D | 6 | 67 | 1026 | 5.82 | 412 | 378 | 111.3 |
| D | 10 | 189 | 1001 | 5.6 | 412 | 378 | 111.3 |
Histogram calculated using DETX and DETY for each event in the final _common_clean file
| Quadrant A |  |
 |
Quadrant B |
|---|---|---|---|
| Quadrant D |  |
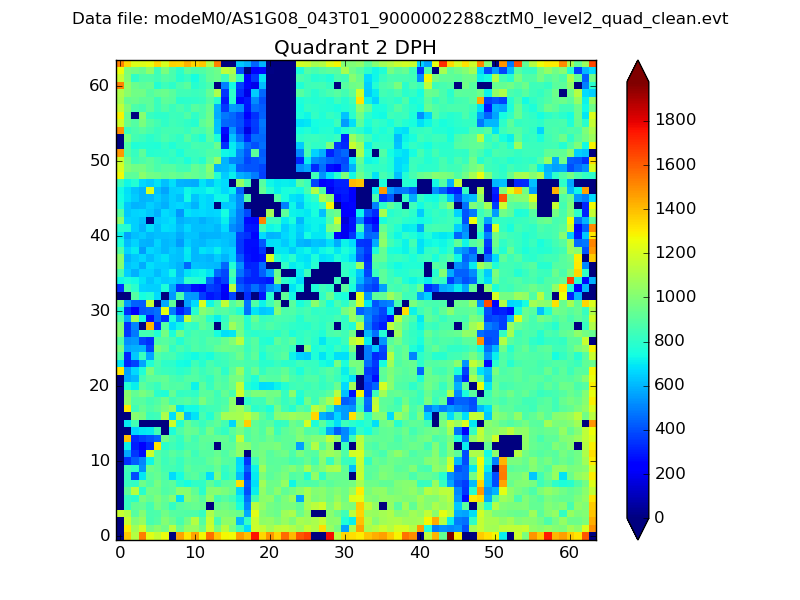 |
Quadrant C |
| Plot type | Count rate plots | Images |
|---|---|---|
| Comparison with Poisson distribution Blue bars denote a histogram of data divided into 1 sec bins. Red curve is a Poisson curve with rate = median count rate of data. |
 |
 |
| Quadrant-wise count rates Data is divided into 100 sec bins |
 |
|
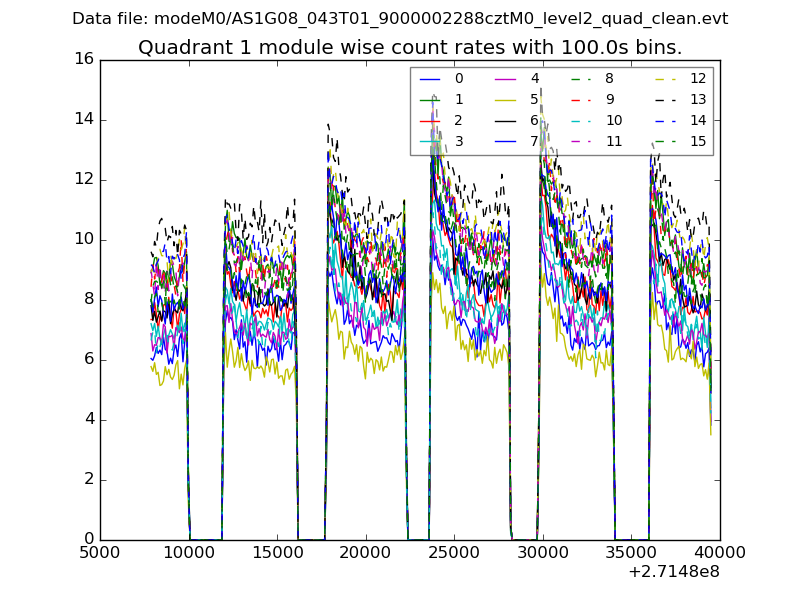
| Module-wise count rates for Quadrant A Data is divided into 100 sec bins |
 |
 |
| Module-wise count rates for Quadrant B Data is divided into 100 sec bins |
 |
 |
| Module-wise count rates for Quadrant C Data is divided into 100 sec bins |
 |
 |
| Module-wise count rates for Quadrant D Data is divided into 100 sec bins |
 |
 |
| Parameter | Plot |
|---|---|
| CZT HV Monitor |  |
| D_VDD |  |
| Temperature 1 |  |
| Veto HV Monitor |  |
| Veto LLD |  |
| Alpha Counter |  |
| _CPM_Rate |  |
| CZT Counter |  |
| +2.5 Volts monitor |  |
| +5 Volts monitor | 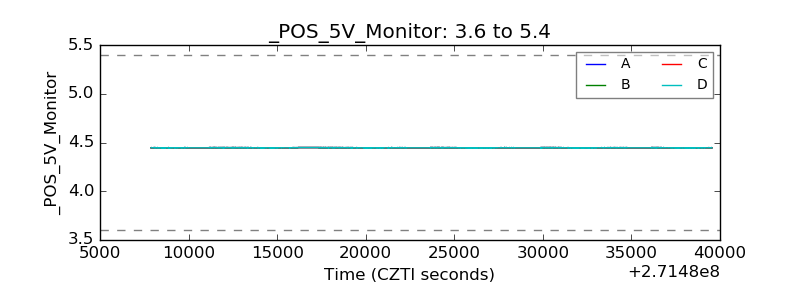 |
| _ROLL_ROT |  |
| _Roll_DEC | 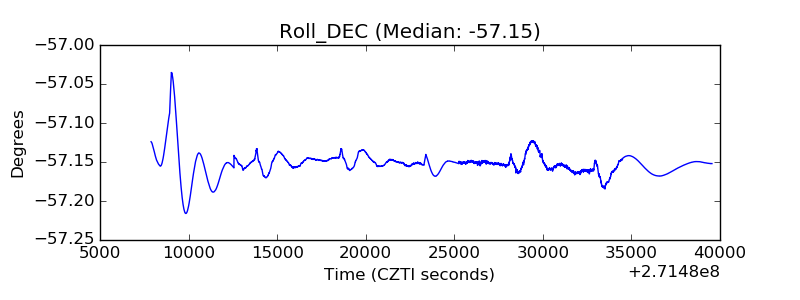 |
| _Roll_RA |  |
| Veto Counter |  |