| Param | Original file | Final file |
|---|---|---|
| Filename | modeM0/AS1G08_043T01_9000002288_15485cztM0_level2.evt | modeM0/AS1G08_043T01_9000002288_15485cztM0_level2_quad_clean.evt |
| Size (bytes) | 467,084,160 | 104,011,200 |
| Size | 445.4 MB | 99.2 MB |
| Events in quadrant A | 3,190,482 | 685,877 |
| Events in quadrant B | 3,592,141 | 689,438 |
| Events in quadrant C | 3,360,277 | 674,032 |
| Events in quadrant D | 3,575,247 | 661,330 |
| Mode SS | |||
|---|---|---|---|
| Quadrant | BADHDUFLAG | Total packets | Discarded packets |
| A | 0 | 128 | 0 |
| B | 0 | 128 | 0 |
| C | 0 | 128 | 0 |
| D | 0 | 128 | 0 |
| Mode M9 | |||
|---|---|---|---|
| Quadrant | BADHDUFLAG | Total packets | Discarded packets |
| A | 0 | 12 | 0 |
| B | 0 | 12 | 0 |
| C | 0 | 12 | 0 |
| D | 0 | 12 | 0 |
| Mode M0 | |||
|---|---|---|---|
| Quadrant | BADHDUFLAG | Total packets | Discarded packets |
| A | 0 | 13532 | 3 |
| B | 0 | 14630 | 2 |
| C | 0 | 13997 | 2 |
| D | 0 | 14714 | 2 |
| Quadrant | Total seconds | Saturated seconds | Saturation percentage |
|---|---|---|---|
| A | 6296 | 63 | 1.000635% |
| B | 6296 | 84 | 1.334180% |
| C | 6296 | 125 | 1.985388% |
| D | 6296 | 94 | 1.493011% |
Noise dominated data is calculated using 1-second bins in cleaned event files. If a bin has >2000 counts, and if more than 50% of those come from <1% of pixels, then it is considered to be noise-dominated and hence unusable.
| Quadrant | # 1 sec bins | Bins with >0 counts | Bins with >2000 counts | High rate bins dominated by noise | Noise dominated (total time) | Noise dominated (detector-on time) | Marked lightcurve |
|---|---|---|---|---|---|---|---|
| A | 7487 | 6298 | 0 | 0 | 0.00% | 0.00% | 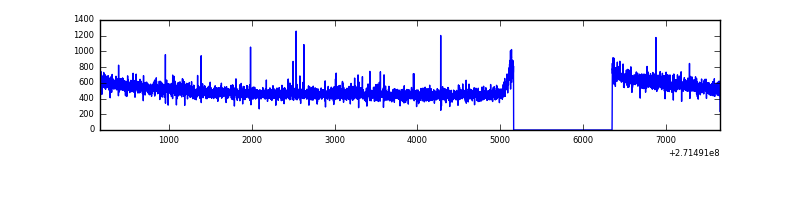 |
| B | 7487 | 6297 | 13 | 13 | 0.17% | 0.21% | 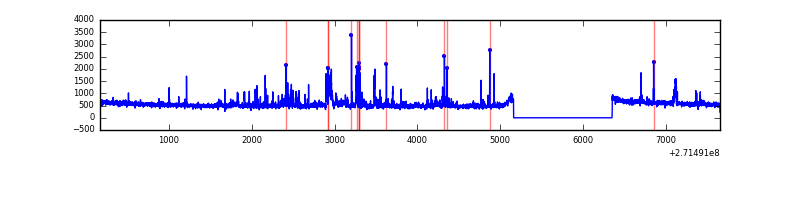 |
| C | 7487 | 6297 | 4 | 4 | 0.05% | 0.06% | 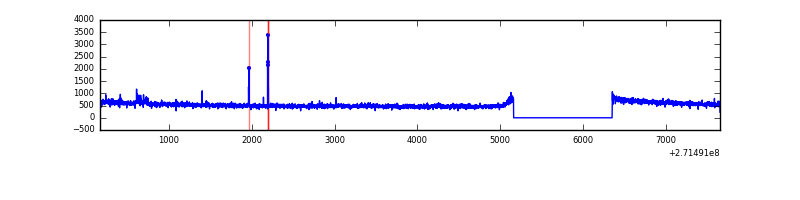 |
| D | 7487 | 6297 | 52 | 52 | 0.69% | 0.83% | 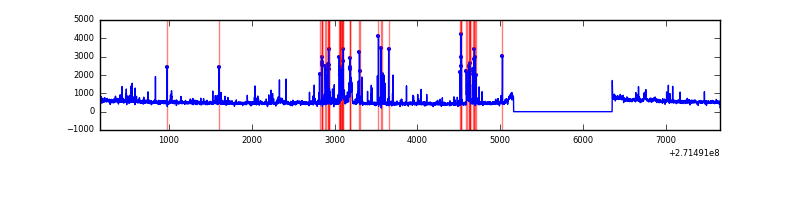 |
Top three noisy pixels from each quadrant. If the there are fewer than three noisy pixels in the level2.evt file, extra rows are filled as -1
| Pixel properties | Quadrant properties | ||||||
|---|---|---|---|---|---|---|---|
| Quadrant | DetID | PixID | Counts | Sigma | Mean | Median | Sigma |
| A | 9 | 143 | 15994 | 92.02 | 823 | 809 | 165.0 |
| A | 0 | 253 | 9603 | 53.29 | 823 | 809 | 165.0 |
| A | 0 | 226 | 7423 | 40.08 | 823 | 809 | 165.0 |
| B | 10 | 245 | 255116 | 1684.33 | 818 | 799 | 151.0 |
| B | 0 | 189 | 44632 | 290.3 | 818 | 799 | 151.0 |
| B | 0 | 229 | 22296 | 142.37 | 818 | 799 | 151.0 |
| C | 14 | 238 | 125701 | 691.15 | 792 | 798 | 180.7 |
| C | 3 | 233 | 104700 | 574.94 | 792 | 798 | 180.7 |
| C | 10 | 22 | 21055 | 112.09 | 792 | 798 | 180.7 |
| D | 1 | 52 | 295247 | 1526.64 | 804 | 782 | 192.9 |
| D | 5 | 222 | 103036 | 530.13 | 804 | 782 | 192.9 |
| D | 7 | 38 | 80837 | 415.04 | 804 | 782 | 192.9 |
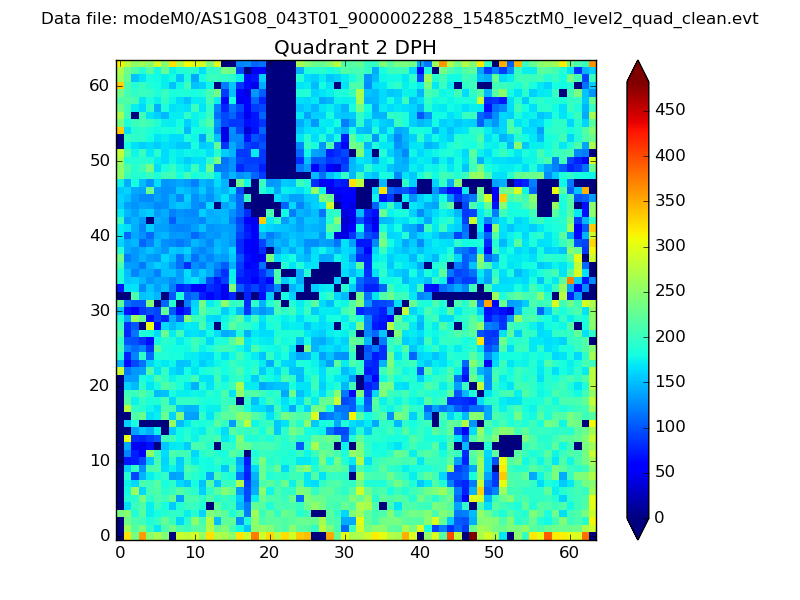
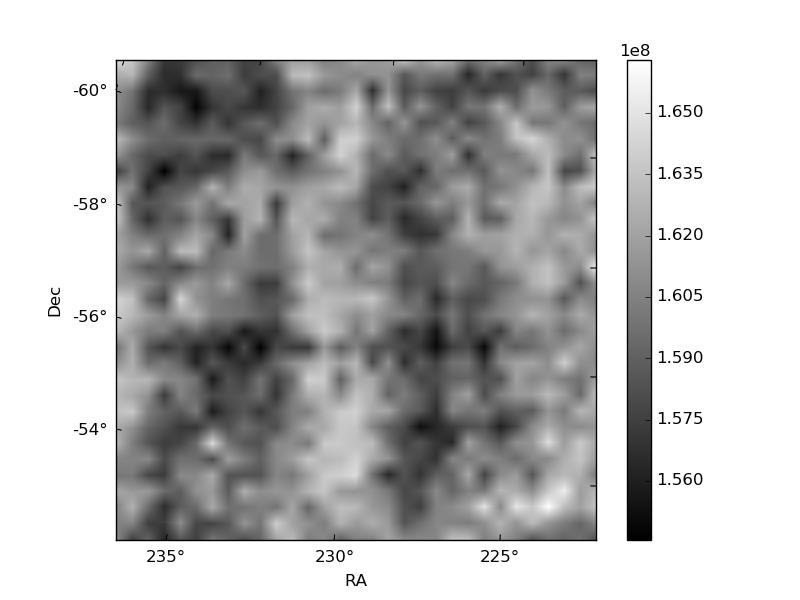
Histogram calculated using DETX and DETY for each event in the final _common_clean file
| Quadrant A | 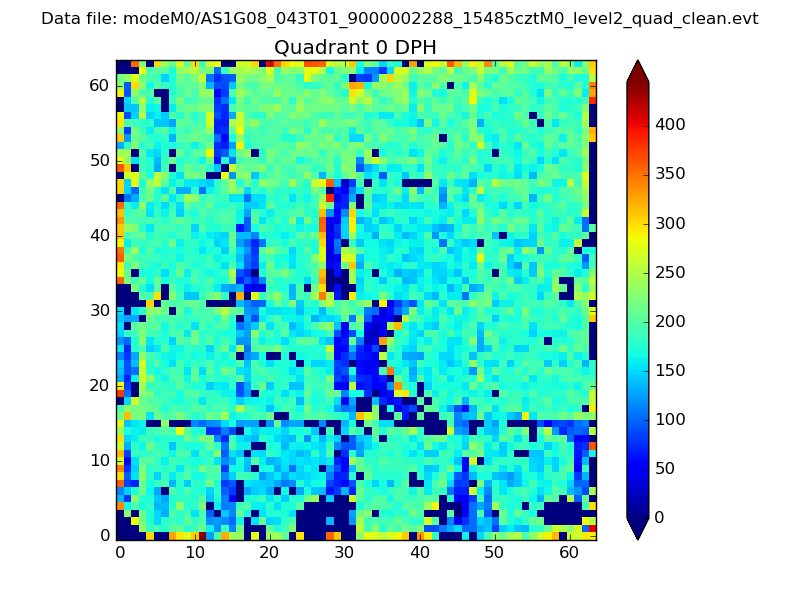 |
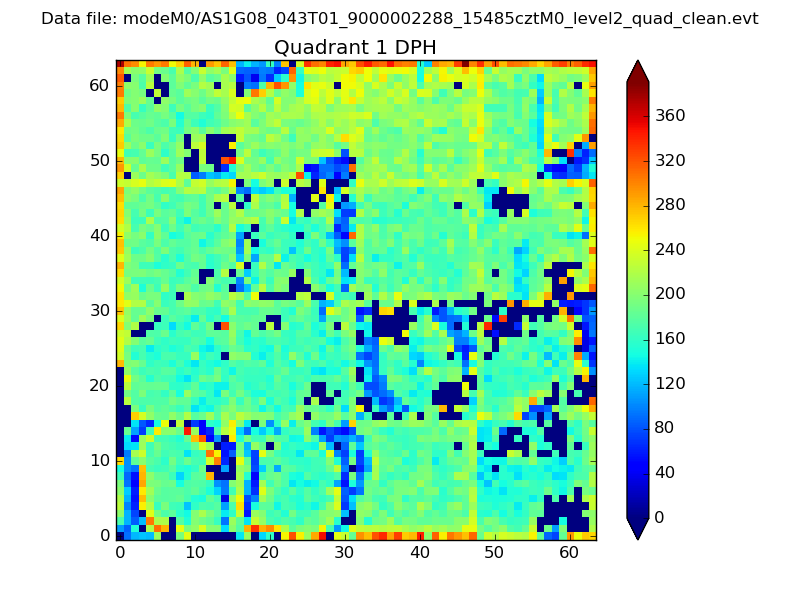 |
Quadrant B |
|---|---|---|---|
| Quadrant D | 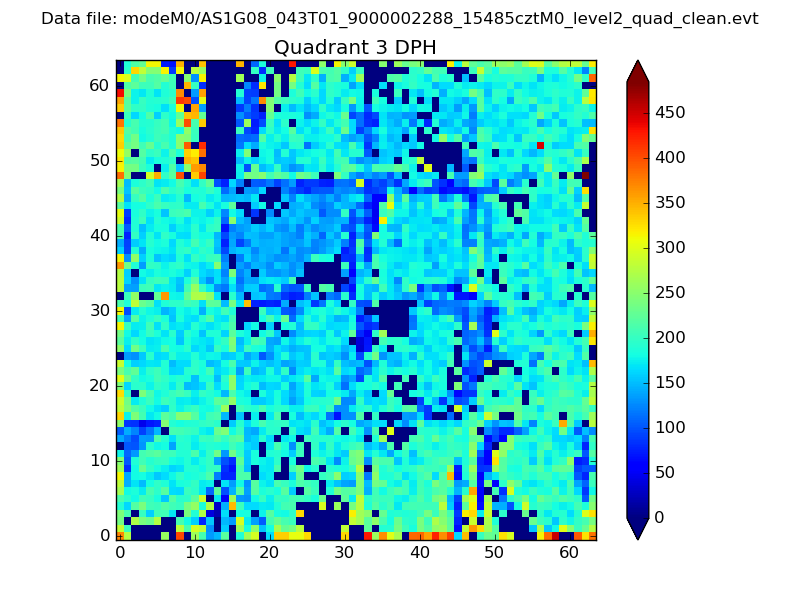 |
 |
Quadrant C |
| Plot type | Count rate plots | Images |
|---|---|---|
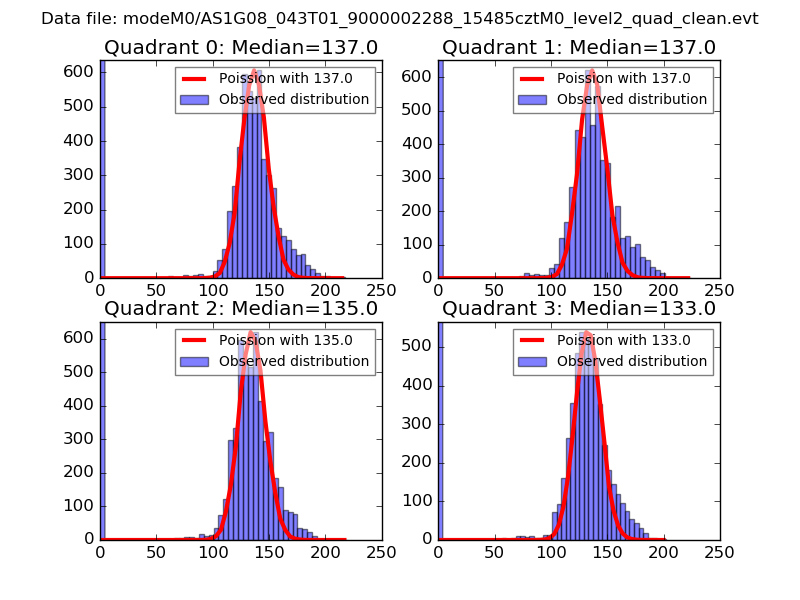
| Comparison with Poisson distribution Blue bars denote a histogram of data divided into 1 sec bins. Red curve is a Poisson curve with rate = median count rate of data. |
 |
 |
| Quadrant-wise count rates Data is divided into 100 sec bins |
 |
|
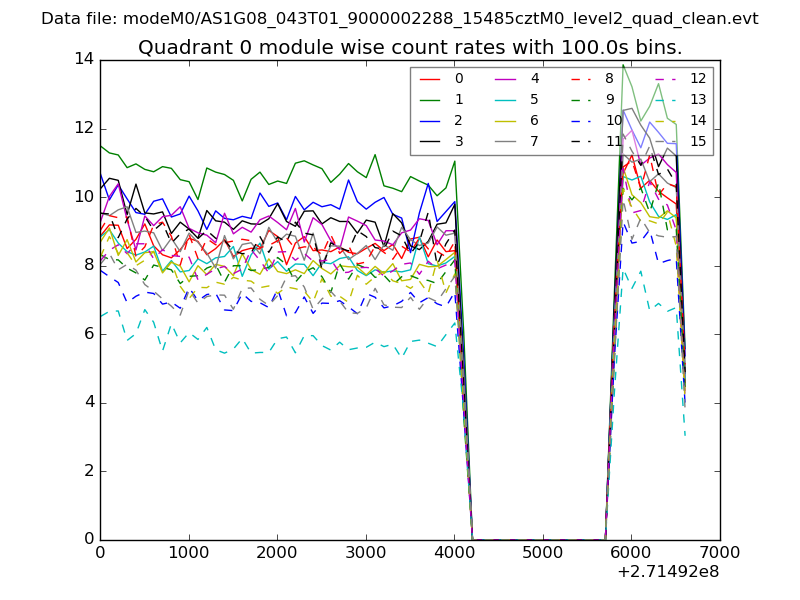
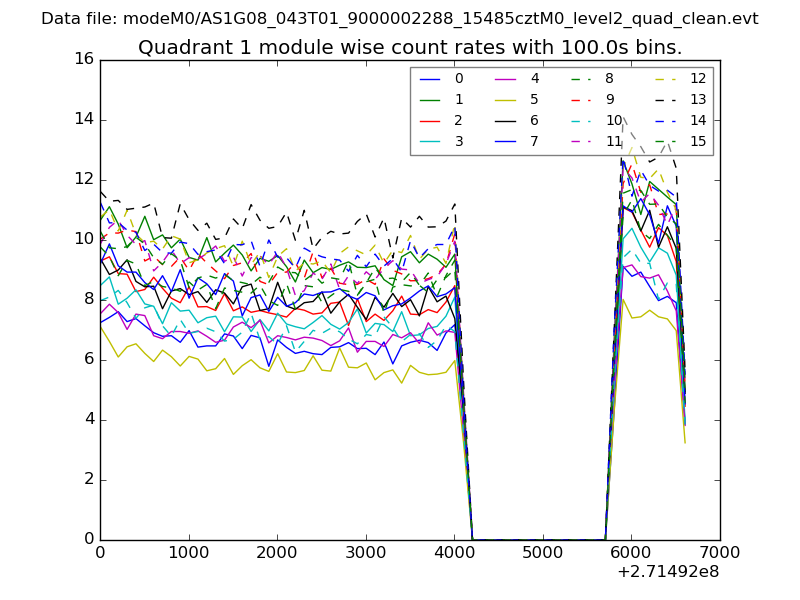
| Module-wise count rates for Quadrant A Data is divided into 100 sec bins |
 |
 |
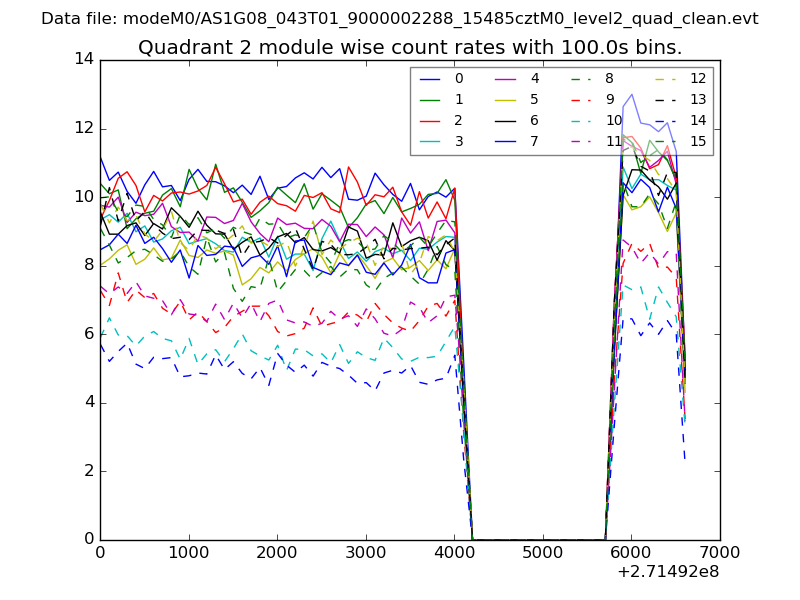
| Module-wise count rates for Quadrant B Data is divided into 100 sec bins |
 |
 |
| Module-wise count rates for Quadrant C Data is divided into 100 sec bins |
 |
 |
| Module-wise count rates for Quadrant D Data is divided into 100 sec bins |
 |
 |
| Parameter | Plot |
|---|---|
| CZT HV Monitor | 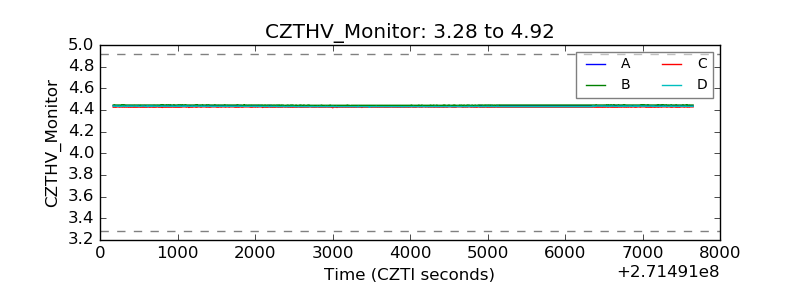 |
| D_VDD | 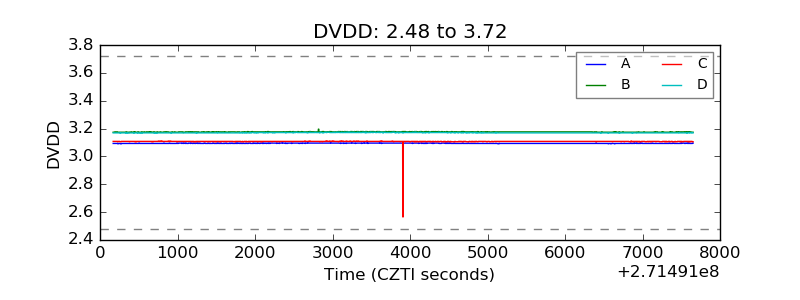 |
| Temperature 1 | 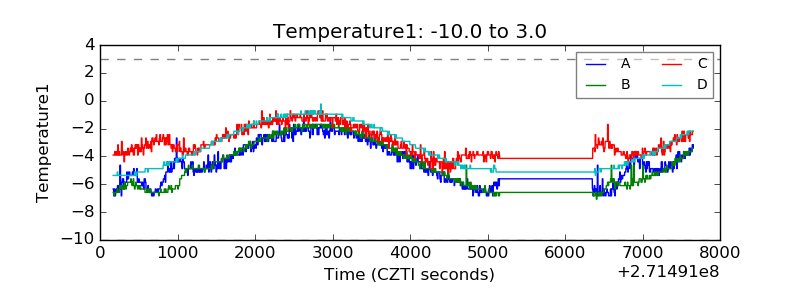 |
| Veto HV Monitor | 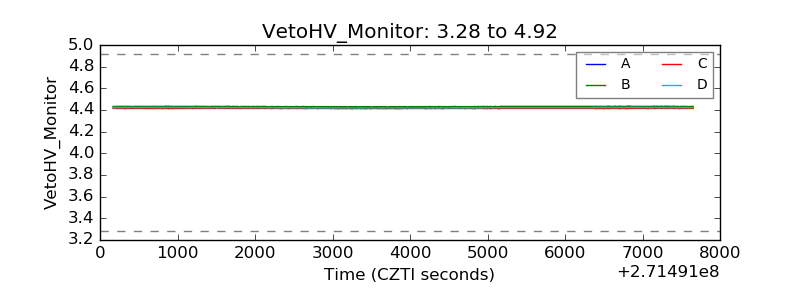 |
| Veto LLD | 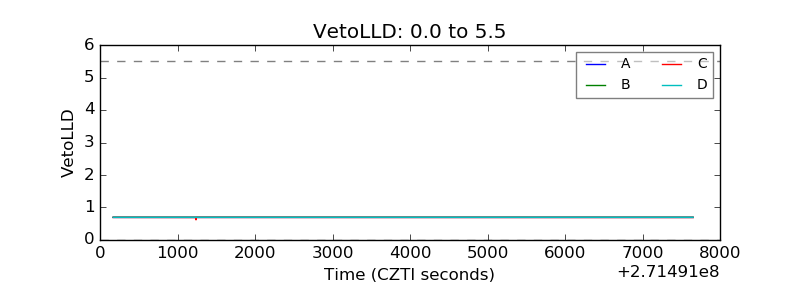 |
| Alpha Counter |  |
| _CPM_Rate | 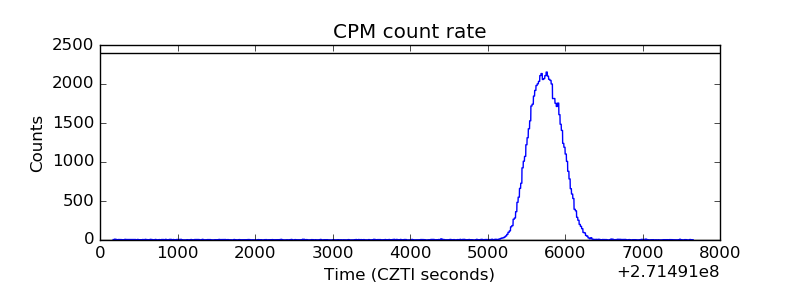 |
| CZT Counter | 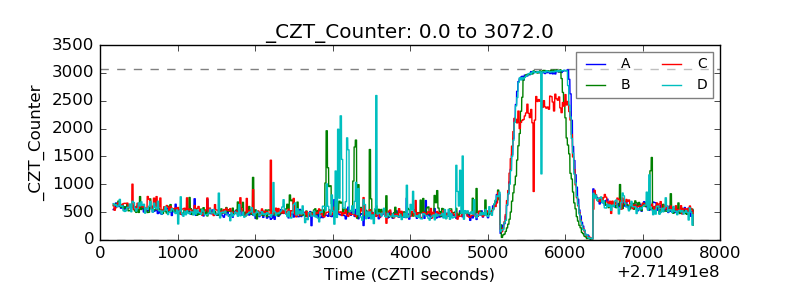 |
| +2.5 Volts monitor |  |
| +5 Volts monitor |  |
| _ROLL_ROT | 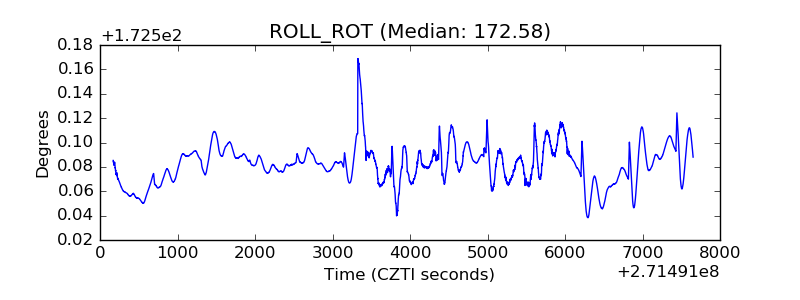 |
| _Roll_DEC | 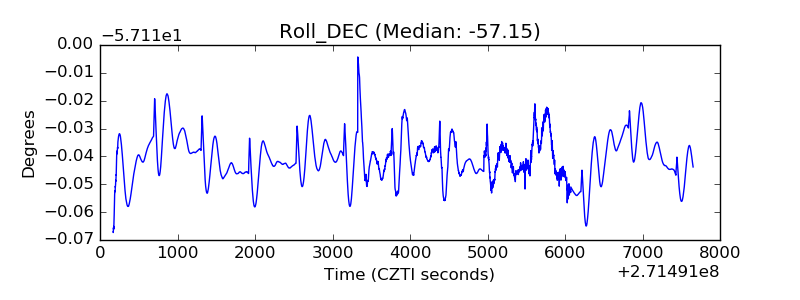 |
| _Roll_RA | 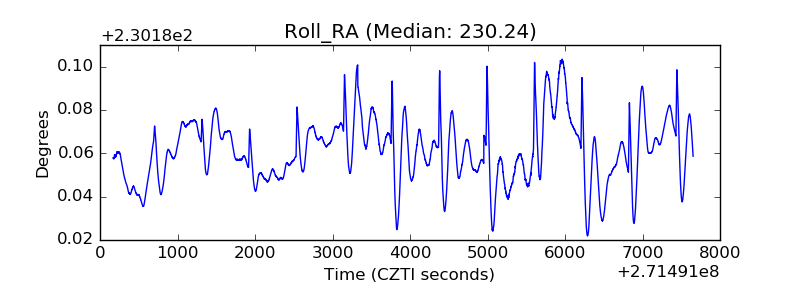 |
| Veto Counter | 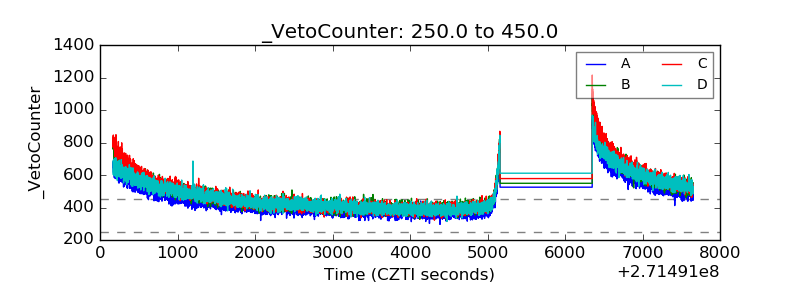 |