| Param | Original file | Final file |
|---|---|---|
| Filename | modeM0/AS1G08_043T01_9000002288_15486cztM0_level2.evt | modeM0/AS1G08_043T01_9000002288_15486cztM0_level2_quad_clean.evt |
| Size (bytes) | 482,037,120 | 127,077,120 |
| Size | 459.7 MB | 121.2 MB |
| Events in quadrant A | 3,342,409 | 867,737 |
| Events in quadrant B | 3,811,822 | 871,231 |
| Events in quadrant C | 3,421,576 | 844,893 |
| Events in quadrant D | 3,595,850 | 826,436 |
| Mode SS | |||
|---|---|---|---|
| Quadrant | BADHDUFLAG | Total packets | Discarded packets |
| A | 0 | 128 | 0 |
| B | 0 | 128 | 0 |
| C | 0 | 128 | 0 |
| D | 0 | 128 | 0 |
| Mode M9 | |||
|---|---|---|---|
| Quadrant | BADHDUFLAG | Total packets | Discarded packets |
| A | 0 | 13 | 0 |
| B | 0 | 13 | 0 |
| C | 0 | 13 | 0 |
| D | 0 | 14 | 0 |
| Mode M0 | |||
|---|---|---|---|
| Quadrant | BADHDUFLAG | Total packets | Discarded packets |
| A | 0 | 14016 | 3 |
| B | 0 | 15393 | 2 |
| C | 0 | 14334 | 2 |
| D | 0 | 14830 | 2 |
| Quadrant | Total seconds | Saturated seconds | Saturation percentage |
|---|---|---|---|
| A | 6286 | 88 | 1.399936% |
| B | 6286 | 121 | 1.924913% |
| C | 6286 | 134 | 2.131721% |
| D | 6286 | 139 | 2.211263% |
Noise dominated data is calculated using 1-second bins in cleaned event files. If a bin has >2000 counts, and if more than 50% of those come from <1% of pixels, then it is considered to be noise-dominated and hence unusable.
| Quadrant | # 1 sec bins | Bins with >0 counts | Bins with >2000 counts | High rate bins dominated by noise | Noise dominated (total time) | Noise dominated (detector-on time) | Marked lightcurve |
|---|---|---|---|---|---|---|---|
| A | 7587 | 6287 | 1 | 1 | 0.01% | 0.02% | 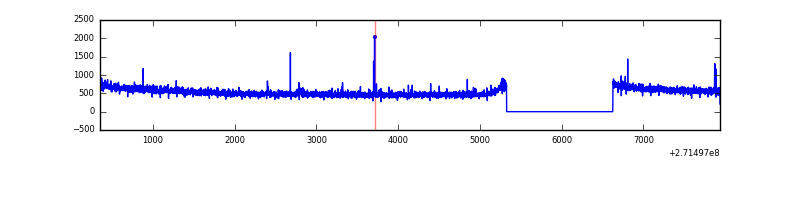 |
| B | 7587 | 6288 | 28 | 28 | 0.37% | 0.45% | 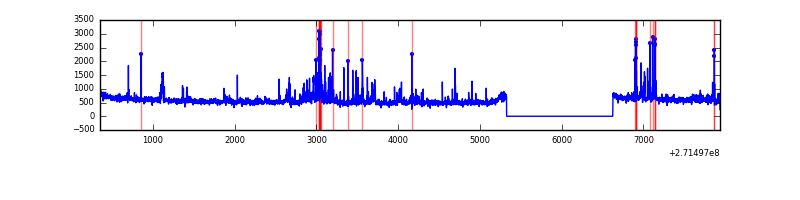 |
| C | 7587 | 6287 | 0 | 0 | 0.00% | 0.00% | 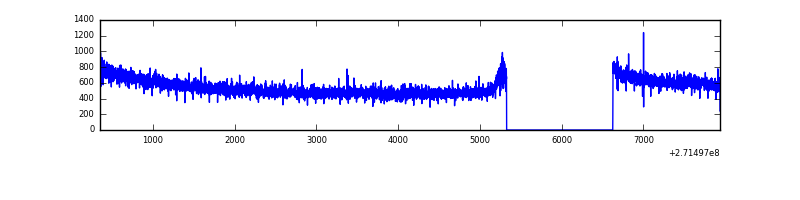 |
| D | 7587 | 6288 | 55 | 55 | 0.72% | 0.87% | 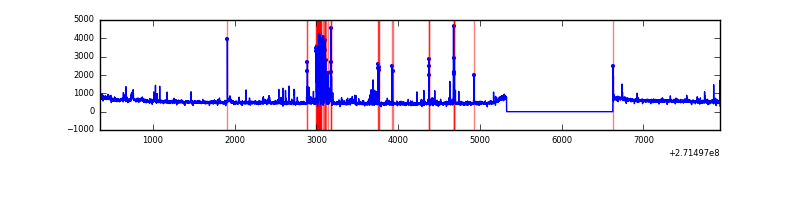 |
Top three noisy pixels from each quadrant. If the there are fewer than three noisy pixels in the level2.evt file, extra rows are filled as -1
| Pixel properties | Quadrant properties | ||||||
|---|---|---|---|---|---|---|---|
| Quadrant | DetID | PixID | Counts | Sigma | Mean | Median | Sigma |
| A | 7 | 16 | 14882 | 81.87 | 860 | 844 | 171.5 |
| A | 0 | 253 | 13083 | 71.38 | 860 | 844 | 171.5 |
| A | 0 | 226 | 7837 | 40.78 | 860 | 844 | 171.5 |
| B | 10 | 245 | 225419 | 1445.96 | 849 | 830 | 155.3 |
| B | 4 | 142 | 109584 | 700.19 | 849 | 830 | 155.3 |
| B | 0 | 229 | 51230 | 324.49 | 849 | 830 | 155.3 |
| C | 14 | 238 | 129755 | 695.09 | 820 | 828 | 185.5 |
| C | 3 | 233 | 87432 | 466.91 | 820 | 828 | 185.5 |
| C | 13 | 61 | 5940 | 27.56 | 820 | 828 | 185.5 |
| D | 1 | 52 | 243458 | 1210.74 | 836 | 814 | 200.4 |
| D | 7 | 38 | 75059 | 370.47 | 836 | 814 | 200.4 |
| D | 5 | 222 | 29281 | 142.04 | 836 | 814 | 200.4 |
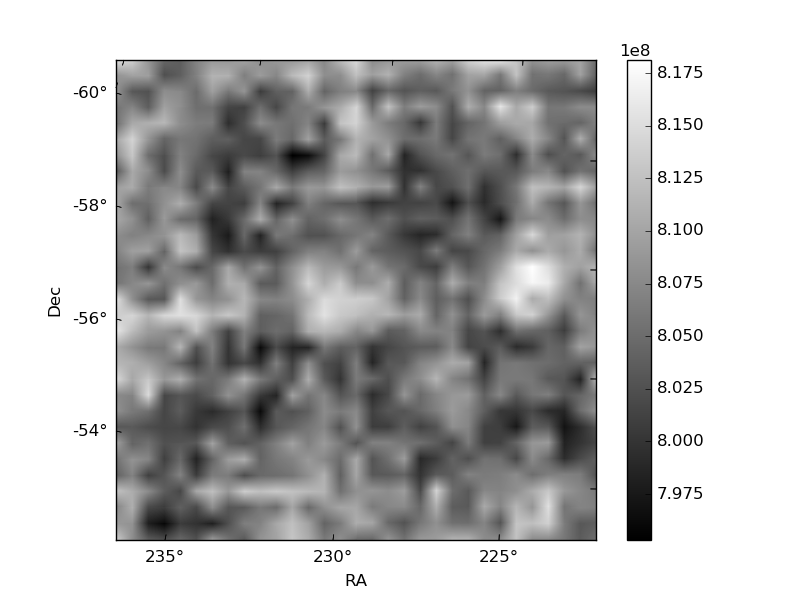
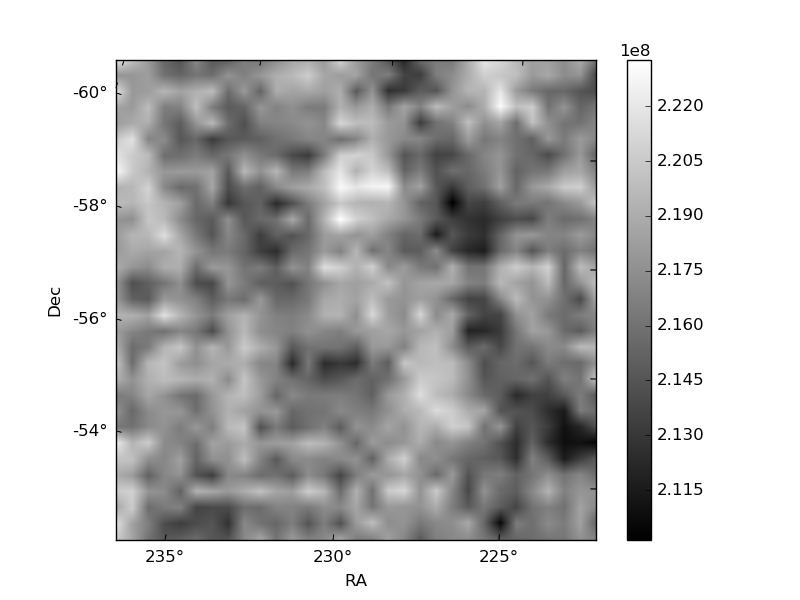
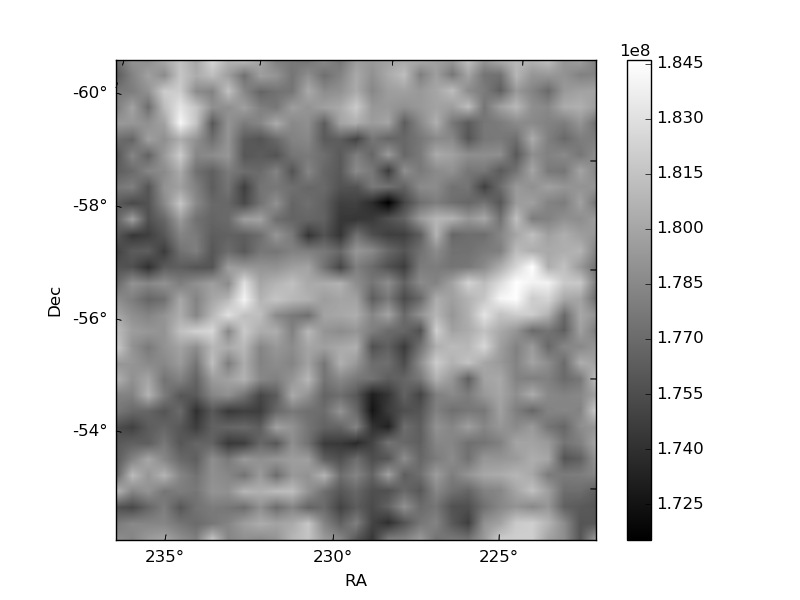
Histogram calculated using DETX and DETY for each event in the final _common_clean file
| Quadrant A | 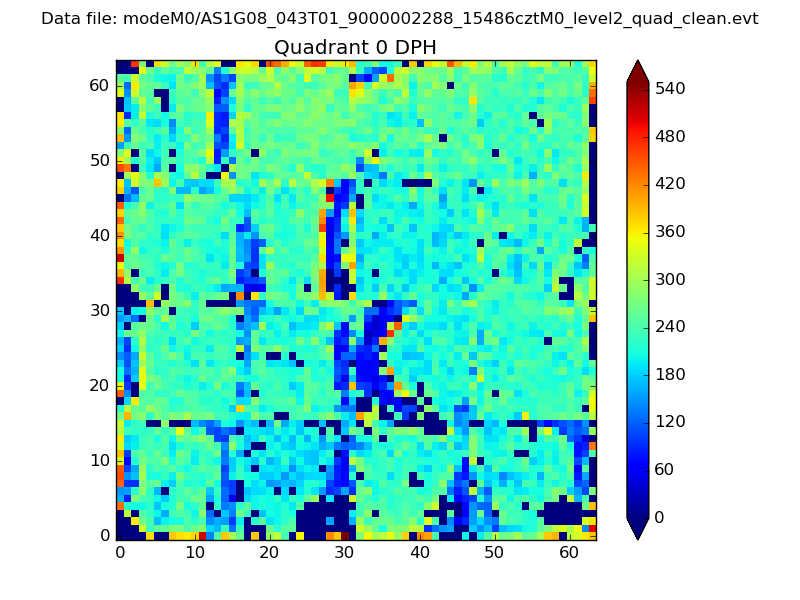 |
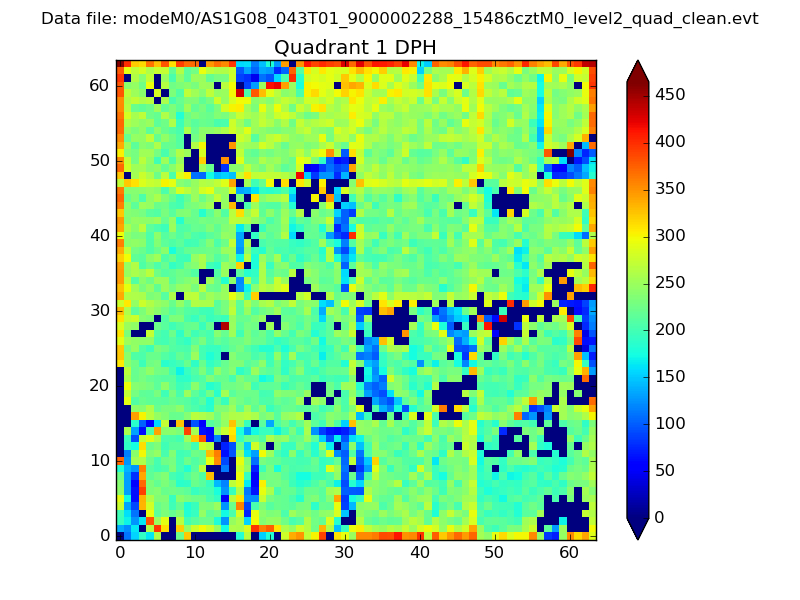 |
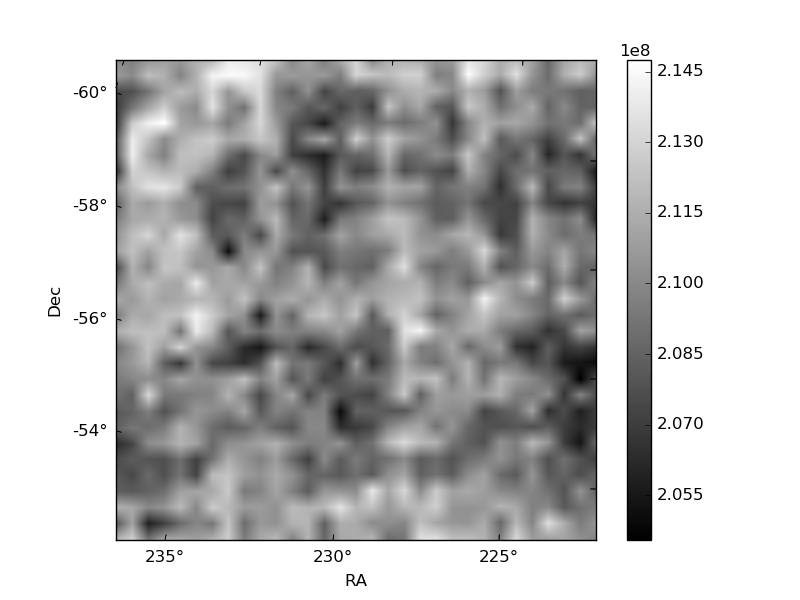
Quadrant B |
|---|---|---|---|
| Quadrant D |  |
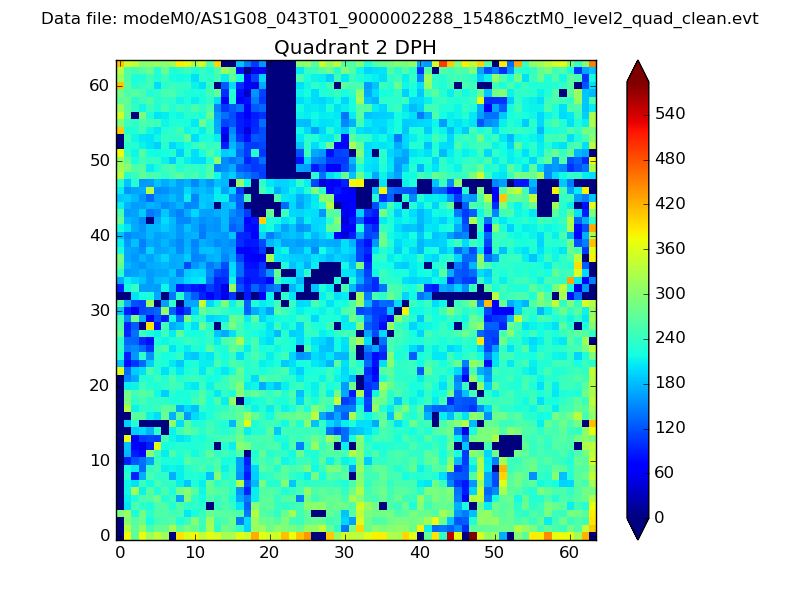 |
Quadrant C |
| Plot type | Count rate plots | Images |
|---|---|---|
| Comparison with Poisson distribution Blue bars denote a histogram of data divided into 1 sec bins. Red curve is a Poisson curve with rate = median count rate of data. |
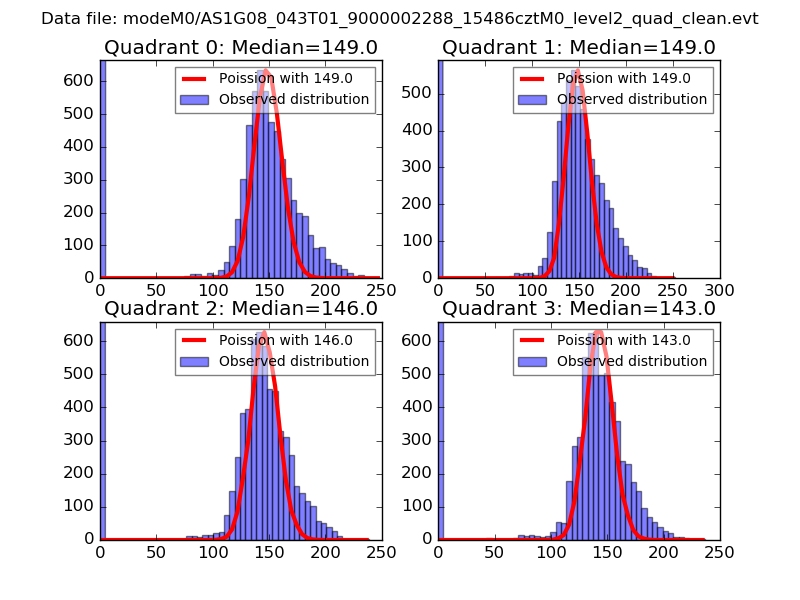 |
 |
| Quadrant-wise count rates Data is divided into 100 sec bins |
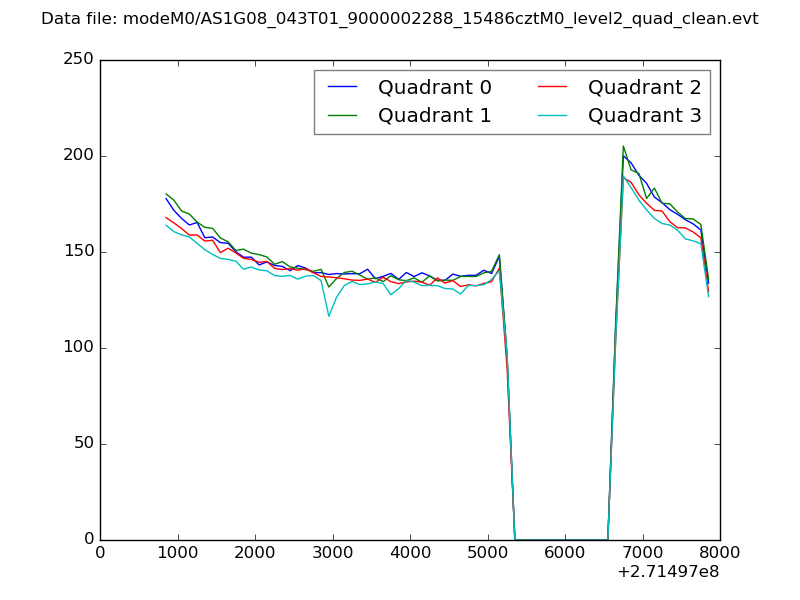 |
|
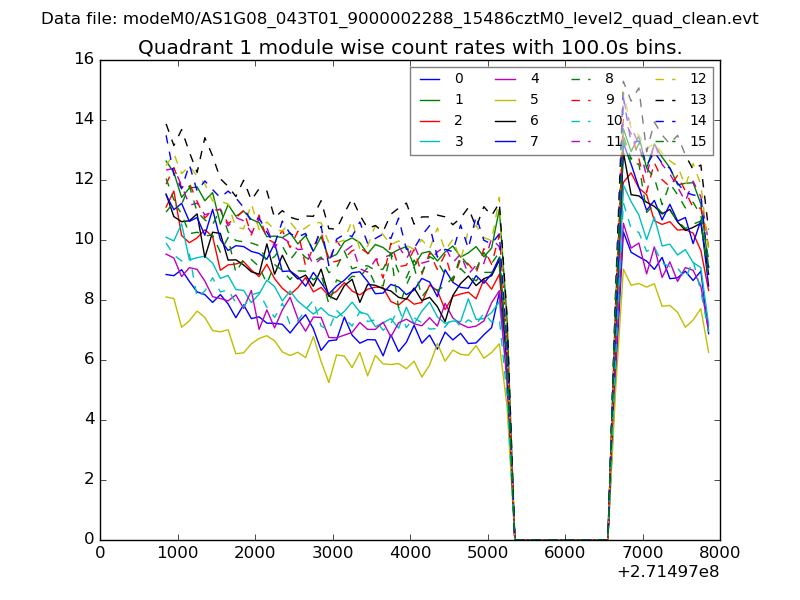
| Module-wise count rates for Quadrant A Data is divided into 100 sec bins |
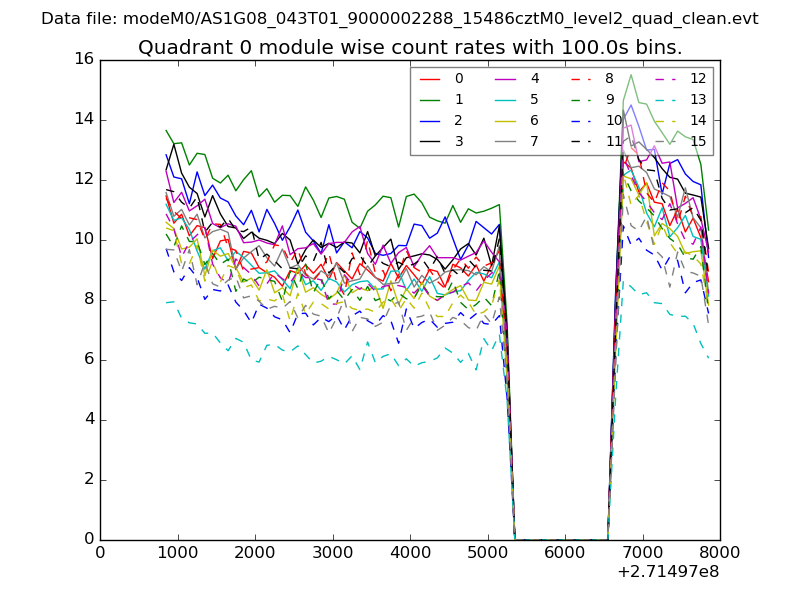 |
 |
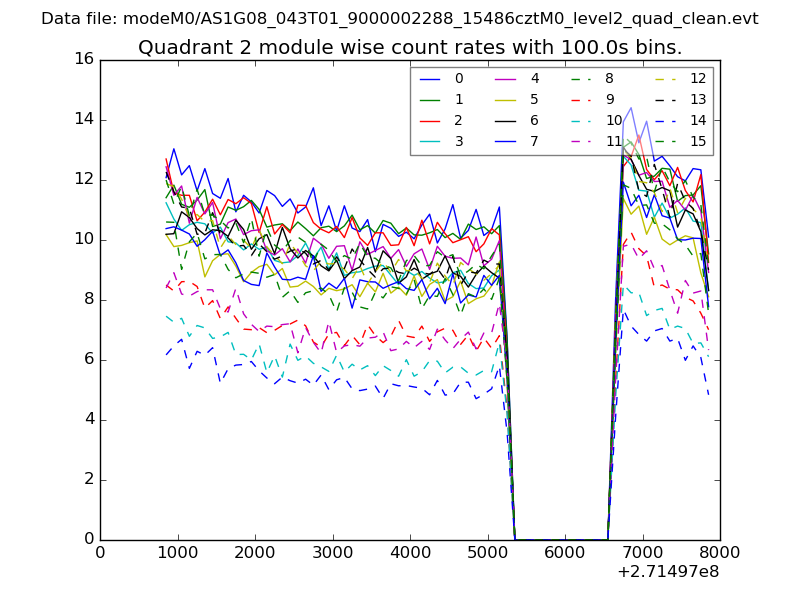
| Module-wise count rates for Quadrant B Data is divided into 100 sec bins |
 |
 |
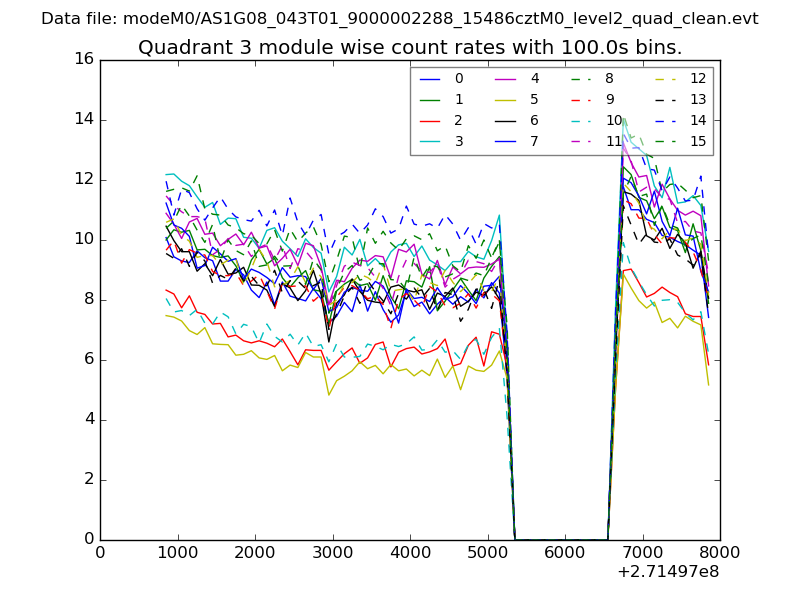
| Module-wise count rates for Quadrant C Data is divided into 100 sec bins |
 |
 |
| Module-wise count rates for Quadrant D Data is divided into 100 sec bins |
 |
 |
| Parameter | Plot |
|---|---|
| CZT HV Monitor | 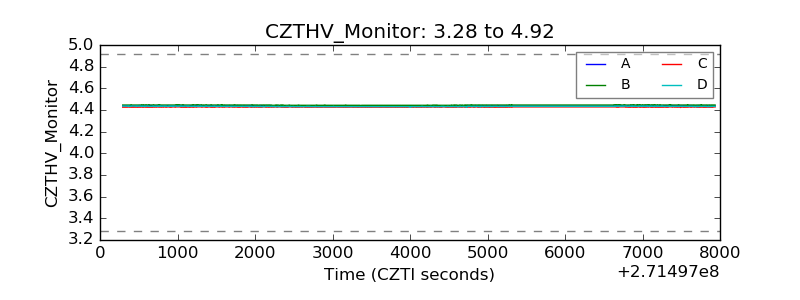 |
| D_VDD | 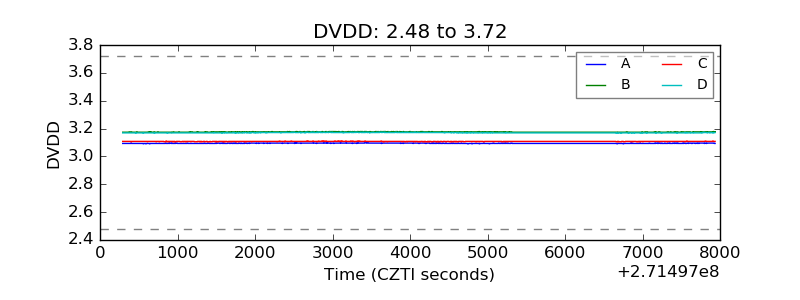 |
| Temperature 1 | 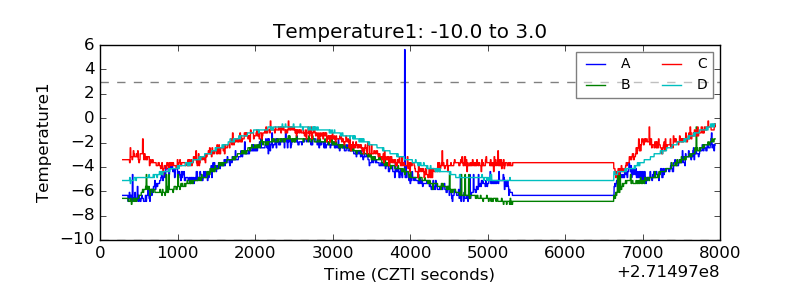 |
| Veto HV Monitor | 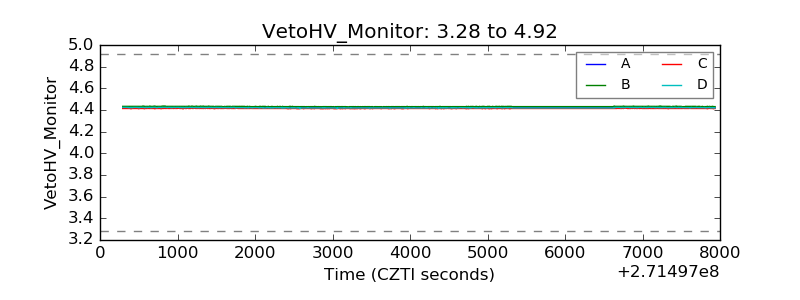 |
| Veto LLD | 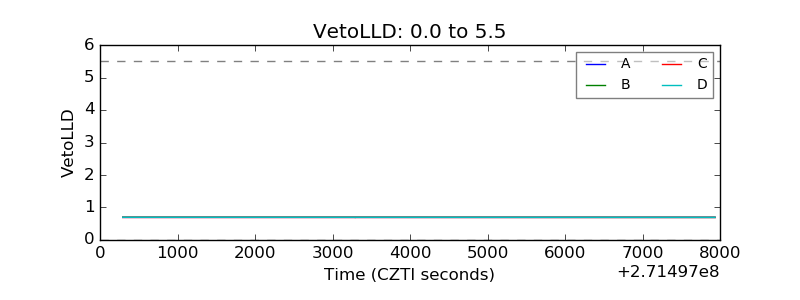 |
| Alpha Counter | 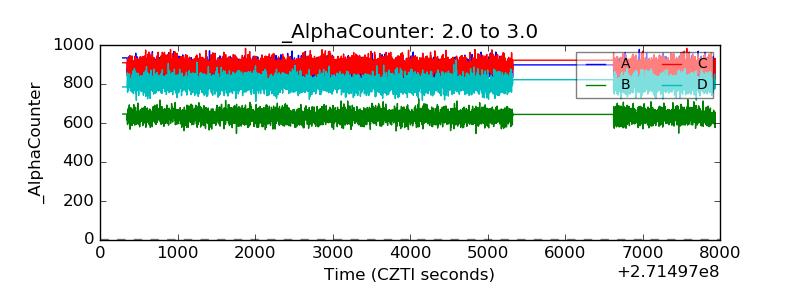 |
| _CPM_Rate | 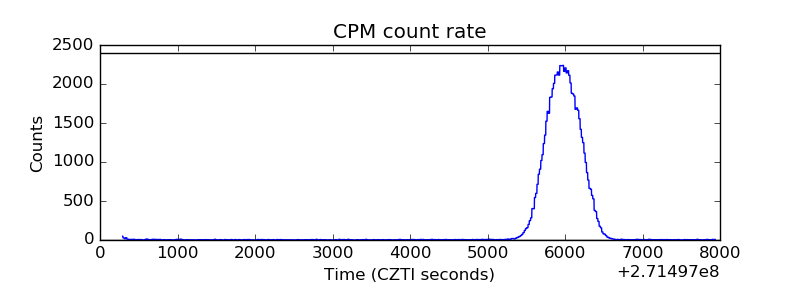 |
| CZT Counter | 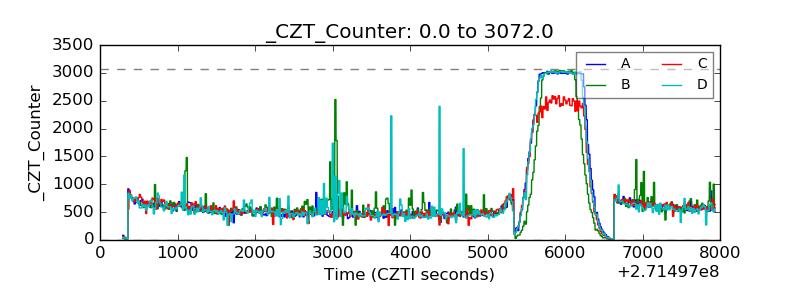 |
| +2.5 Volts monitor |  |
| +5 Volts monitor | 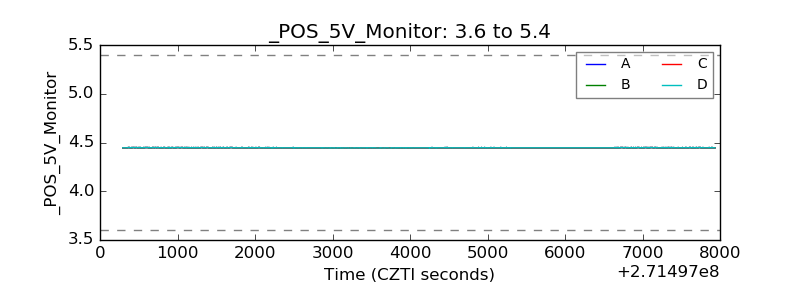 |
| _ROLL_ROT | 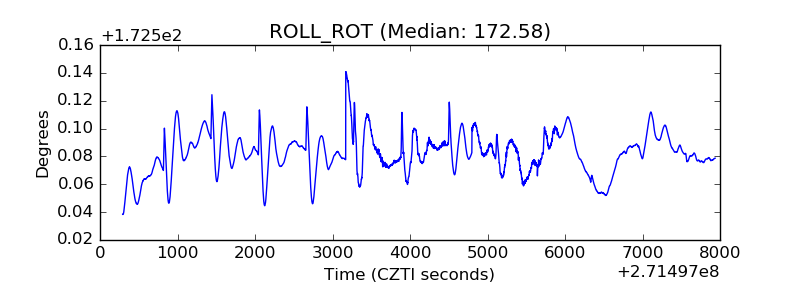 |
| _Roll_DEC | 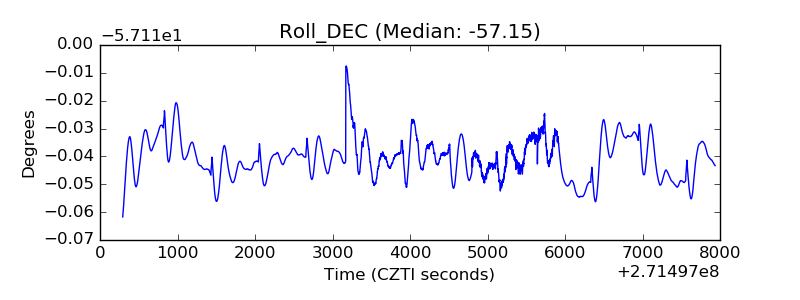 |
| _Roll_RA | 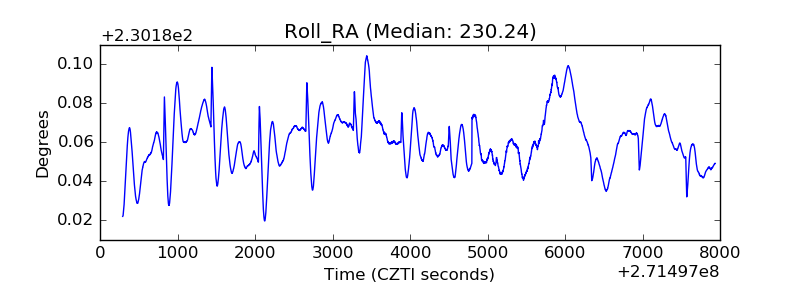 |
| Veto Counter | 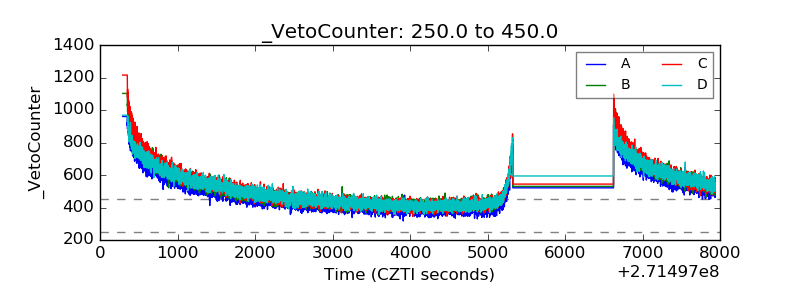 |