| Param | Original file | Final file |
|---|---|---|
| Filename | modeM0/AS1G08_043T01_9000002288_15487cztM0_level2.evt | modeM0/AS1G08_043T01_9000002288_15487cztM0_level2_quad_clean.evt |
| Size (bytes) | 493,824,960 | 138,746,880 |
| Size | 470.9 MB | 132.3 MB |
| Events in quadrant A | 3,515,674 | 958,655 |
| Events in quadrant B | 3,877,620 | 959,261 |
| Events in quadrant C | 3,535,976 | 922,076 |
| Events in quadrant D | 3,587,632 | 911,847 |
| Mode SS | |||
|---|---|---|---|
| Quadrant | BADHDUFLAG | Total packets | Discarded packets |
| A | 0 | 132 | 0 |
| B | 0 | 132 | 0 |
| C | 0 | 132 | 0 |
| D | 0 | 132 | 0 |
| Mode M9 | |||
|---|---|---|---|
| Quadrant | BADHDUFLAG | Total packets | Discarded packets |
| A | 0 | 13 | 0 |
| B | 0 | 13 | 0 |
| C | 0 | 13 | 0 |
| D | 0 | 13 | 0 |
| Mode M0 | |||
|---|---|---|---|
| Quadrant | BADHDUFLAG | Total packets | Discarded packets |
| A | 0 | 14440 | 3 |
| B | 0 | 15708 | 2 |
| C | 0 | 14747 | 2 |
| D | 0 | 14757 | 2 |
| Quadrant | Total seconds | Saturated seconds | Saturation percentage |
|---|---|---|---|
| A | 6460 | 92 | 1.424149% |
| B | 6460 | 120 | 1.857585% |
| C | 6460 | 120 | 1.857585% |
| D | 6460 | 97 | 1.501548% |
Noise dominated data is calculated using 1-second bins in cleaned event files. If a bin has >2000 counts, and if more than 50% of those come from <1% of pixels, then it is considered to be noise-dominated and hence unusable.
| Quadrant | # 1 sec bins | Bins with >0 counts | Bins with >2000 counts | High rate bins dominated by noise | Noise dominated (total time) | Noise dominated (detector-on time) | Marked lightcurve |
|---|---|---|---|---|---|---|---|
| A | 7786 | 6461 | 2 | 2 | 0.03% | 0.03% | 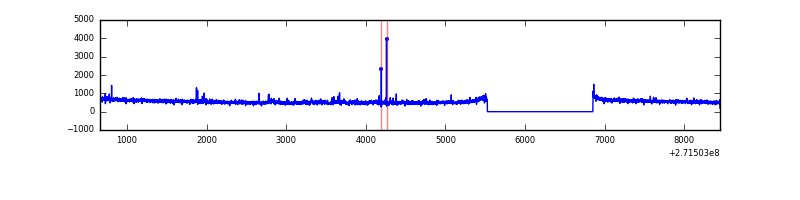 |
| B | 7786 | 6462 | 21 | 21 | 0.27% | 0.32% | 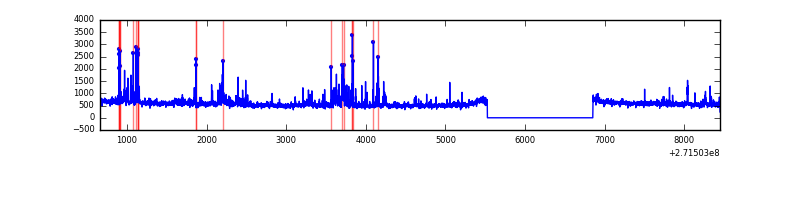 |
| C | 7786 | 6462 | 5 | 5 | 0.06% | 0.08% | 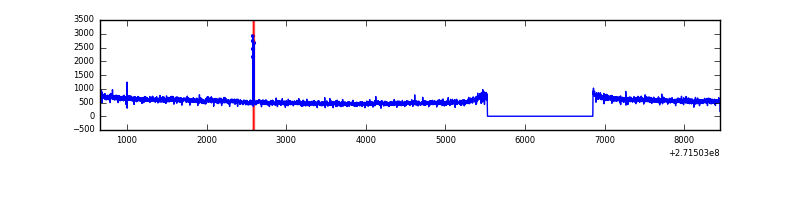 |
| D | 7786 | 6461 | 27 | 27 | 0.35% | 0.42% | 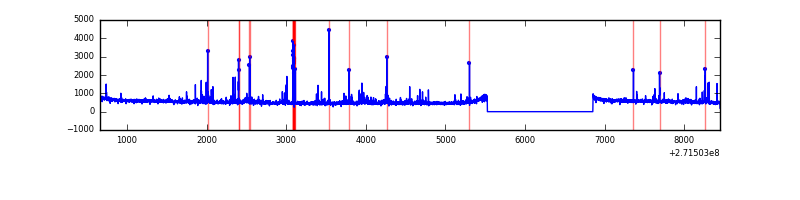 |
Top three noisy pixels from each quadrant. If the there are fewer than three noisy pixels in the level2.evt file, extra rows are filled as -1
| Pixel properties | Quadrant properties | ||||||
|---|---|---|---|---|---|---|---|
| Quadrant | DetID | PixID | Counts | Sigma | Mean | Median | Sigma |
| A | 0 | 253 | 76066 | 430.91 | 883 | 868 | 174.5 |
| A | 9 | 143 | 17140 | 93.24 | 883 | 868 | 174.5 |
| A | 14 | 238 | 10446 | 54.88 | 883 | 868 | 174.5 |
| B | 10 | 245 | 279796 | 1758.26 | 867 | 849 | 158.6 |
| B | 4 | 142 | 43229 | 267.13 | 867 | 849 | 158.6 |
| B | 0 | 229 | 40277 | 248.52 | 867 | 849 | 158.6 |
| C | 14 | 238 | 132709 | 692.52 | 834 | 842 | 190.4 |
| C | 3 | 233 | 130853 | 682.78 | 834 | 842 | 190.4 |
| C | 9 | 54 | 17451 | 87.23 | 834 | 842 | 190.4 |
| D | 1 | 52 | 163550 | 788.3 | 861 | 837 | 206.4 |
| D | 7 | 38 | 44985 | 213.88 | 861 | 837 | 206.4 |
| D | 2 | 221 | 35482 | 167.85 | 861 | 837 | 206.4 |
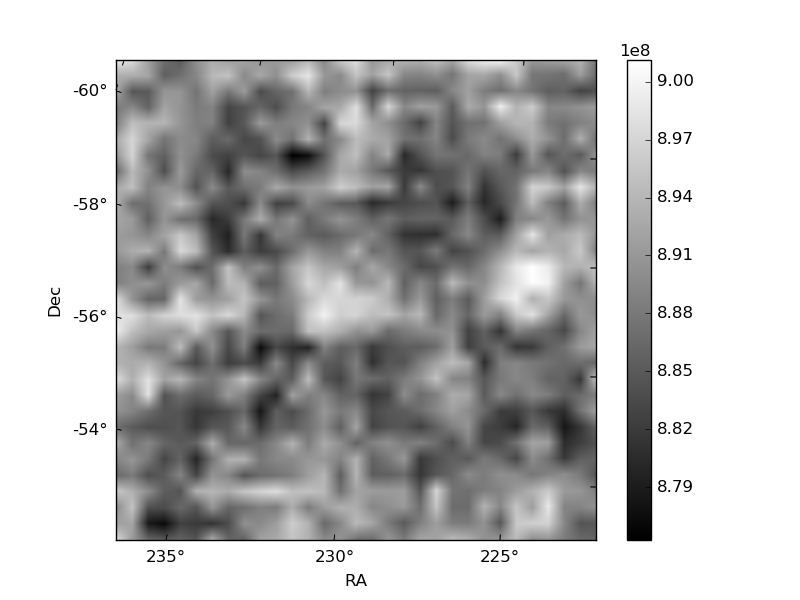
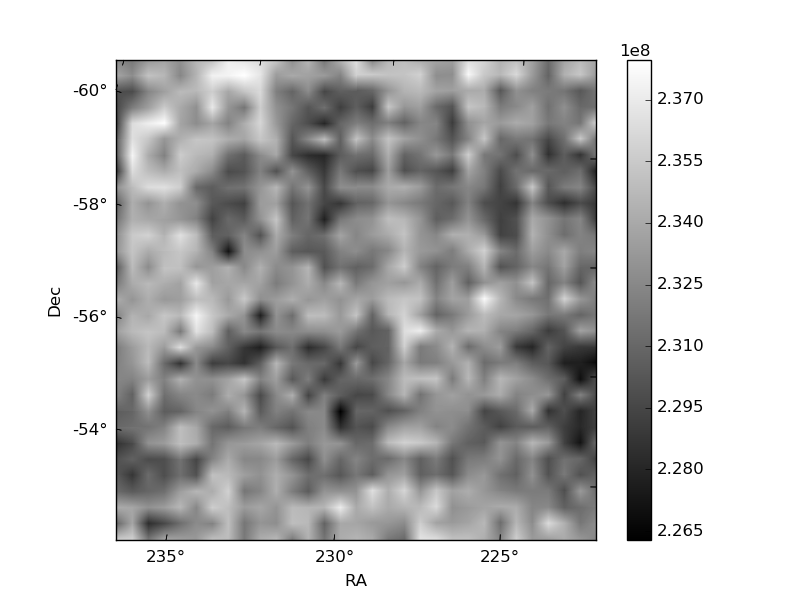
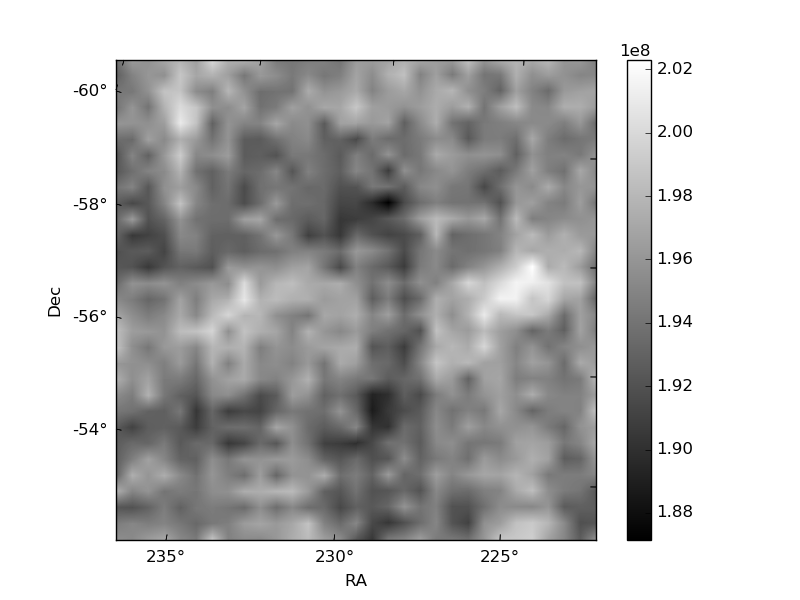
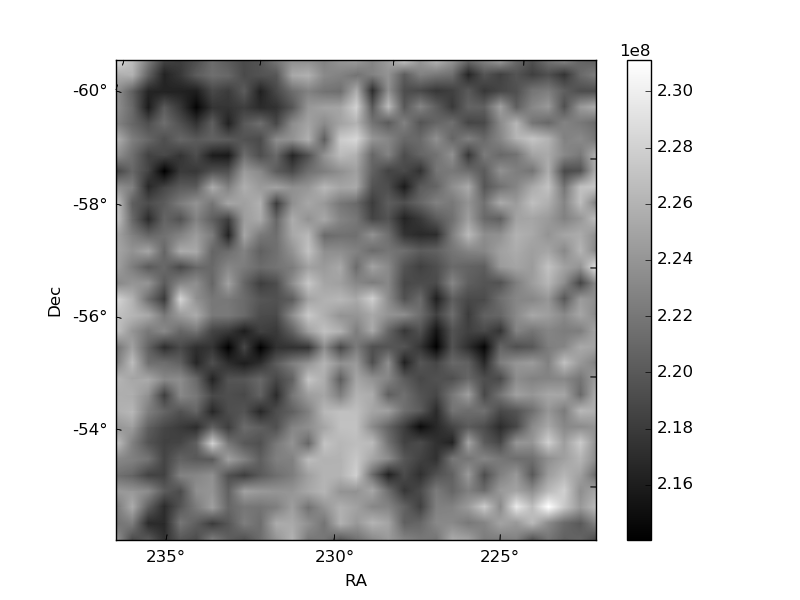
Histogram calculated using DETX and DETY for each event in the final _common_clean file
| Quadrant A | 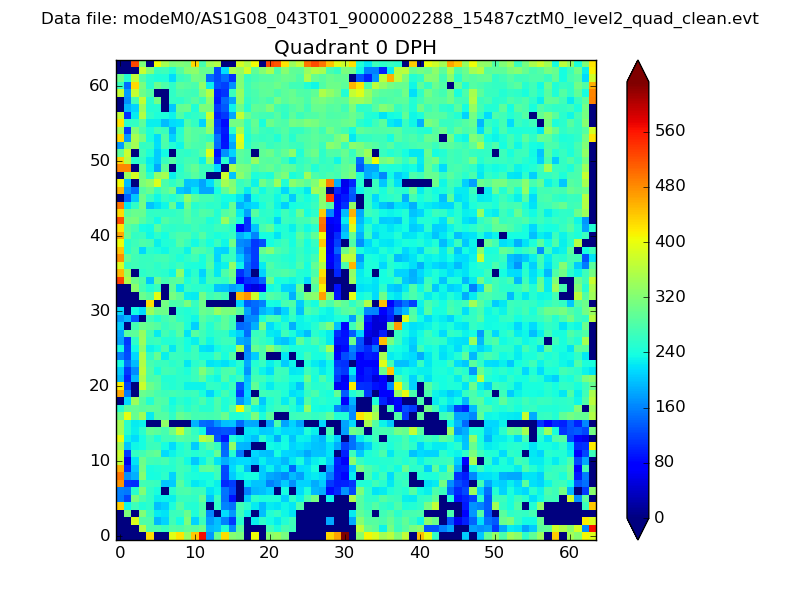 |
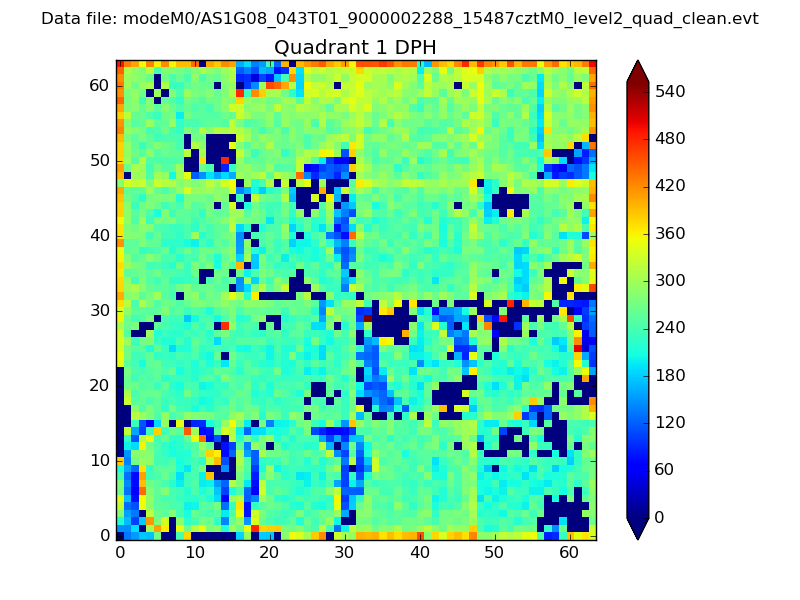 |
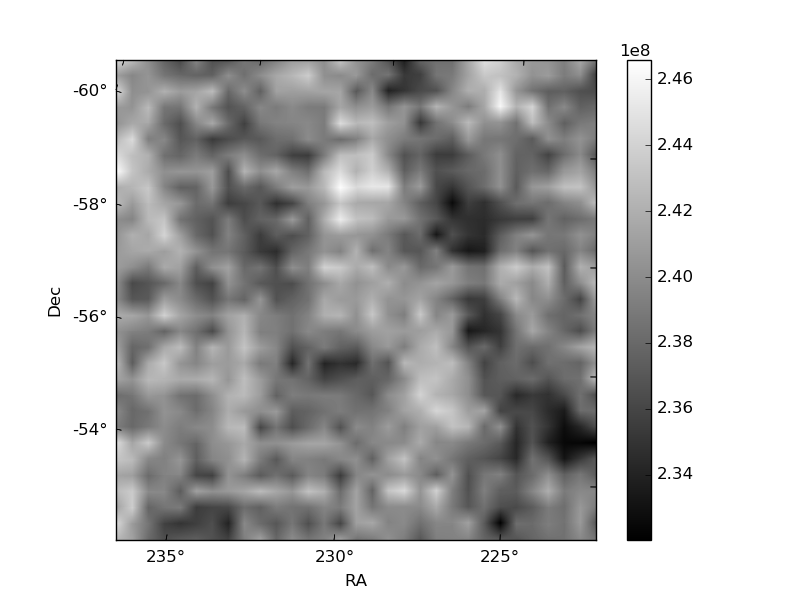
Quadrant B |
|---|---|---|---|
| Quadrant D | 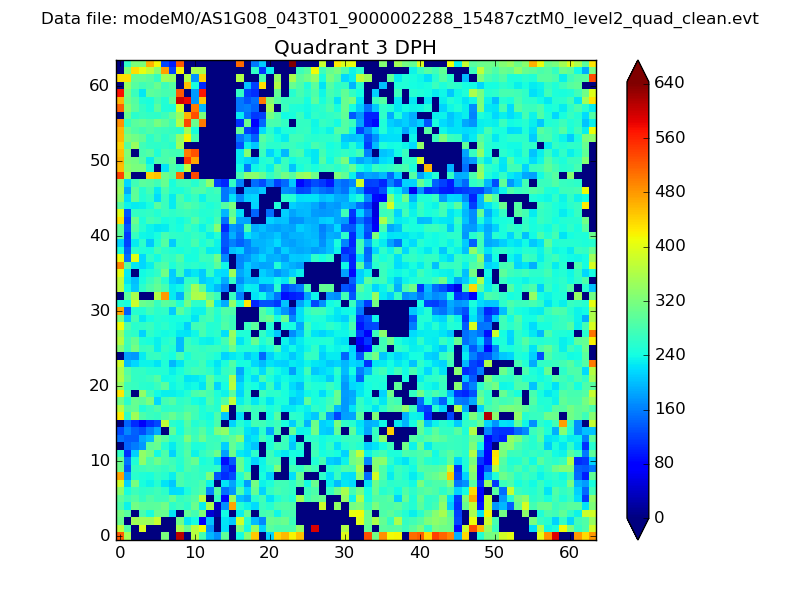 |
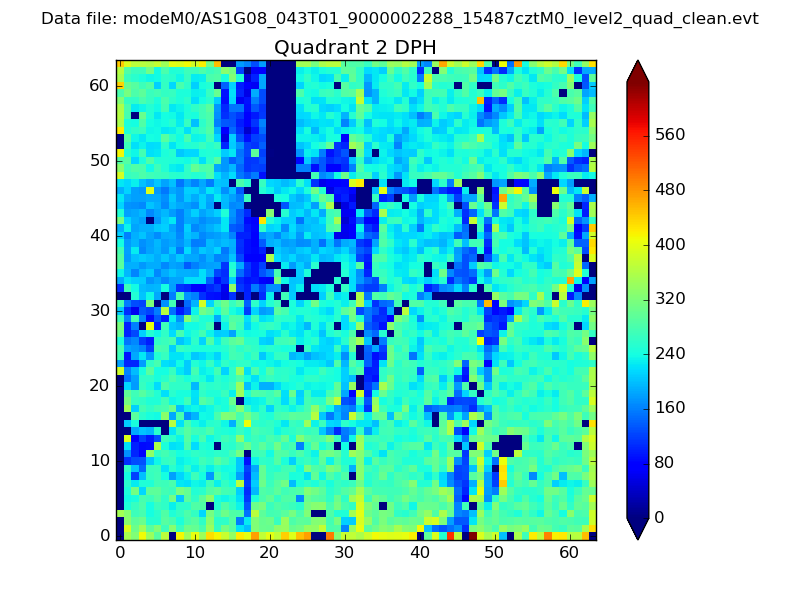 |
Quadrant C |
| Plot type | Count rate plots | Images |
|---|---|---|
| Comparison with Poisson distribution Blue bars denote a histogram of data divided into 1 sec bins. Red curve is a Poisson curve with rate = median count rate of data. |
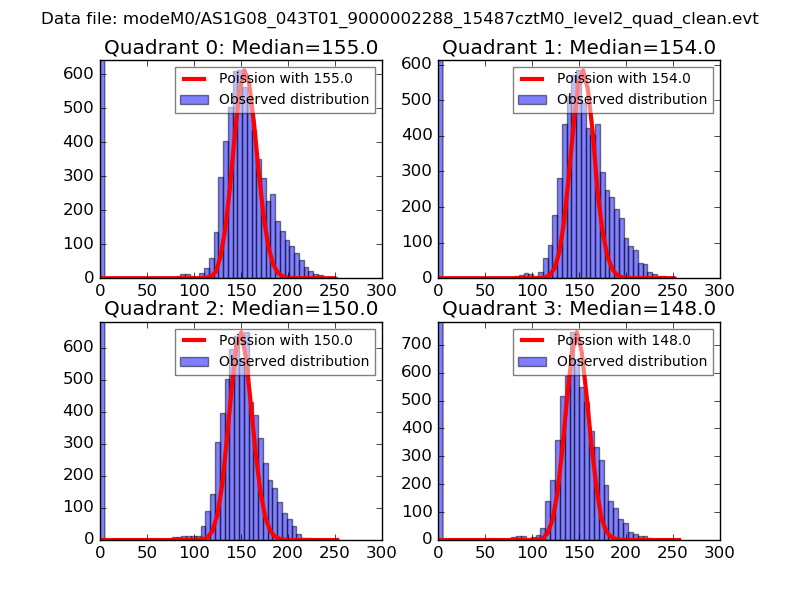 |
 |
| Quadrant-wise count rates Data is divided into 100 sec bins |
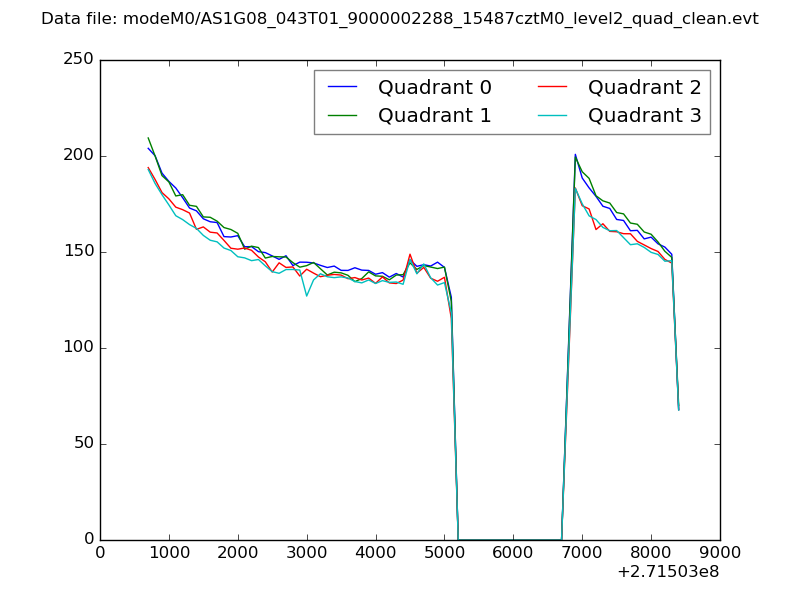 |
|
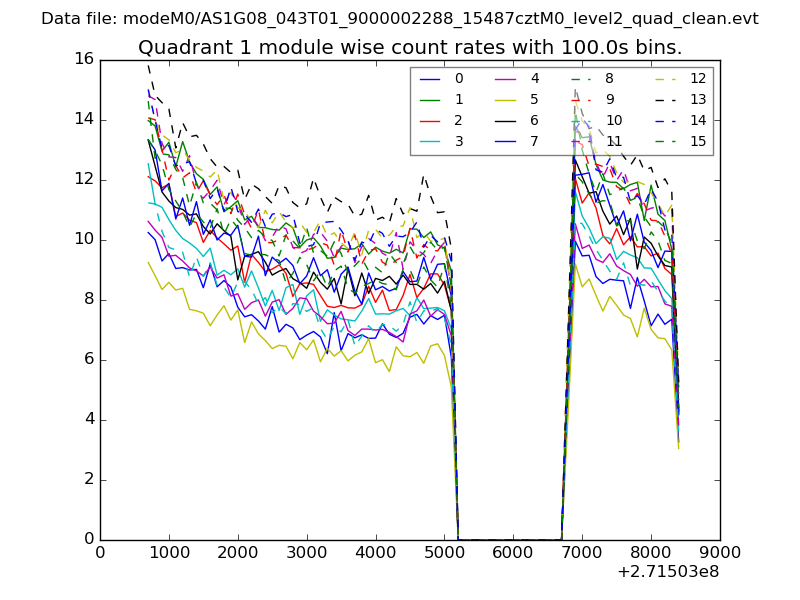
| Module-wise count rates for Quadrant A Data is divided into 100 sec bins |
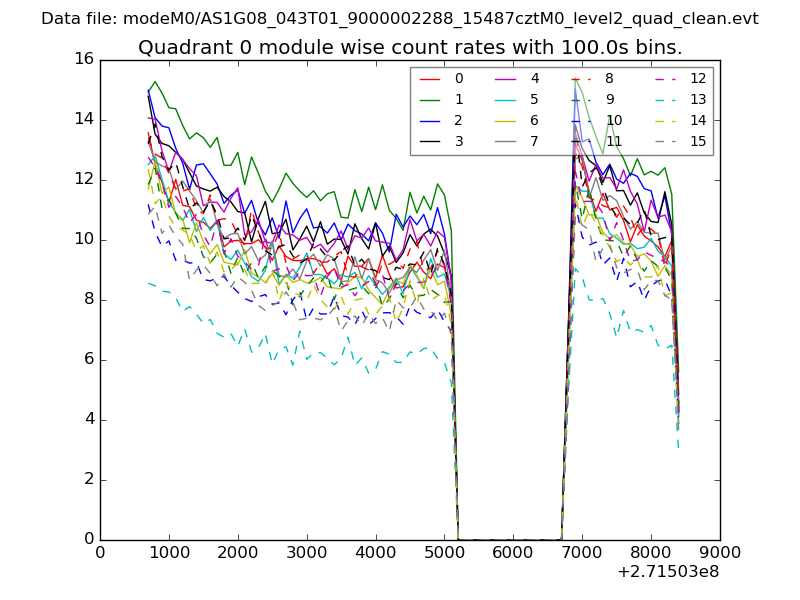 |
 |
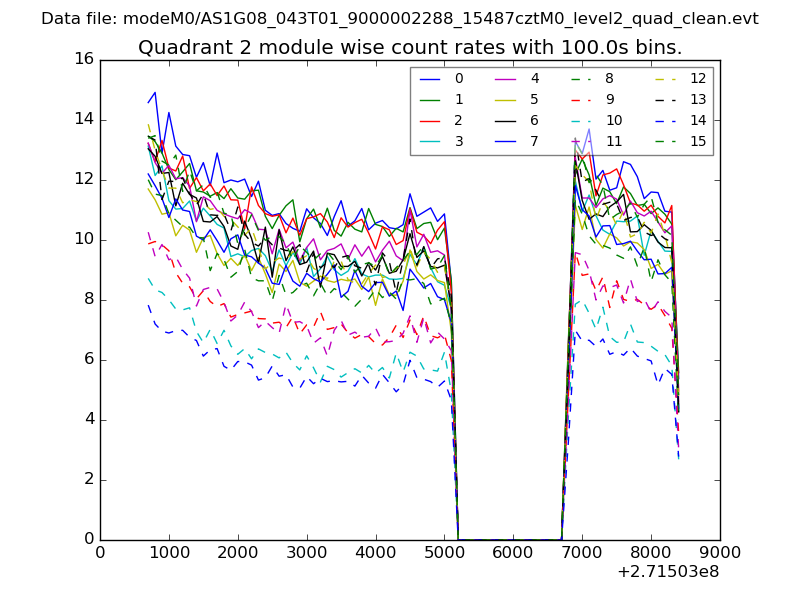
| Module-wise count rates for Quadrant B Data is divided into 100 sec bins |
 |
 |
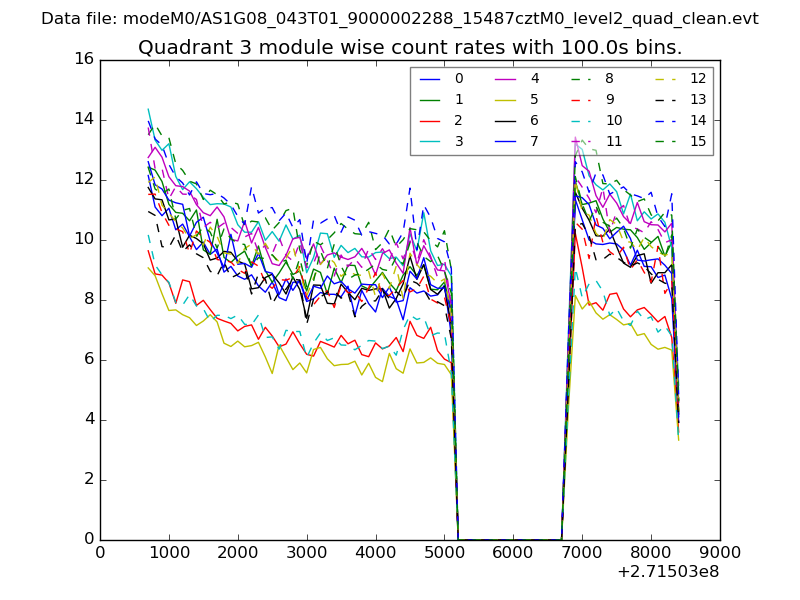
| Module-wise count rates for Quadrant C Data is divided into 100 sec bins |
 |
 |
| Module-wise count rates for Quadrant D Data is divided into 100 sec bins |
 |
 |
| Parameter | Plot |
|---|---|
| CZT HV Monitor | 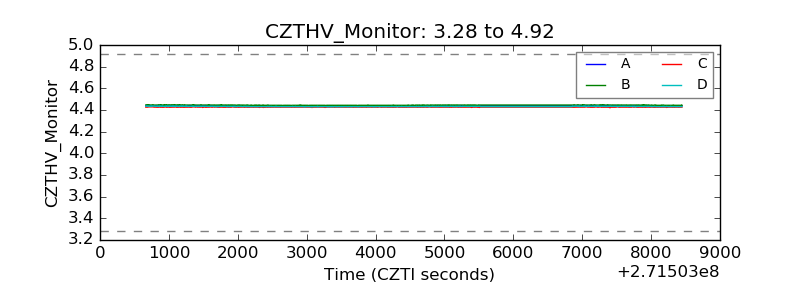 |
| D_VDD | 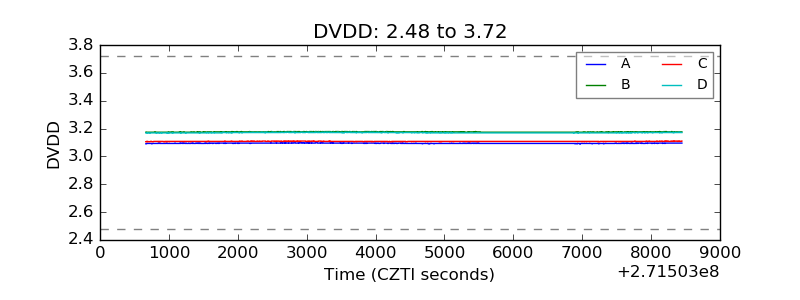 |
| Temperature 1 | 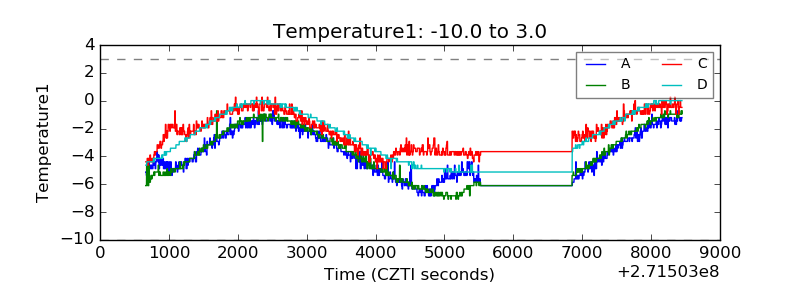 |
| Veto HV Monitor | 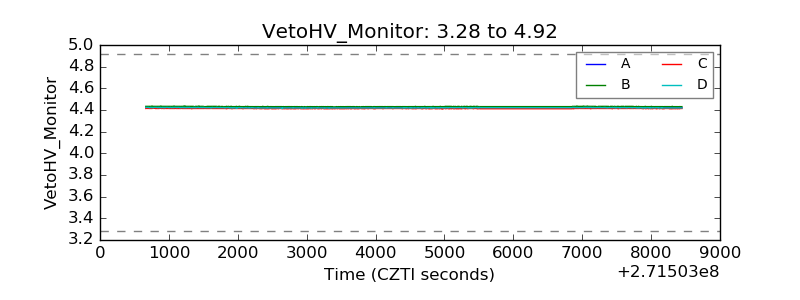 |
| Veto LLD | 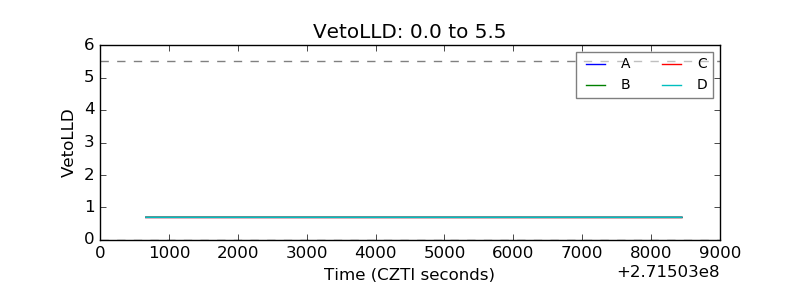 |
| Alpha Counter | 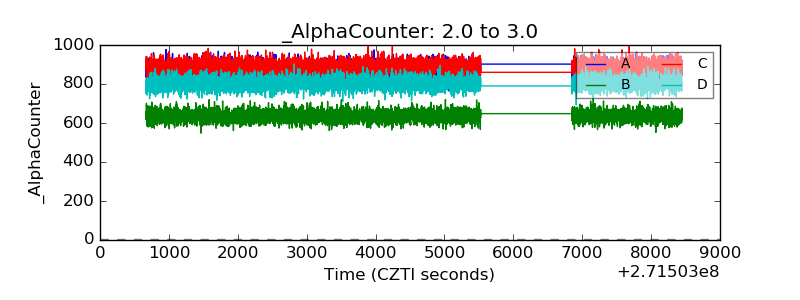 |
| _CPM_Rate | 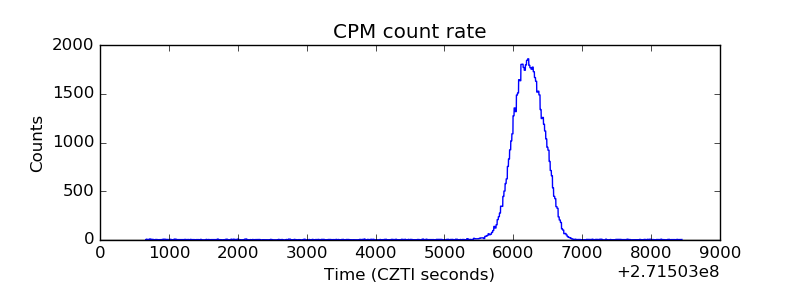 |
| CZT Counter | 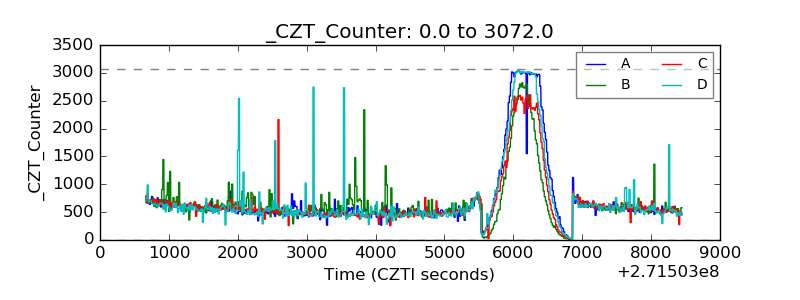 |
| +2.5 Volts monitor |  |
| +5 Volts monitor |  |
| _ROLL_ROT | 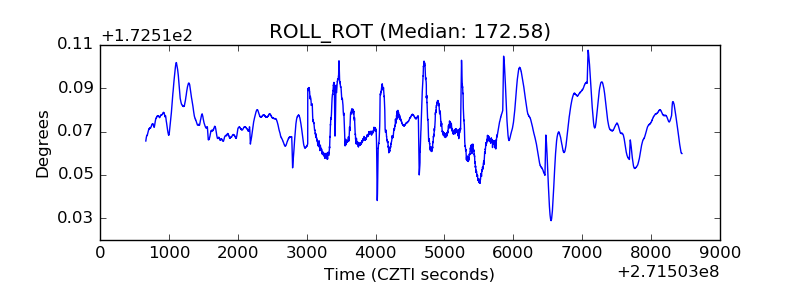 |
| _Roll_DEC | 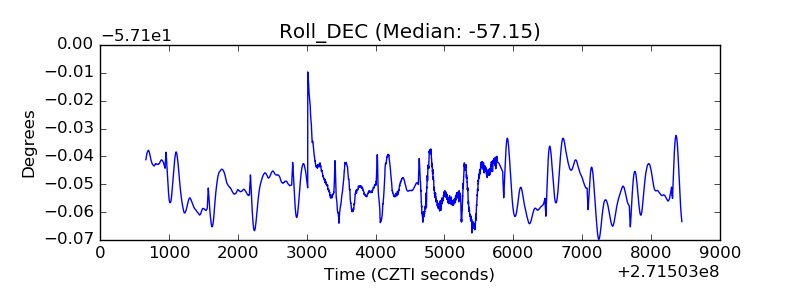 |
| _Roll_RA | 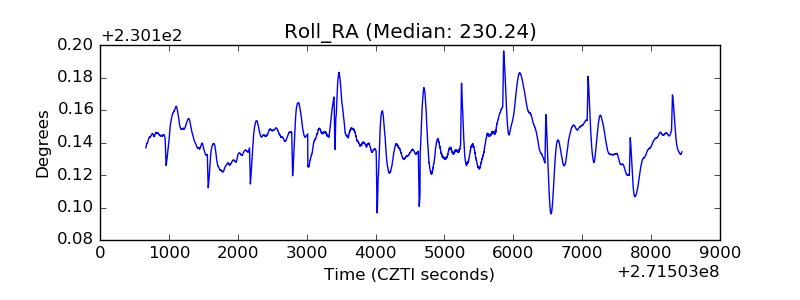 |
| Veto Counter | 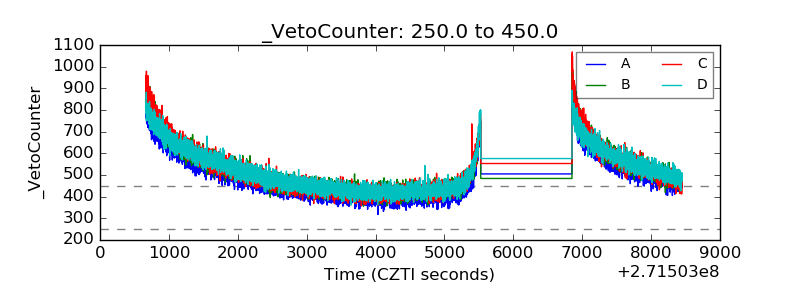 |