| Param | Original file | Final file |
|---|---|---|
| Filename | modeM0/AS1G08_043T01_9000002288_15489cztM0_level2.evt | modeM0/AS1G08_043T01_9000002288_15489cztM0_level2_quad_clean.evt |
| Size (bytes) | 256,029,120 | 65,551,680 |
| Size | 244.2 MB | 62.5 MB |
| Events in quadrant A | 1,549,506 | 454,678 |
| Events in quadrant B | 1,609,739 | 453,106 |
| Events in quadrant C | 1,487,318 | 437,213 |
| Events in quadrant D | 2,885,899 | 410,175 |
| Mode SS | |||
|---|---|---|---|
| Quadrant | BADHDUFLAG | Total packets | Discarded packets |
| A | 0 | 64 | 0 |
| B | 0 | 64 | 0 |
| C | 0 | 64 | 0 |
| D | 0 | 64 | 0 |
| Mode M0 | |||
|---|---|---|---|
| Quadrant | BADHDUFLAG | Total packets | Discarded packets |
| A | 0 | 6669 | 0 |
| B | 0 | 6763 | 0 |
| C | 0 | 6570 | 0 |
| D | 0 | 10740 | 0 |
| Quadrant | Total seconds | Saturated seconds | Saturation percentage |
|---|---|---|---|
| A | 3239 | 5 | 0.154369% |
| B | 3239 | 1 | 0.030874% |
| C | 3239 | 4 | 0.123495% |
| D | 3239 | 319 | 9.848719% |
Noise dominated data is calculated using 1-second bins in cleaned event files. If a bin has >2000 counts, and if more than 50% of those come from <1% of pixels, then it is considered to be noise-dominated and hence unusable.
| Quadrant | # 1 sec bins | Bins with >0 counts | Bins with >2000 counts | High rate bins dominated by noise | Noise dominated (total time) | Noise dominated (detector-on time) | Marked lightcurve |
|---|---|---|---|---|---|---|---|
| A | 3240 | 3240 | 1 | 1 | 0.03% | 0.03% | 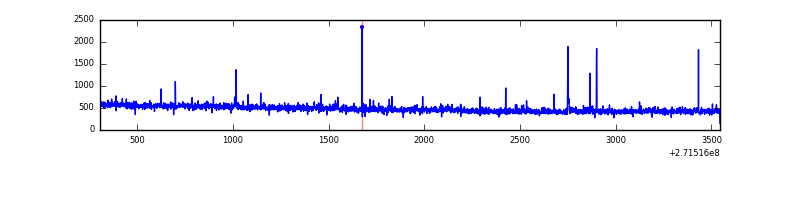 |
| B | 3240 | 3240 | 1 | 1 | 0.03% | 0.03% | 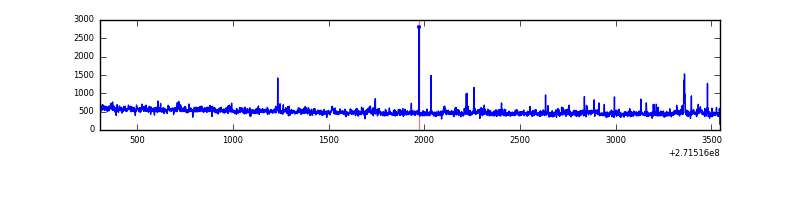 |
| C | 3240 | 3240 | 0 | 0 | 0.00% | 0.00% | 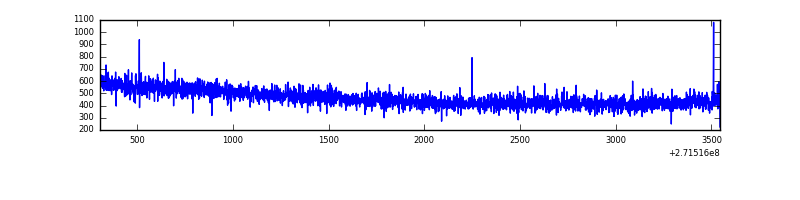 |
| D | 3240 | 3240 | 304 | 304 | 9.38% | 9.38% | 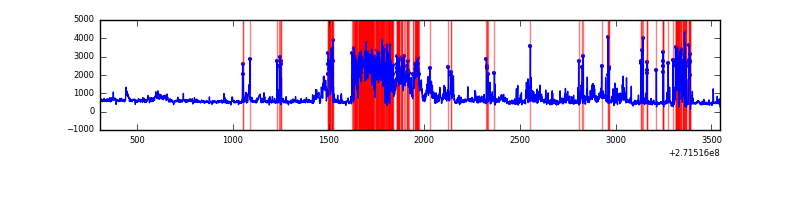 |
Top three noisy pixels from each quadrant. If the there are fewer than three noisy pixels in the level2.evt file, extra rows are filled as -1
| Pixel properties | Quadrant properties | ||||||
|---|---|---|---|---|---|---|---|
| Quadrant | DetID | PixID | Counts | Sigma | Mean | Median | Sigma |
| A | 0 | 253 | 14793 | 178.54 | 392 | 384 | 80.7 |
| A | 13 | 248 | 10268 | 122.47 | 392 | 384 | 80.7 |
| A | 15 | 249 | 7826 | 92.21 | 392 | 384 | 80.7 |
| B | 0 | 229 | 31720 | 429.2 | 384 | 376 | 73.0 |
| B | 0 | 189 | 12739 | 169.29 | 384 | 376 | 73.0 |
| B | 4 | 142 | 10914 | 144.3 | 384 | 376 | 73.0 |
| C | 14 | 238 | 57444 | 671.72 | 363 | 366 | 85.0 |
| C | 3 | 233 | 10248 | 116.3 | 363 | 366 | 85.0 |
| C | 13 | 61 | 2770 | 28.29 | 363 | 366 | 85.0 |
| D | 5 | 222 | 985614 | 11079.79 | 360 | 349 | 88.9 |
| D | 1 | 52 | 380369 | 4273.51 | 360 | 349 | 88.9 |
| D | 7 | 38 | 56803 | 634.85 | 360 | 349 | 88.9 |
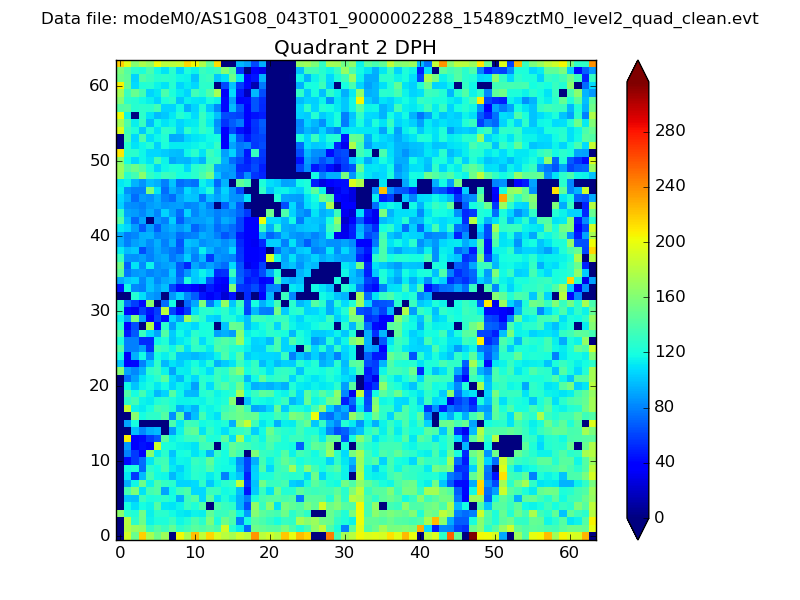
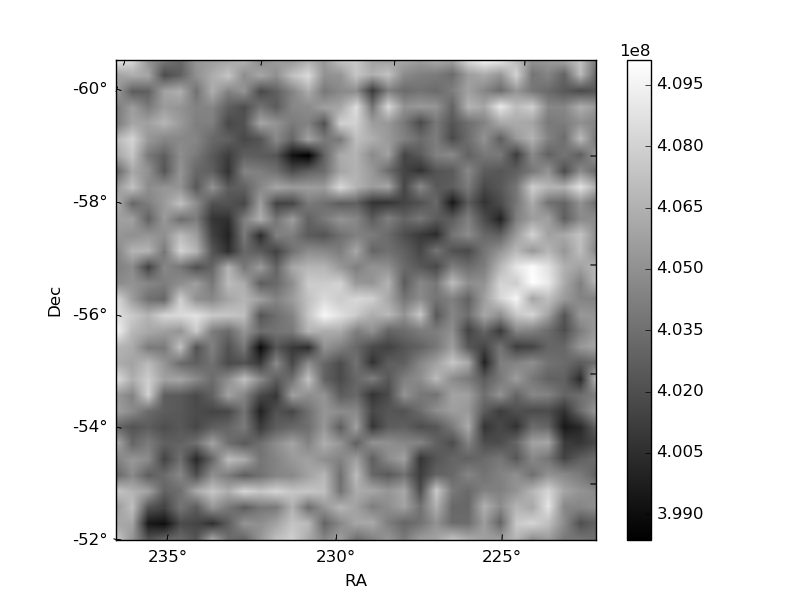
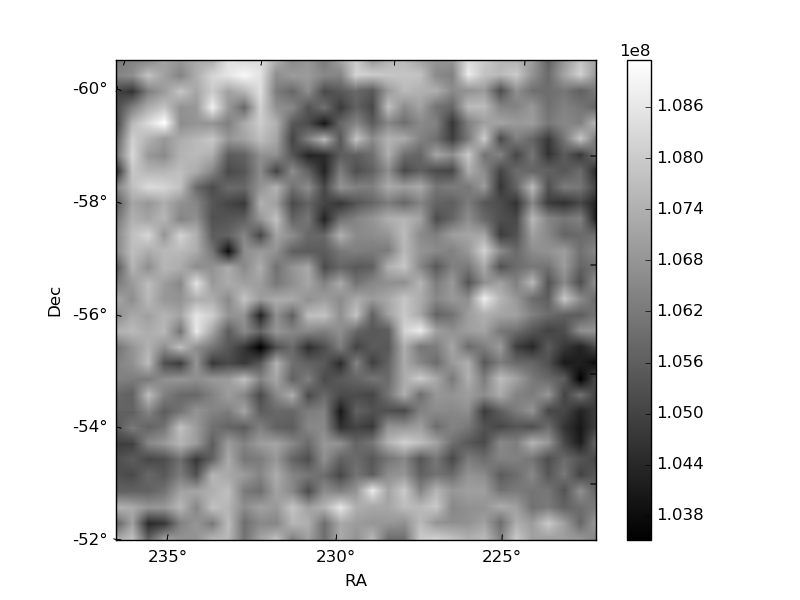
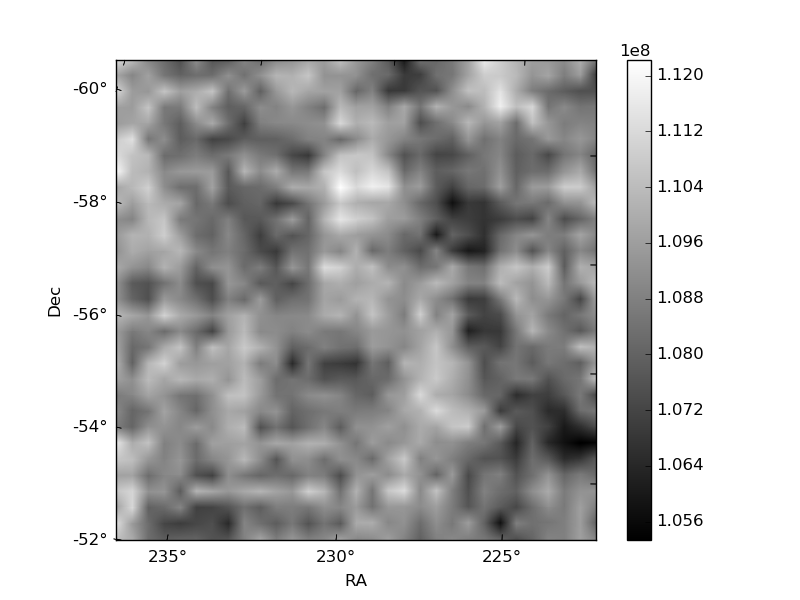
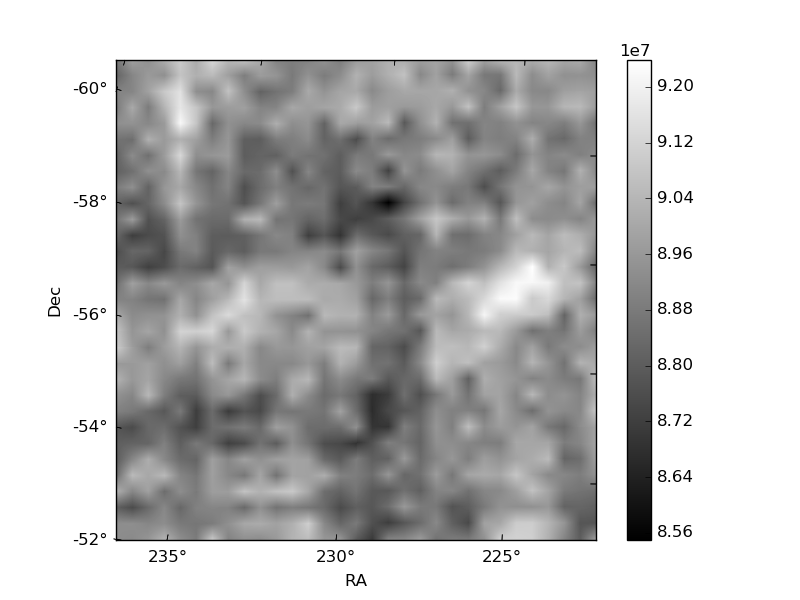
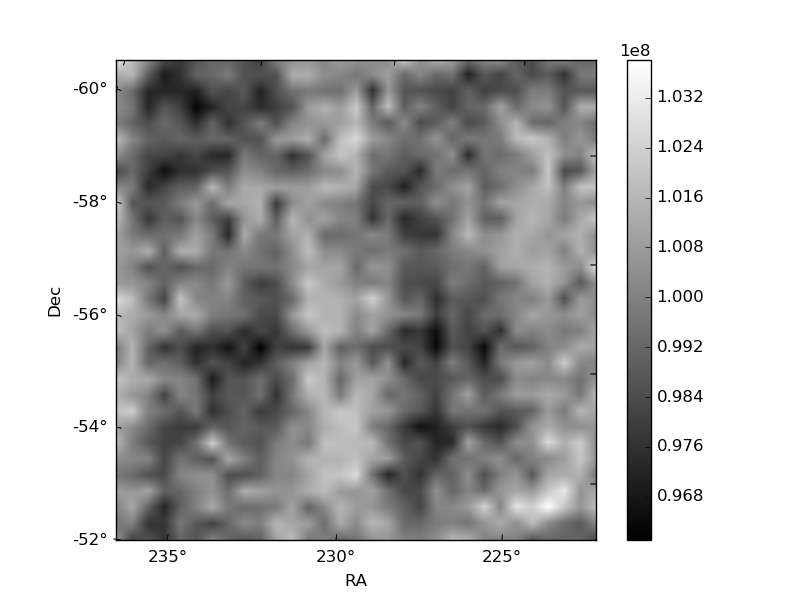
Histogram calculated using DETX and DETY for each event in the final _common_clean file
| Quadrant A | 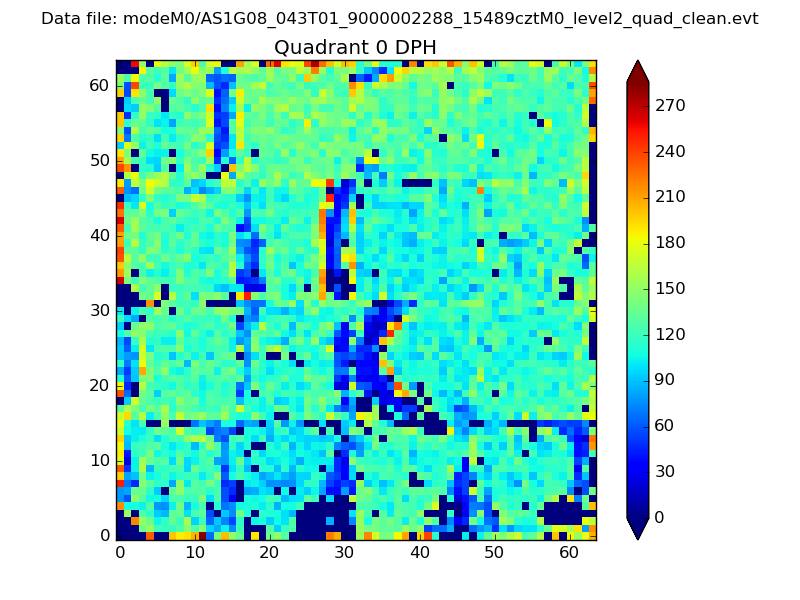 |
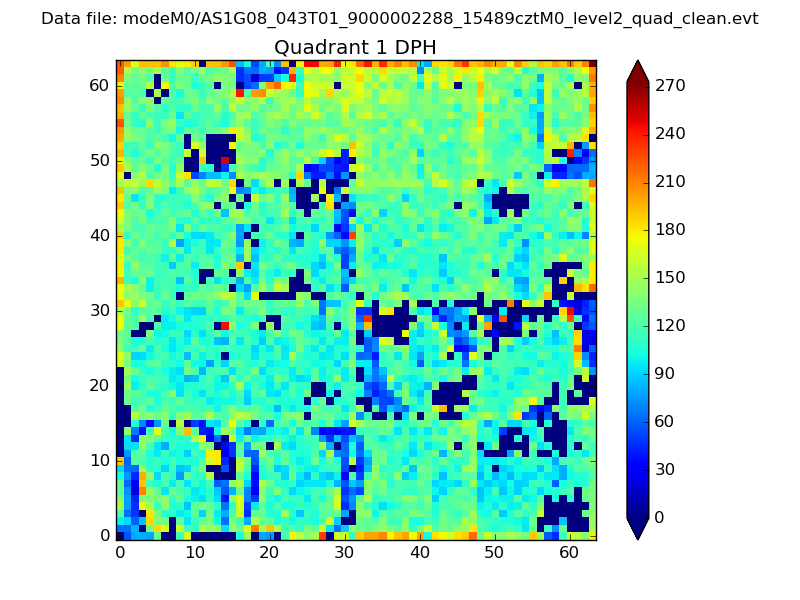 |
Quadrant B |
|---|---|---|---|
| Quadrant D | 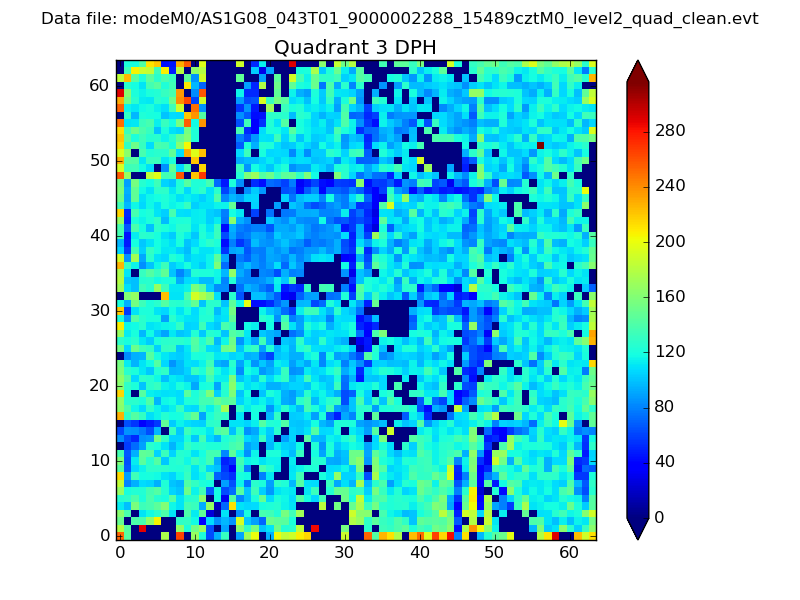 |
 |
Quadrant C |
| Plot type | Count rate plots | Images |
|---|---|---|
| Comparison with Poisson distribution Blue bars denote a histogram of data divided into 1 sec bins. Red curve is a Poisson curve with rate = median count rate of data. |
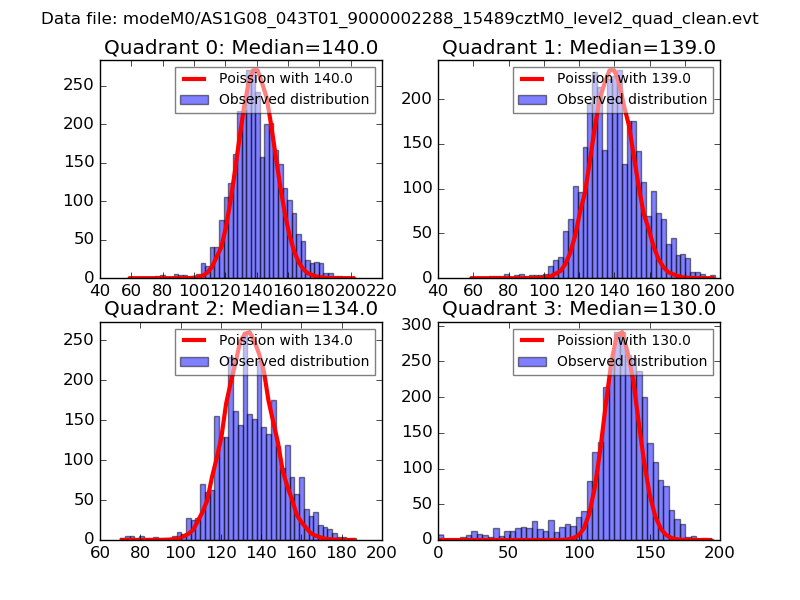 |
 |
| Quadrant-wise count rates Data is divided into 100 sec bins |
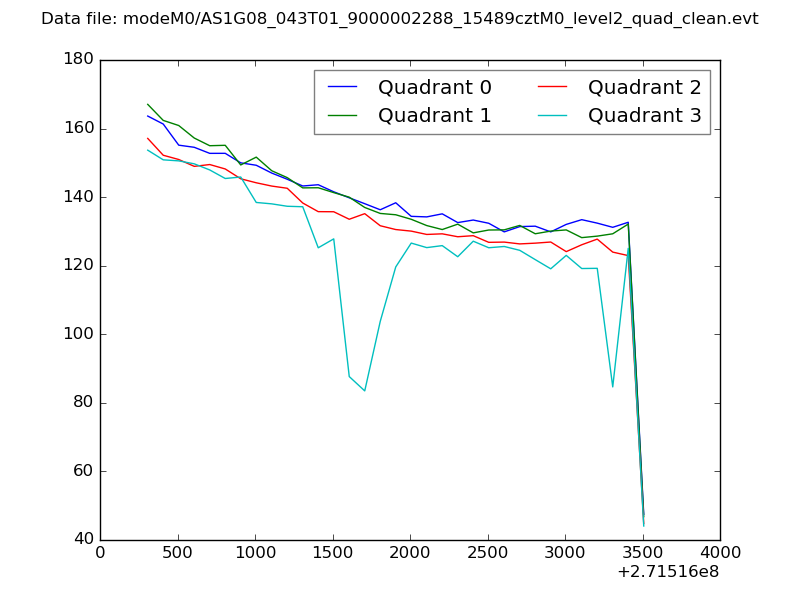 |
|
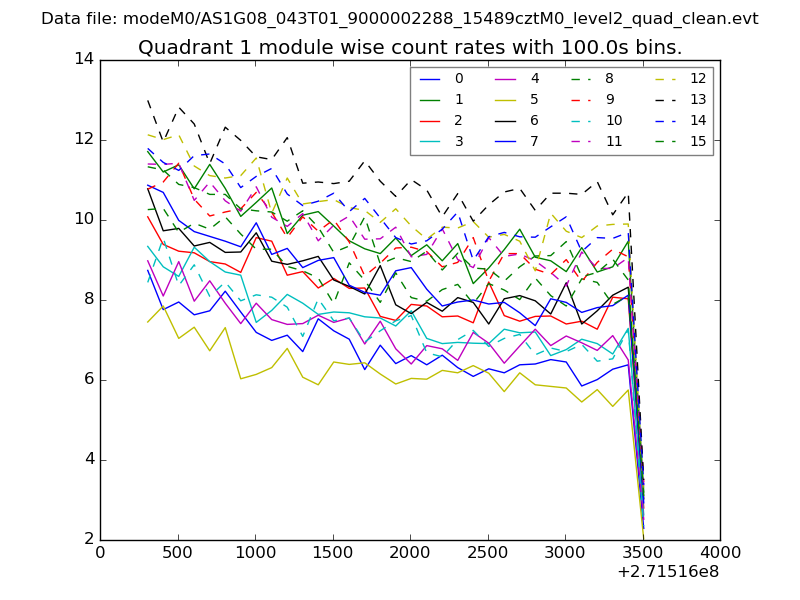
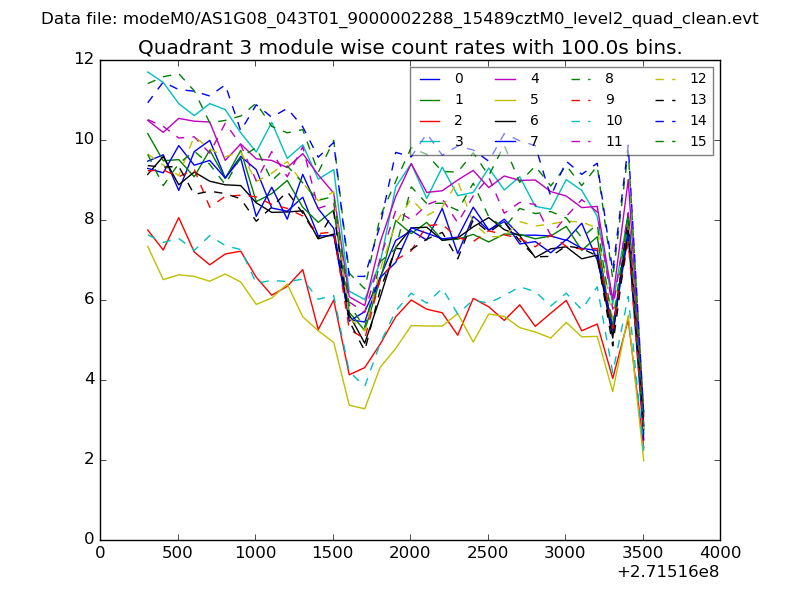
| Module-wise count rates for Quadrant A Data is divided into 100 sec bins |
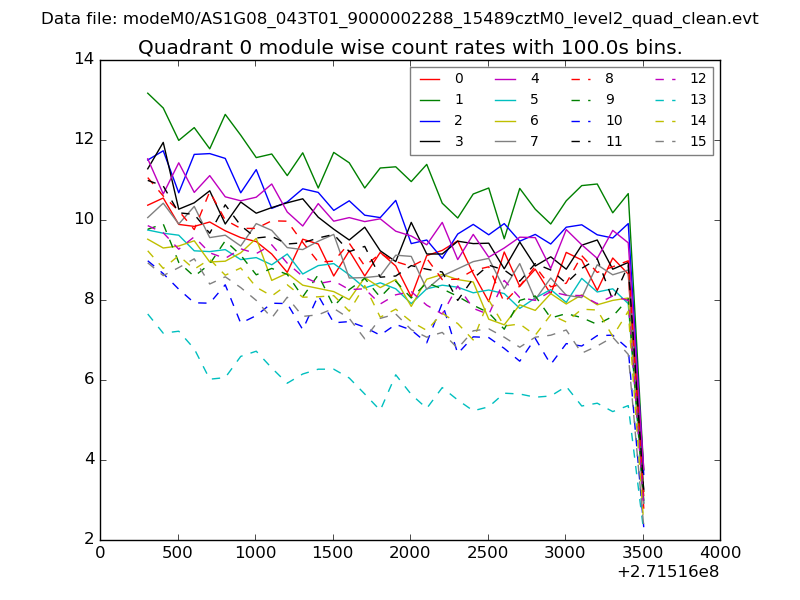 |
 |
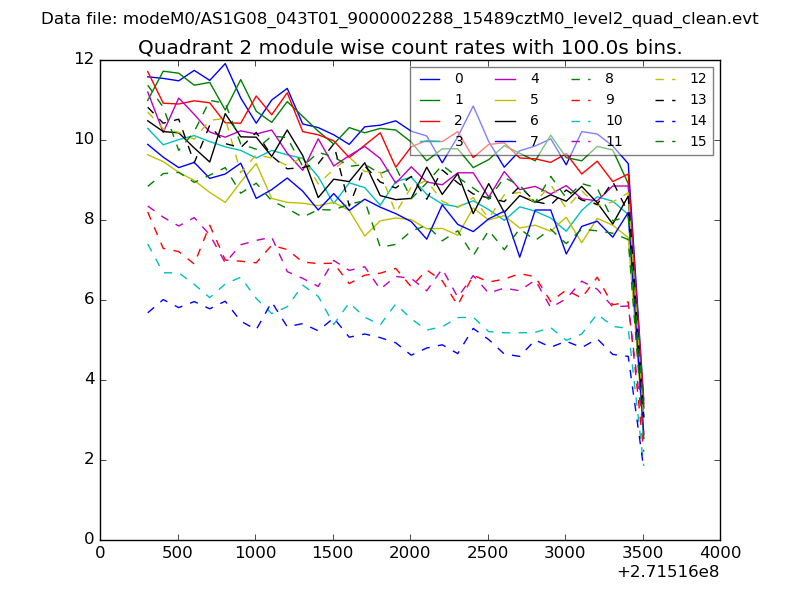
| Module-wise count rates for Quadrant B Data is divided into 100 sec bins |
 |
 |
| Module-wise count rates for Quadrant C Data is divided into 100 sec bins |
 |
 |
| Module-wise count rates for Quadrant D Data is divided into 100 sec bins |
 |
 |
| Parameter | Plot |
|---|---|
| CZT HV Monitor | 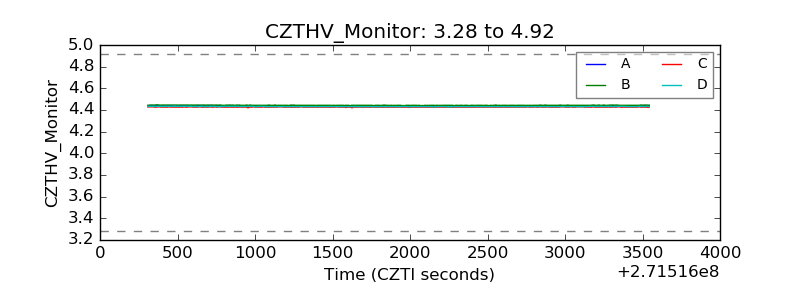 |
| D_VDD | 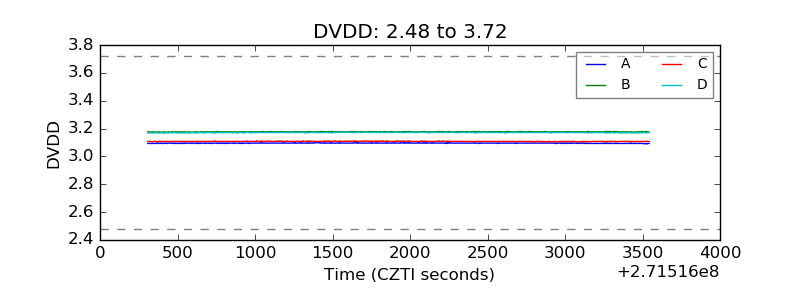 |
| Temperature 1 | 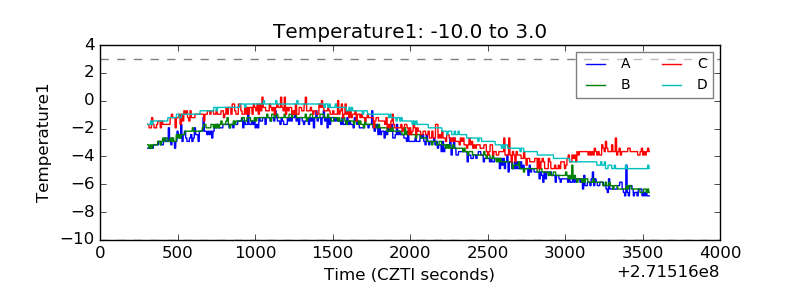 |
| Veto HV Monitor | 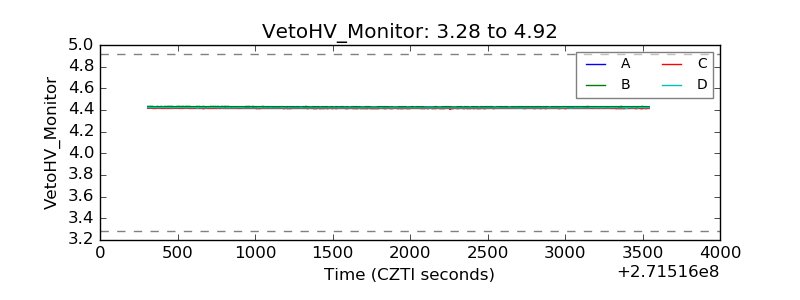 |
| Veto LLD | 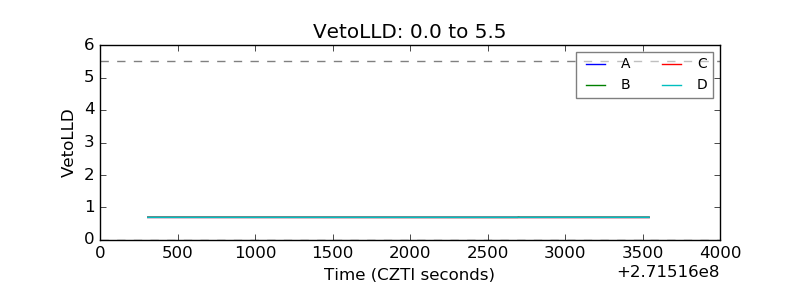 |
| Alpha Counter | 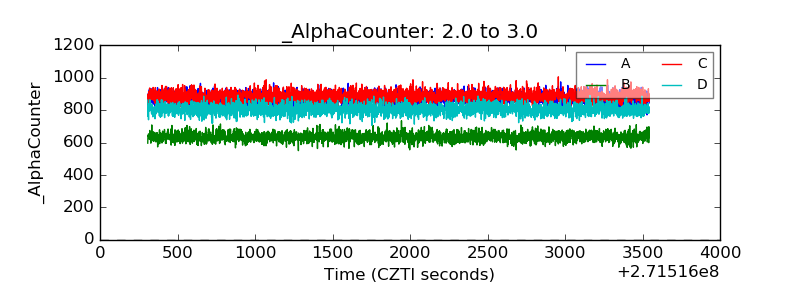 |
| _CPM_Rate | 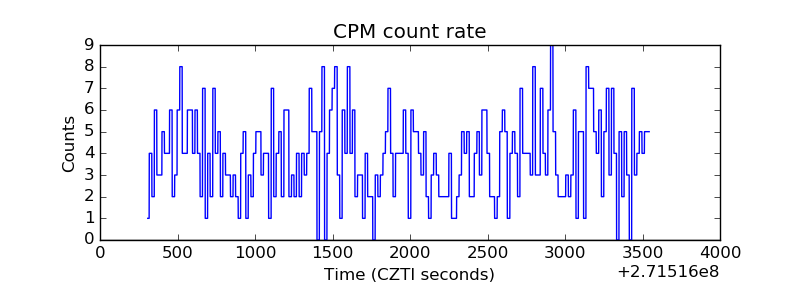 |
| CZT Counter | 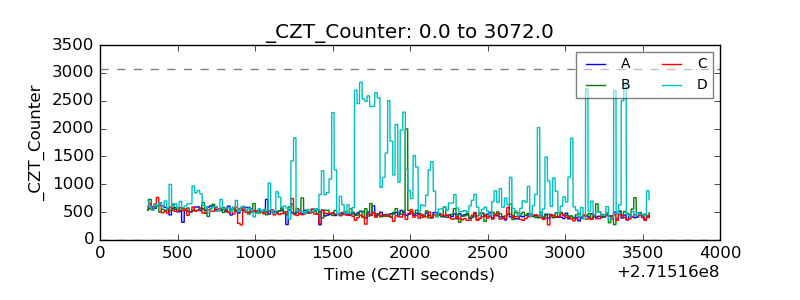 |
| +2.5 Volts monitor |  |
| +5 Volts monitor |  |
| _ROLL_ROT | 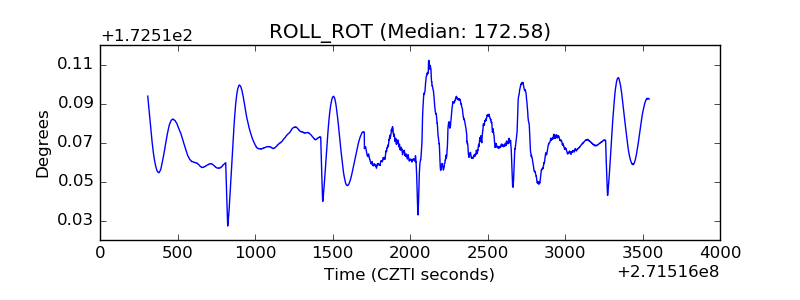 |
| _Roll_DEC | 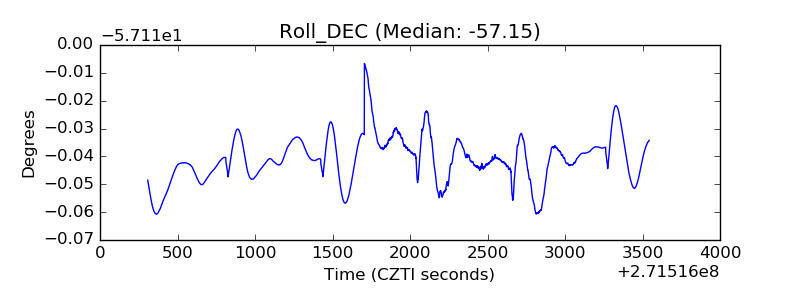 |
| _Roll_RA | 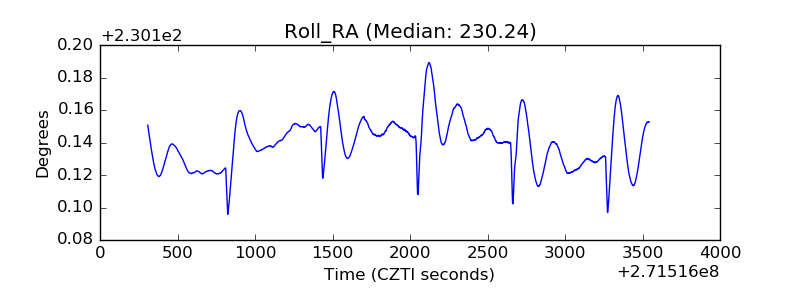 |
| Veto Counter | 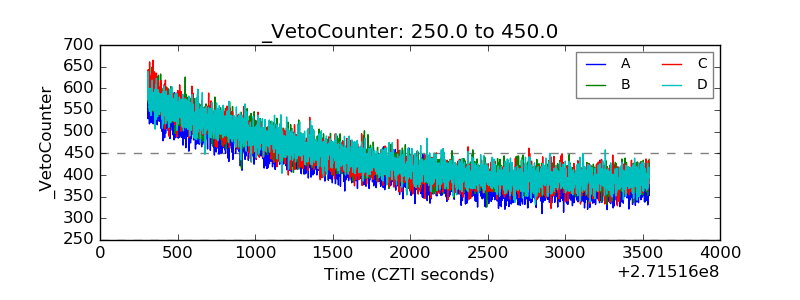 |