| Param | Original file | Final file |
|---|---|---|
| Filename | modeM0/AS1T02_078T01_9000002294cztM0_level2.fits | modeM0/AS1T02_078T01_9000002294cztM0_level2_quad_clean.evt |
| Size (bytes) | 160,620,480 | 144,555,840 |
| Size | 153.2 MB | 137.9 MB |
| Events in quadrant A | 1,002,620 | 851,954 |
| Events in quadrant B | 961,336 | 862,920 |
| Events in quadrant C | 984,750 | 841,906 |
| Events in quadrant D | 860,428 | 764,870 |
| Mode M9 | |||
|---|---|---|---|
| Quadrant | BADHDUFLAG | Total packets | Discarded packets |
| A | 0 | 35 | 0 |
| B | 0 | 35 | 0 |
| C | 0 | 35 | 0 |
| D | 0 | 35 | 0 |
| Mode SS | |||
|---|---|---|---|
| Quadrant | BADHDUFLAG | Total packets | Discarded packets |
| A | 0 | 312 | 0 |
| B | 0 | 312 | 0 |
| C | 0 | 312 | 0 |
| D | 0 | 312 | 0 |
| Mode M0 | |||
|---|---|---|---|
| Quadrant | BADHDUFLAG | Total packets | Discarded packets |
| A | 0 | 34649 | 0 |
| B | 0 | 34008 | 0 |
| C | 0 | 33916 | 0 |
| D | 0 | 38031 | 0 |
| Quadrant | Total seconds | Saturated seconds | Saturation percentage |
|---|---|---|---|
| A | 15295 | 301 | 1.967963% |
| B | 15295 | 184 | 1.203008% |
| C | 15295 | 238 | 1.556064% |
| D | 15295 | 427 | 2.791762% |
Noise dominated data is calculated using 1-second bins in cleaned event files. If a bin has >2000 counts, and if more than 50% of those come from <1% of pixels, then it is considered to be noise-dominated and hence unusable.
| Quadrant | # 1 sec bins | Bins with >0 counts | Bins with >2000 counts | High rate bins dominated by noise | Noise dominated (total time) | Noise dominated (detector-on time) | Marked lightcurve |
|---|---|---|---|---|---|---|---|
| A | 18800 | 15293 | 0 | 0 | 0.00% | 0.00% |  |
| B | 18800 | 15293 | 0 | 0 | 0.00% | 0.00% |  |
| C | 18800 | 15293 | 0 | 0 | 0.00% | 0.00% |  |
| D | 18800 | 15292 | 0 | 0 | 0.00% | 0.00% |  |
Top three noisy pixels from each quadrant. If the there are fewer than three noisy pixels in the level2.evt file, extra rows are filled as -1
| Pixel properties | Quadrant properties | ||||||
|---|---|---|---|---|---|---|---|
| Quadrant | DetID | PixID | Counts | Sigma | Mean | Median | Sigma |
| A | 0 | 29 | 982 | 11.61 | 261 | 248 | 63.2 |
| A | 7 | 110 | 799 | 8.72 | 261 | 248 | 63.2 |
| A | 9 | 19 | 781 | 8.43 | 261 | 248 | 63.2 |
| B | 2 | 9 | 794 | 11.0 | 254 | 244 | 50.0 |
| B | 5 | 128 | 685 | 8.82 | 254 | 244 | 50.0 |
| B | 14 | 254 | 645 | 8.02 | 254 | 244 | 50.0 |
| C | 1 | 81 | 781 | 7.97 | 260 | 246 | 67.1 |
| C | 1 | 80 | 740 | 7.36 | 260 | 246 | 67.1 |
| C | 2 | 191 | 682 | 6.5 | 260 | 246 | 67.1 |
| D | 10 | 189 | 638 | 6.18 | 246 | 226 | 66.7 |
| D | 6 | 231 | 622 | 5.94 | 246 | 226 | 66.7 |
| D | 3 | 14 | 615 | 5.83 | 246 | 226 | 66.7 |
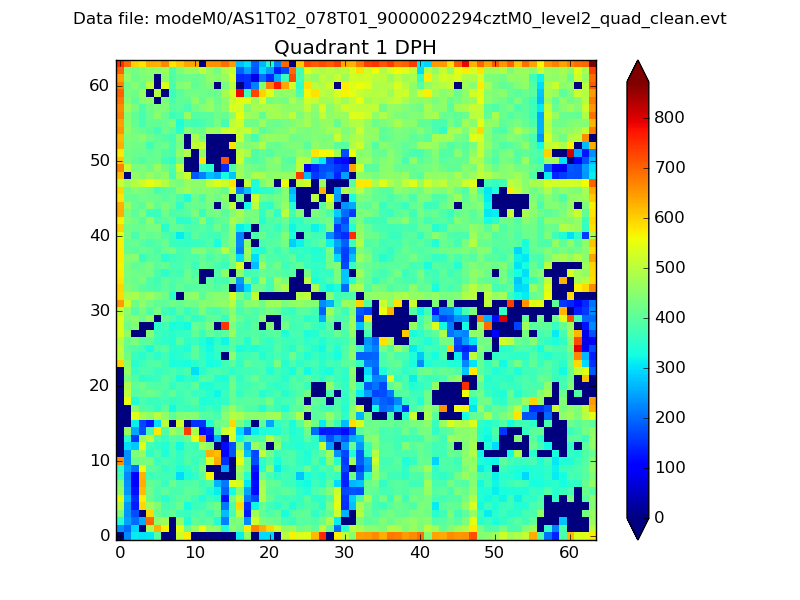
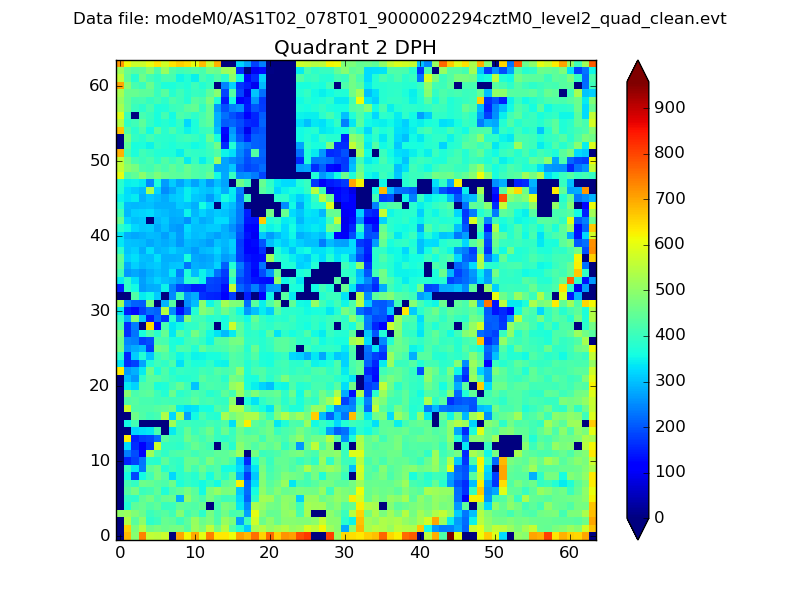
Histogram calculated using DETX and DETY for each event in the final _common_clean file
| Quadrant A |  |
 |
Quadrant B |
|---|---|---|---|
| Quadrant D |  |
 |
Quadrant C |
| Plot type | Count rate plots | Images |
|---|---|---|
| Comparison with Poisson distribution Blue bars denote a histogram of data divided into 1 sec bins. Red curve is a Poisson curve with rate = median count rate of data. |
 |
 |
| Quadrant-wise count rates Data is divided into 100 sec bins |
 |
|
| Module-wise count rates for Quadrant A Data is divided into 100 sec bins |
 |
 |
| Module-wise count rates for Quadrant B Data is divided into 100 sec bins |
 |
 |
| Module-wise count rates for Quadrant C Data is divided into 100 sec bins |
 |
 |
| Module-wise count rates for Quadrant D Data is divided into 100 sec bins |
 |
 |
| Parameter | Plot |
|---|---|
| CZT HV Monitor |  |
| D_VDD |  |
| Temperature 1 |  |
| Veto HV Monitor |  |
| Veto LLD |  |
| Alpha Counter |  |
| _CPM_Rate |  |
| CZT Counter |  |
| +2.5 Volts monitor |  |
| +5 Volts monitor |  |
| _ROLL_ROT |  |
| _Roll_DEC |  |
| _Roll_RA |  |
| Veto Counter |  |