| Param | Original file | Final file |
|---|---|---|
| Filename | modeM0/AS1T02_078T01_9000002294_15497cztM0_level2.evt | modeM0/AS1T02_078T01_9000002294_15497cztM0_level2_quad_clean.evt |
| Size (bytes) | 176,955,840 | 23,186,880 |
| Size | 168.8 MB | 22.1 MB |
| Events in quadrant A | 1,183,341 | 134,887 |
| Events in quadrant B | 1,259,315 | 135,386 |
| Events in quadrant C | 1,278,980 | 131,170 |
| Events in quadrant D | 1,475,276 | 130,408 |
| Mode M9 | |||
|---|---|---|---|
| Quadrant | BADHDUFLAG | Total packets | Discarded packets |
| A | 0 | 11 | 0 |
| B | 0 | 11 | 0 |
| C | 0 | 11 | 0 |
| D | 0 | 11 | 0 |
| Mode SS | |||
|---|---|---|---|
| Quadrant | BADHDUFLAG | Total packets | Discarded packets |
| A | 0 | 48 | 0 |
| B | 0 | 48 | 0 |
| C | 0 | 48 | 0 |
| D | 0 | 48 | 0 |
| Mode M0 | |||
|---|---|---|---|
| Quadrant | BADHDUFLAG | Total packets | Discarded packets |
| A | 0 | 4935 | 2 |
| B | 0 | 5144 | 1 |
| C | 0 | 5176 | 1 |
| D | 0 | 5890 | 1 |
| Quadrant | Total seconds | Saturated seconds | Saturation percentage |
|---|---|---|---|
| A | 2358 | 25 | 1.060221% |
| B | 2358 | 31 | 1.314673% |
| C | 2358 | 52 | 2.205259% |
| D | 2358 | 101 | 4.283291% |
Noise dominated data is calculated using 1-second bins in cleaned event files. If a bin has >2000 counts, and if more than 50% of those come from <1% of pixels, then it is considered to be noise-dominated and hence unusable.
| Quadrant | # 1 sec bins | Bins with >0 counts | Bins with >2000 counts | High rate bins dominated by noise | Noise dominated (total time) | Noise dominated (detector-on time) | Marked lightcurve |
|---|---|---|---|---|---|---|---|
| A | 3419 | 2360 | 1 | 1 | 0.03% | 0.04% | 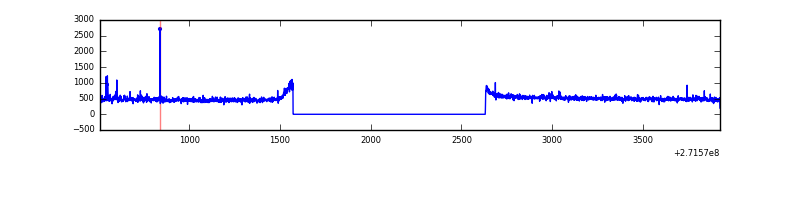 |
| B | 3419 | 2359 | 2 | 2 | 0.06% | 0.08% | 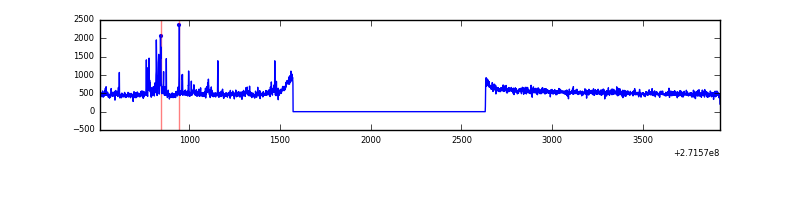 |
| C | 3419 | 2359 | 0 | 0 | 0.00% | 0.00% | 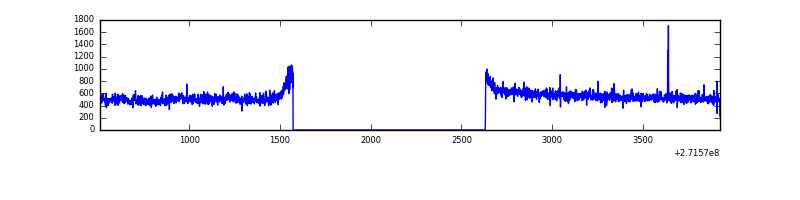 |
| D | 3419 | 2360 | 63 | 63 | 1.84% | 2.67% | 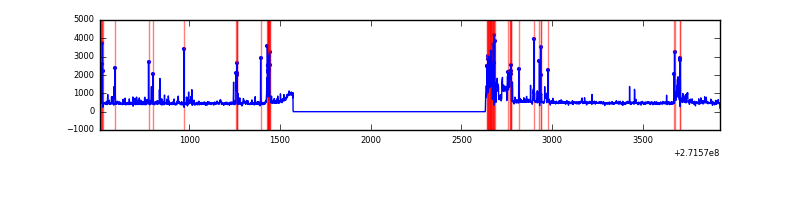 |
Top three noisy pixels from each quadrant. If the there are fewer than three noisy pixels in the level2.evt file, extra rows are filled as -1
| Pixel properties | Quadrant properties | ||||||
|---|---|---|---|---|---|---|---|
| Quadrant | DetID | PixID | Counts | Sigma | Mean | Median | Sigma |
| A | 14 | 238 | 7903 | 121.97 | 301 | 295 | 62.4 |
| A | 0 | 253 | 5852 | 89.09 | 301 | 295 | 62.4 |
| A | 14 | 237 | 4634 | 69.56 | 301 | 295 | 62.4 |
| B | 10 | 245 | 19188 | 318.82 | 304 | 297 | 59.3 |
| B | 0 | 197 | 17835 | 295.98 | 304 | 297 | 59.3 |
| B | 4 | 142 | 15986 | 264.78 | 304 | 297 | 59.3 |
| C | 3 | 233 | 90218 | 1312.67 | 291 | 292 | 68.5 |
| C | 14 | 238 | 45970 | 666.77 | 291 | 292 | 68.5 |
| C | 9 | 54 | 3928 | 53.08 | 291 | 292 | 68.5 |
| D | 7 | 223 | 170303 | 2371.46 | 290 | 281 | 71.7 |
| D | 1 | 52 | 118580 | 1650.03 | 290 | 281 | 71.7 |
| D | 7 | 38 | 71616 | 994.98 | 290 | 281 | 71.7 |
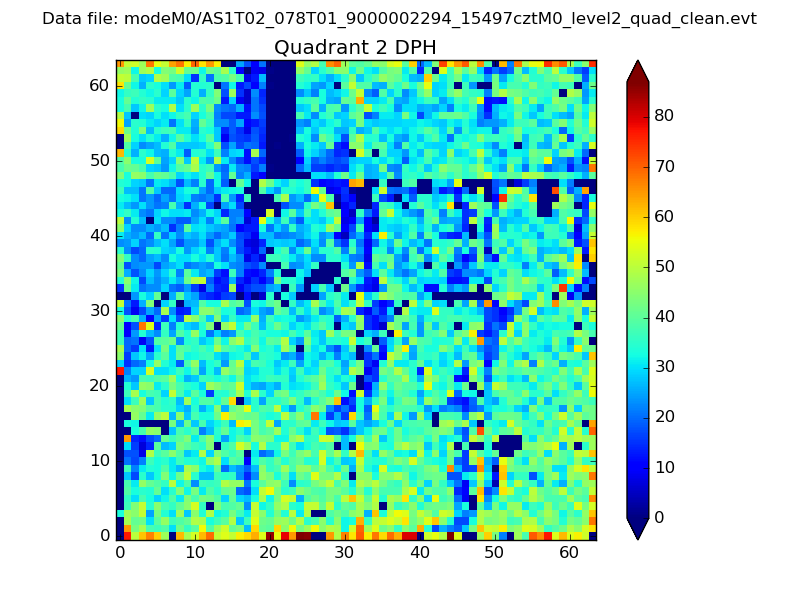
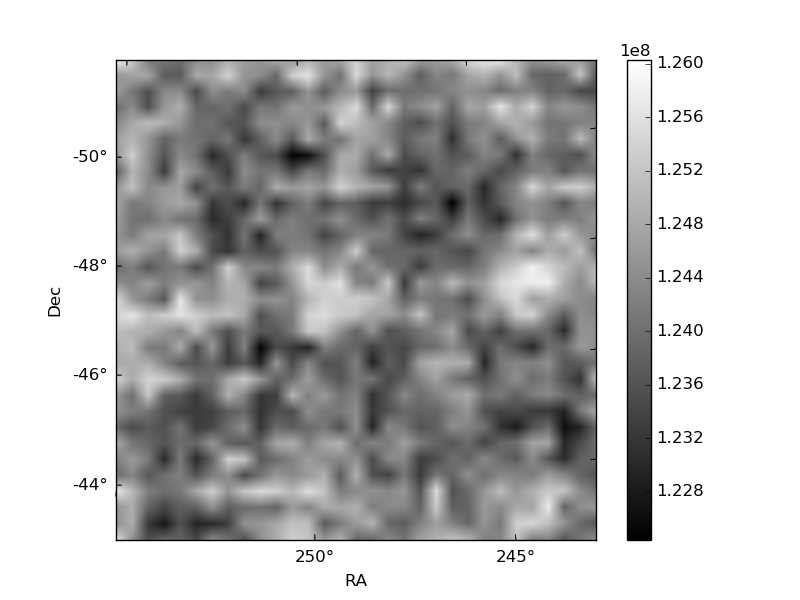
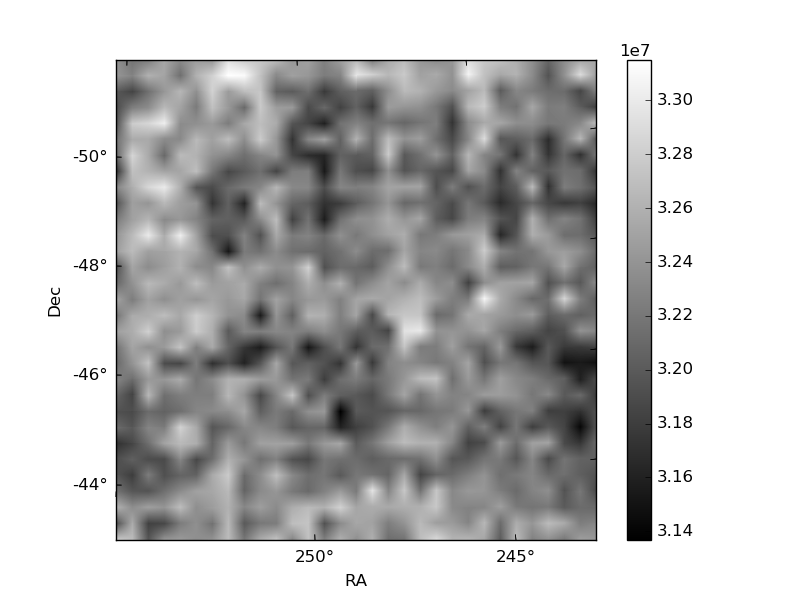
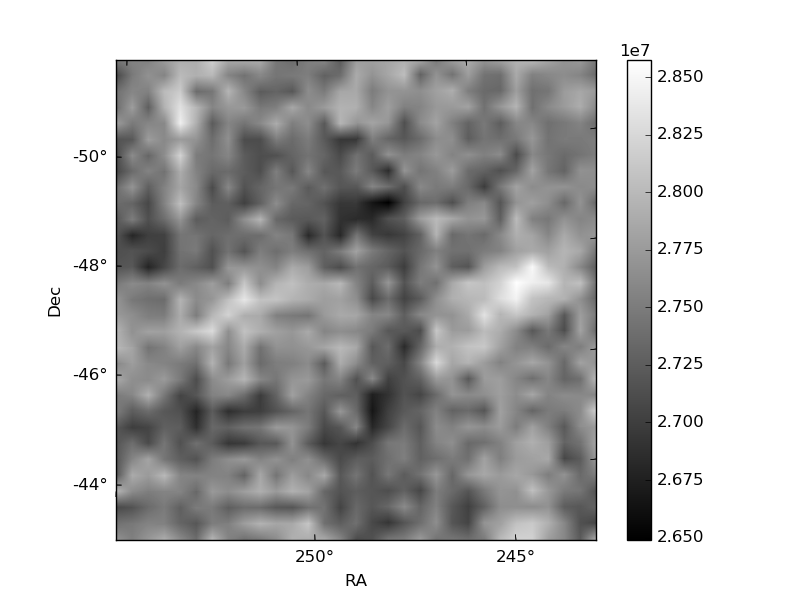
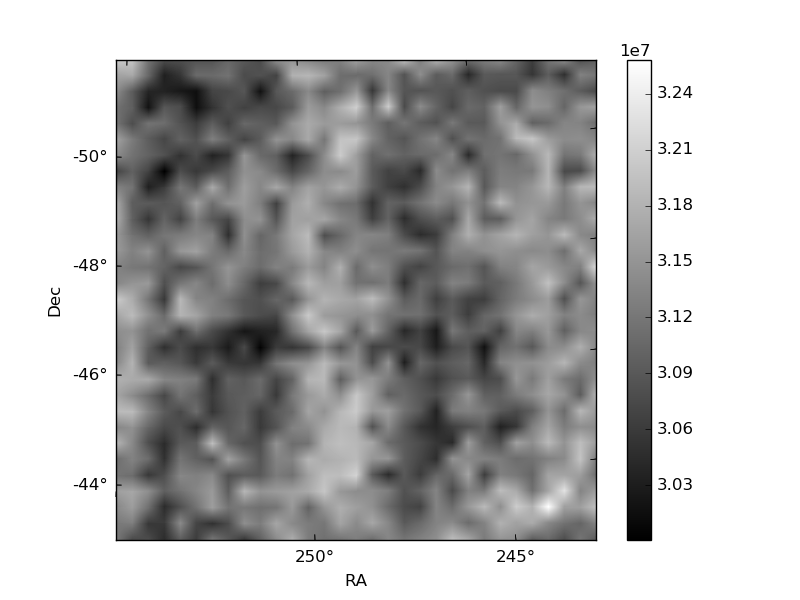
Histogram calculated using DETX and DETY for each event in the final _common_clean file
| Quadrant A | 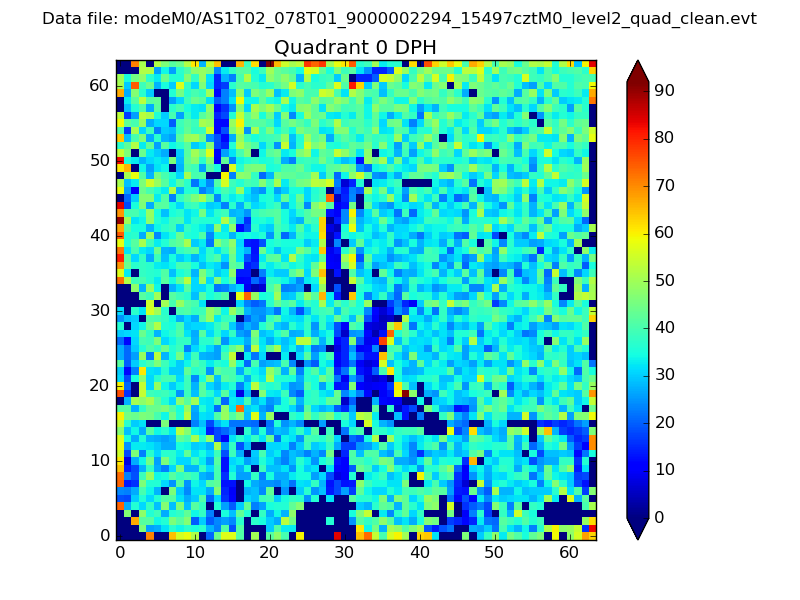 |
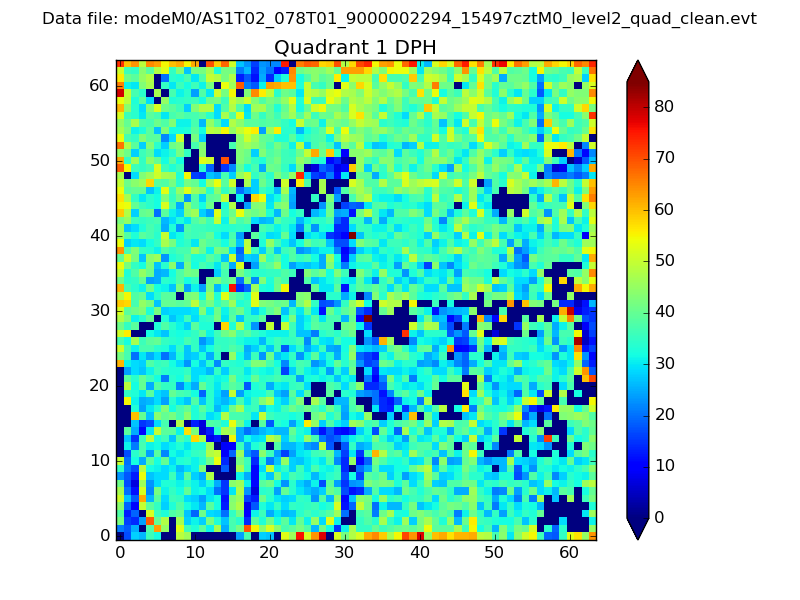 |
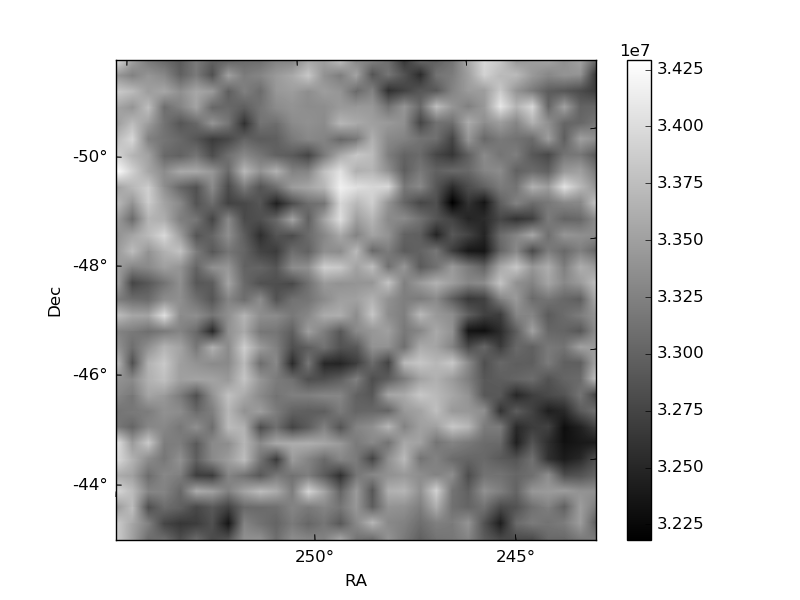
Quadrant B |
|---|---|---|---|
| Quadrant D | 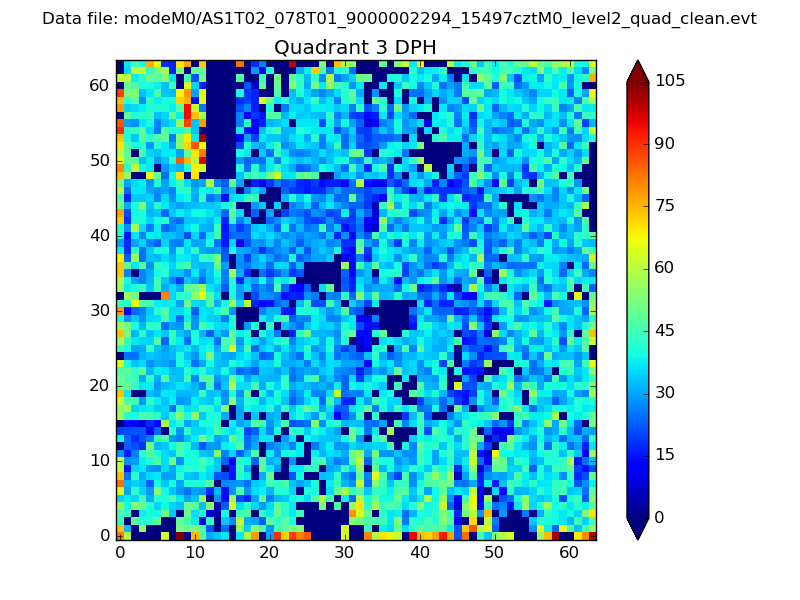 |
 |
Quadrant C |
| Plot type | Count rate plots | Images |
|---|---|---|
| Comparison with Poisson distribution Blue bars denote a histogram of data divided into 1 sec bins. Red curve is a Poisson curve with rate = median count rate of data. |
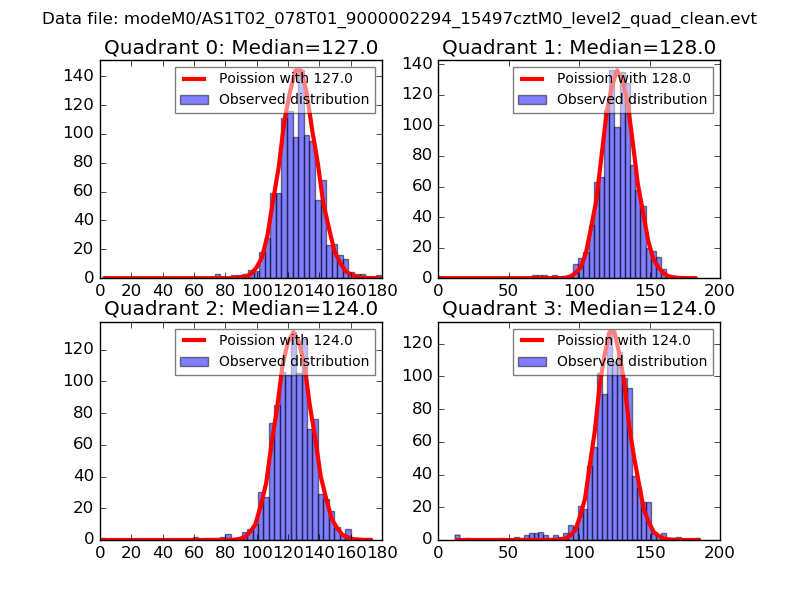 |
 |
| Quadrant-wise count rates Data is divided into 100 sec bins |
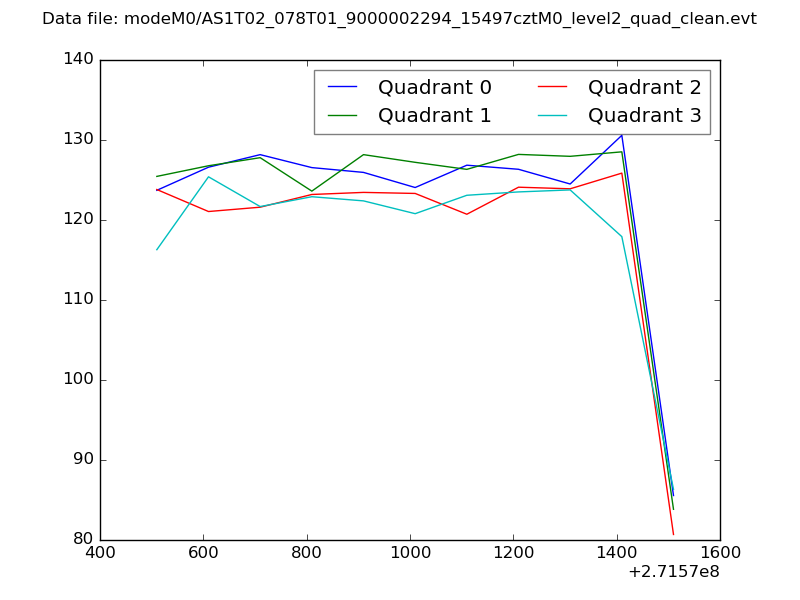 |
|
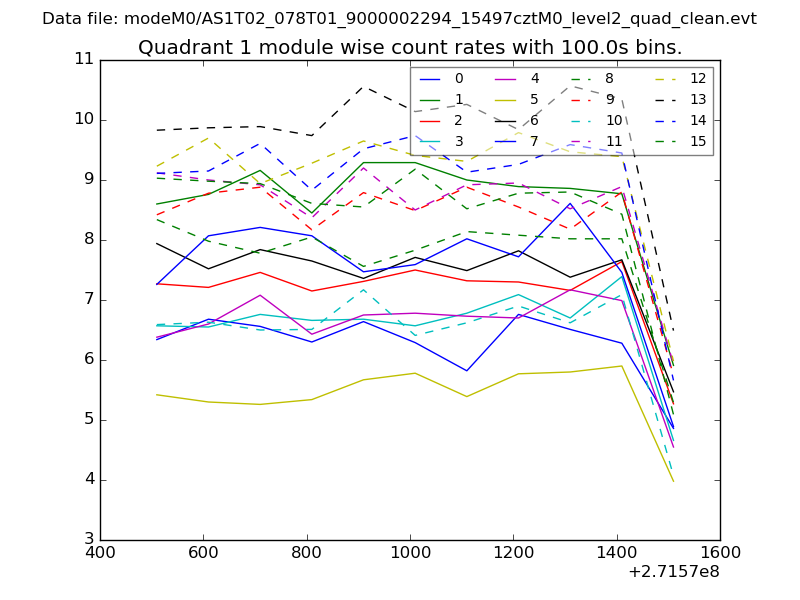
| Module-wise count rates for Quadrant A Data is divided into 100 sec bins |
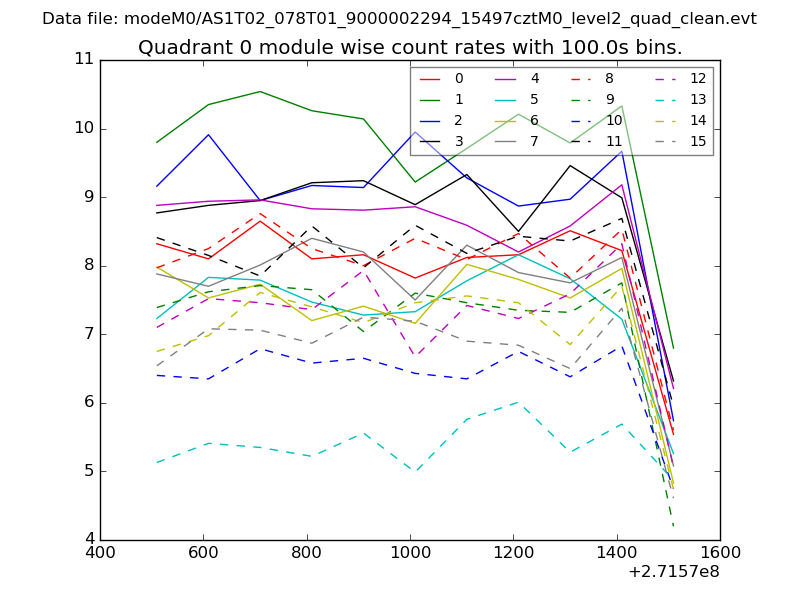 |
 |
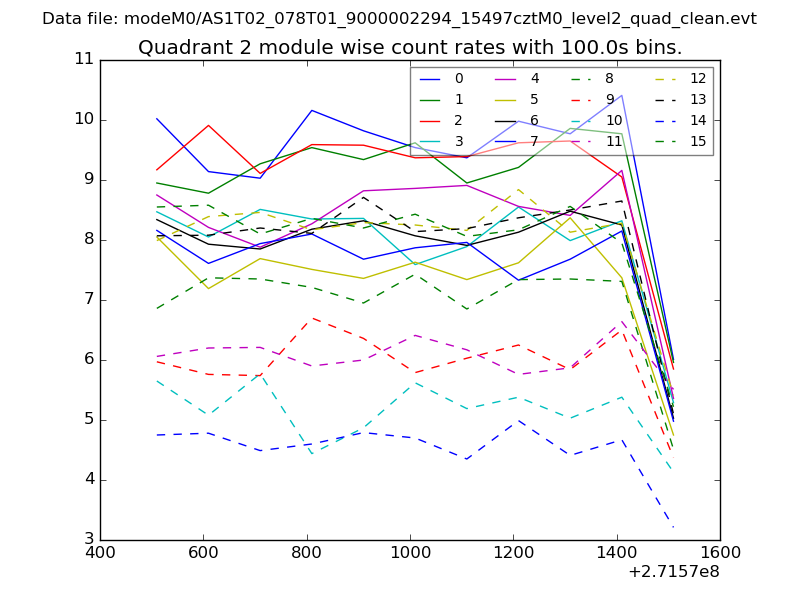
| Module-wise count rates for Quadrant B Data is divided into 100 sec bins |
 |
 |
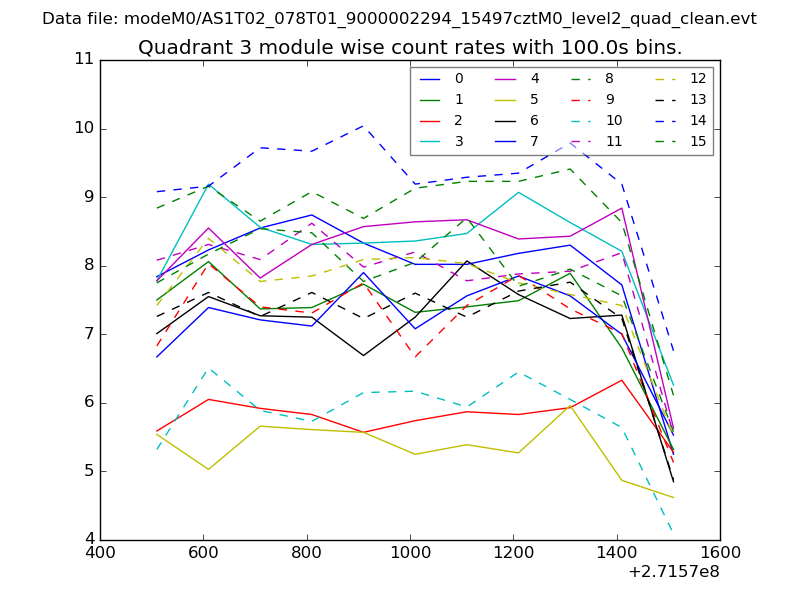
| Module-wise count rates for Quadrant C Data is divided into 100 sec bins |
 |
 |
| Module-wise count rates for Quadrant D Data is divided into 100 sec bins |
 |
 |
| Parameter | Plot |
|---|---|
| CZT HV Monitor | 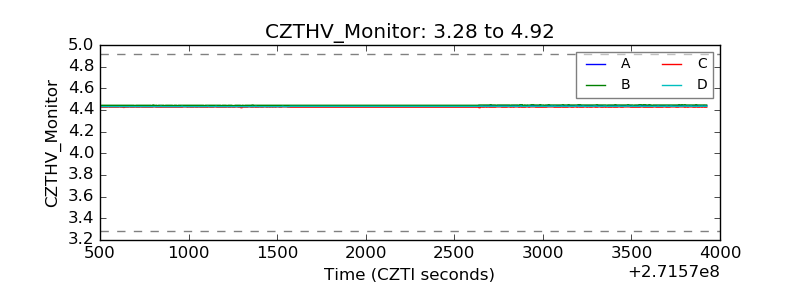 |
| D_VDD | 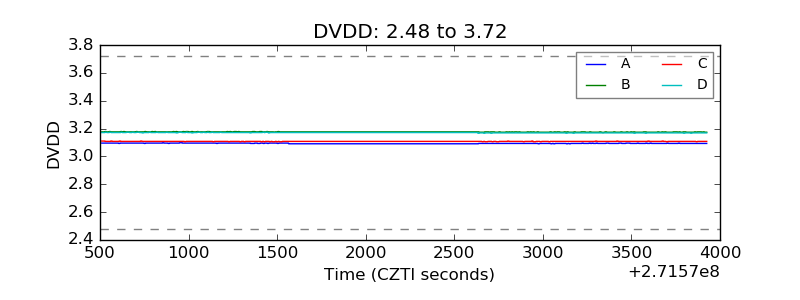 |
| Temperature 1 | 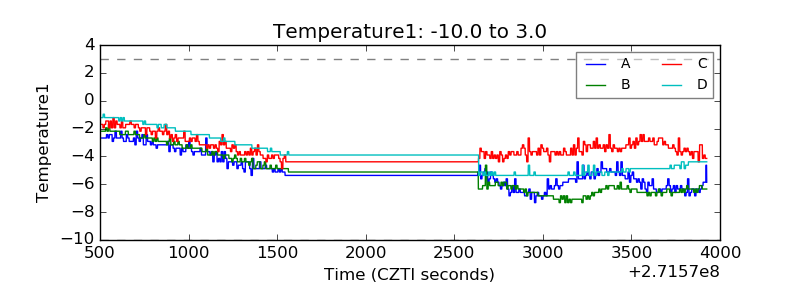 |
| Veto HV Monitor | 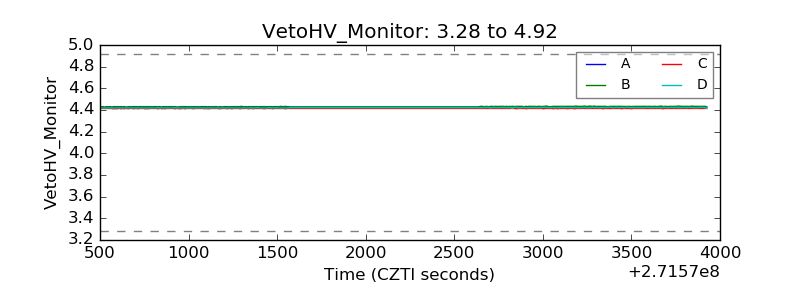 |
| Veto LLD | 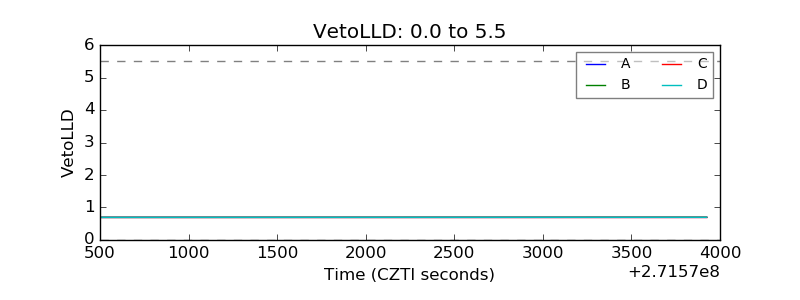 |
| Alpha Counter | 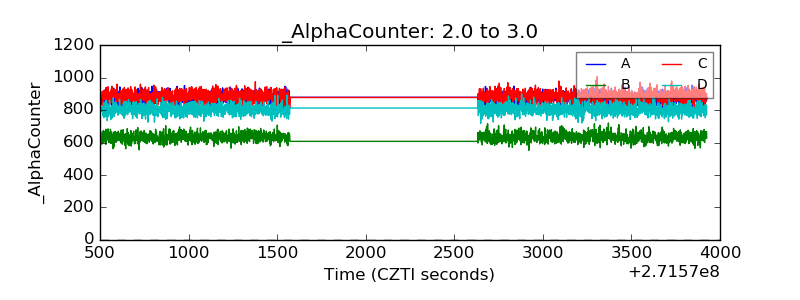 |
| _CPM_Rate | 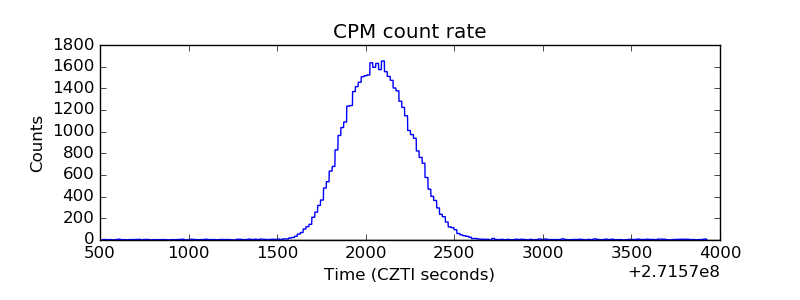 |
| CZT Counter | 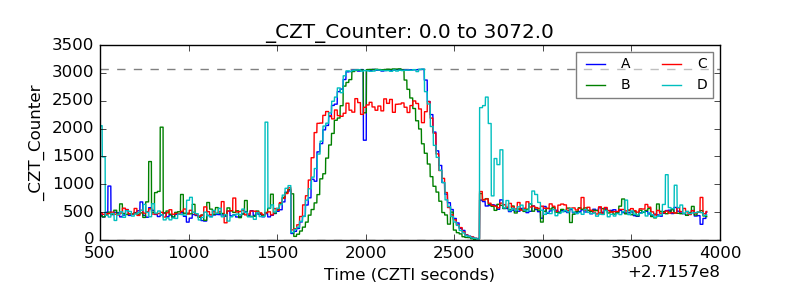 |
| +2.5 Volts monitor |  |
| +5 Volts monitor | 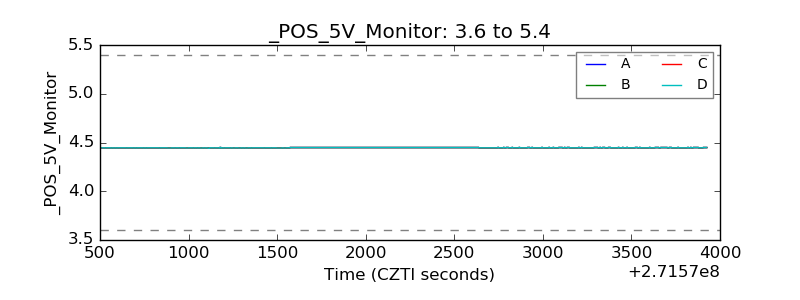 |
| _ROLL_ROT | 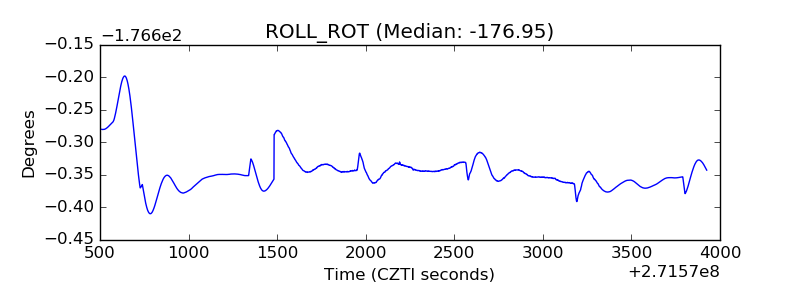 |
| _Roll_DEC | 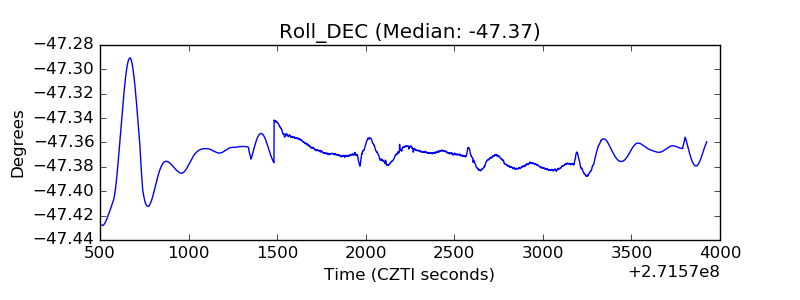 |
| _Roll_RA | 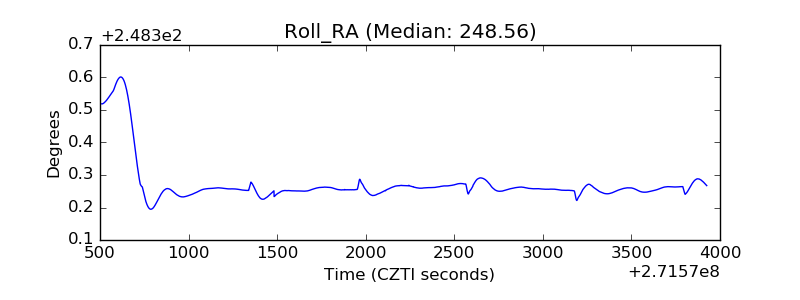 |
| Veto Counter | 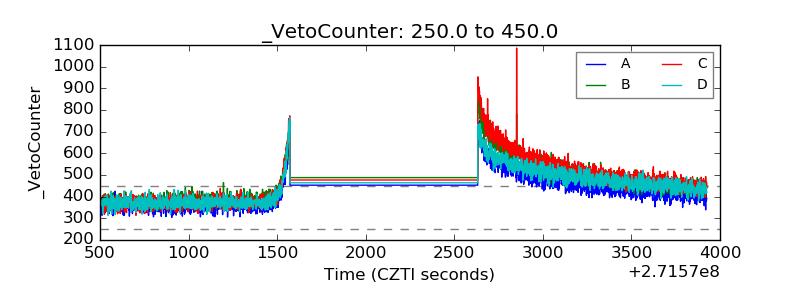 |