| Param | Original file | Final file |
|---|---|---|
| Filename | modeM0/AS1T02_078T01_9000002294_15499cztM0_level2.evt | modeM0/AS1T02_078T01_9000002294_15499cztM0_level2_quad_clean.evt |
| Size (bytes) | 473,123,520 | 69,762,240 |
| Size | 451.2 MB | 66.5 MB |
| Events in quadrant A | 3,371,215 | 421,110 |
| Events in quadrant B | 3,448,734 | 425,979 |
| Events in quadrant C | 3,416,509 | 414,703 |
| Events in quadrant D | 3,658,551 | 404,804 |
| Mode M9 | |||
|---|---|---|---|
| Quadrant | BADHDUFLAG | Total packets | Discarded packets |
| A | 0 | 21 | 0 |
| B | 0 | 21 | 0 |
| C | 0 | 21 | 0 |
| D | 0 | 22 | 0 |
| Mode SS | |||
|---|---|---|---|
| Quadrant | BADHDUFLAG | Total packets | Discarded packets |
| A | 0 | 130 | 0 |
| B | 0 | 130 | 0 |
| C | 0 | 130 | 0 |
| D | 0 | 130 | 0 |
| Mode M0 | |||
|---|---|---|---|
| Quadrant | BADHDUFLAG | Total packets | Discarded packets |
| A | 0 | 14063 | 3 |
| B | 0 | 14220 | 2 |
| C | 0 | 14155 | 2 |
| D | 0 | 14995 | 2 |
| Quadrant | Total seconds | Saturated seconds | Saturation percentage |
|---|---|---|---|
| A | 6385 | 47 | 0.736100% |
| B | 6385 | 40 | 0.626468% |
| C | 6385 | 79 | 1.237275% |
| D | 6385 | 162 | 2.537197% |
Noise dominated data is calculated using 1-second bins in cleaned event files. If a bin has >2000 counts, and if more than 50% of those come from <1% of pixels, then it is considered to be noise-dominated and hence unusable.
| Quadrant | # 1 sec bins | Bins with >0 counts | Bins with >2000 counts | High rate bins dominated by noise | Noise dominated (total time) | Noise dominated (detector-on time) | Marked lightcurve |
|---|---|---|---|---|---|---|---|
| A | 7586 | 6387 | 10 | 10 | 0.13% | 0.16% | 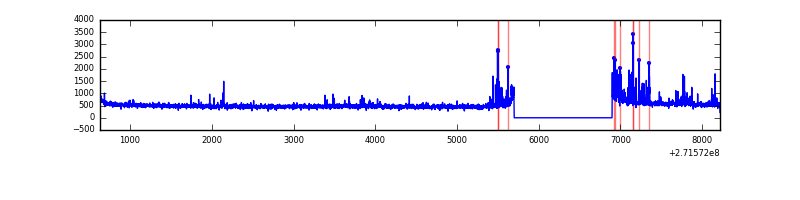 |
| B | 7586 | 6387 | 8 | 8 | 0.11% | 0.13% | 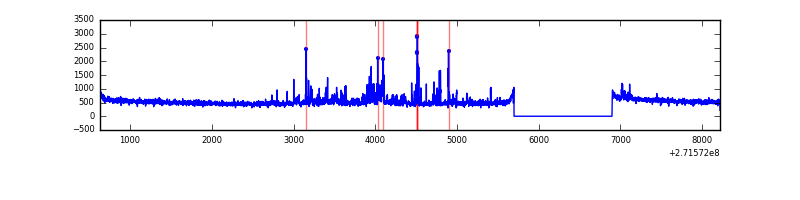 |
| C | 7586 | 6387 | 0 | 0 | 0.00% | 0.00% | 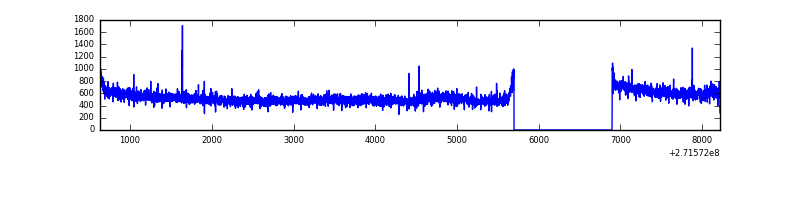 |
| D | 7586 | 6387 | 113 | 113 | 1.49% | 1.77% | 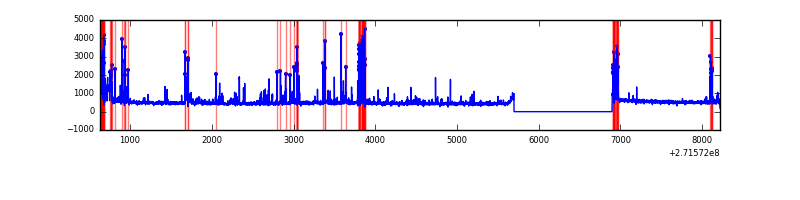 |
Top three noisy pixels from each quadrant. If the there are fewer than three noisy pixels in the level2.evt file, extra rows are filled as -1
| Pixel properties | Quadrant properties | ||||||
|---|---|---|---|---|---|---|---|
| Quadrant | DetID | PixID | Counts | Sigma | Mean | Median | Sigma |
| A | 14 | 238 | 172188 | 1062.72 | 809 | 794 | 161.3 |
| A | 0 | 253 | 51418 | 313.89 | 809 | 794 | 161.3 |
| A | 14 | 237 | 31827 | 192.42 | 809 | 794 | 161.3 |
| B | 10 | 245 | 192027 | 1269.16 | 810 | 790 | 150.7 |
| B | 0 | 189 | 40748 | 265.19 | 810 | 790 | 150.7 |
| B | 12 | 111 | 17254 | 109.27 | 810 | 790 | 150.7 |
| C | 3 | 233 | 212532 | 1190.78 | 784 | 791 | 177.8 |
| C | 14 | 238 | 123705 | 691.24 | 784 | 791 | 177.8 |
| C | 9 | 54 | 12121 | 63.72 | 784 | 791 | 177.8 |
| D | 1 | 52 | 224620 | 1180.31 | 784 | 760 | 189.7 |
| D | 7 | 223 | 172733 | 906.74 | 784 | 760 | 189.7 |
| D | 13 | 172 | 97966 | 512.52 | 784 | 760 | 189.7 |
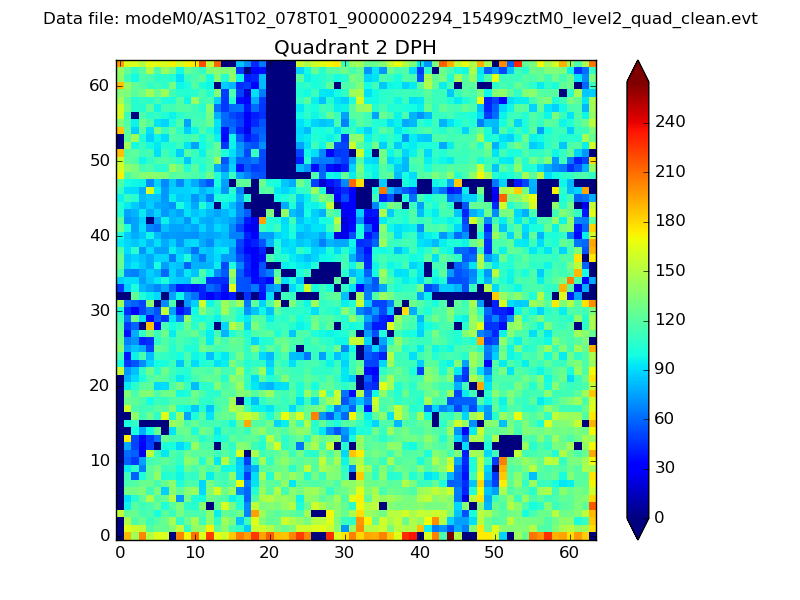
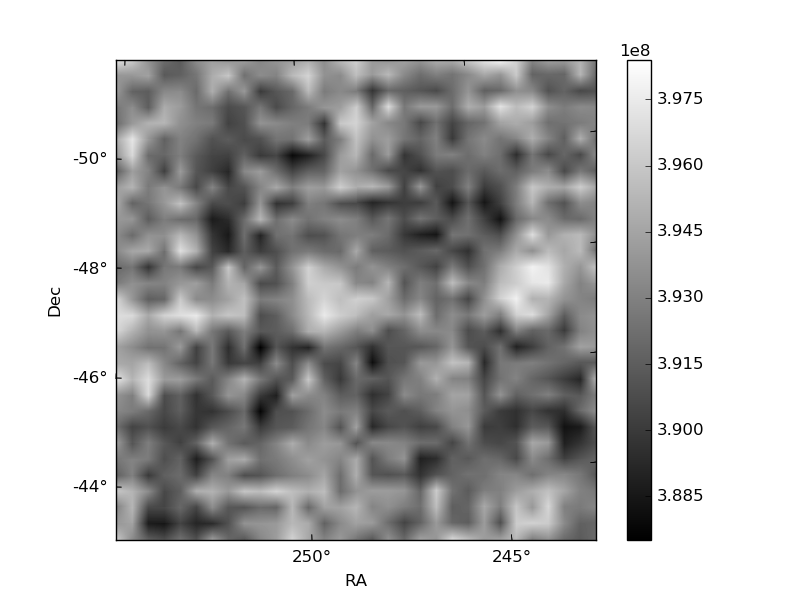
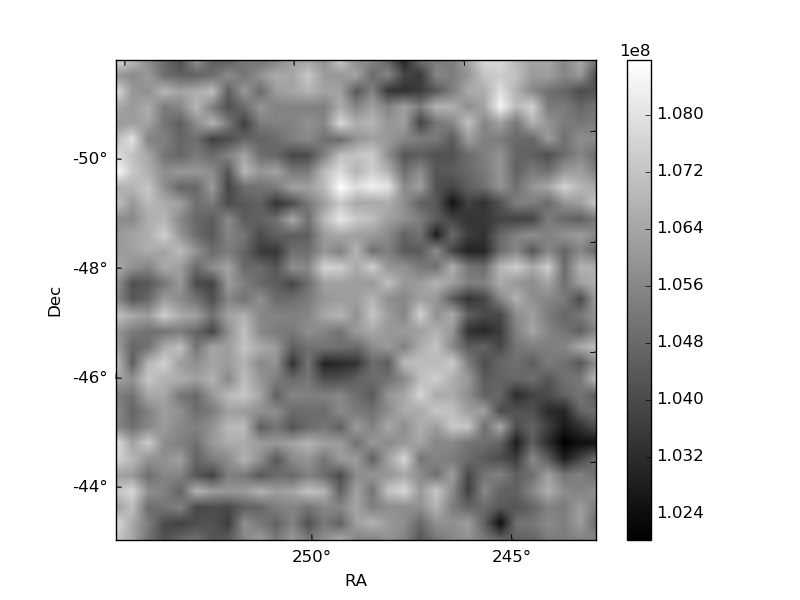
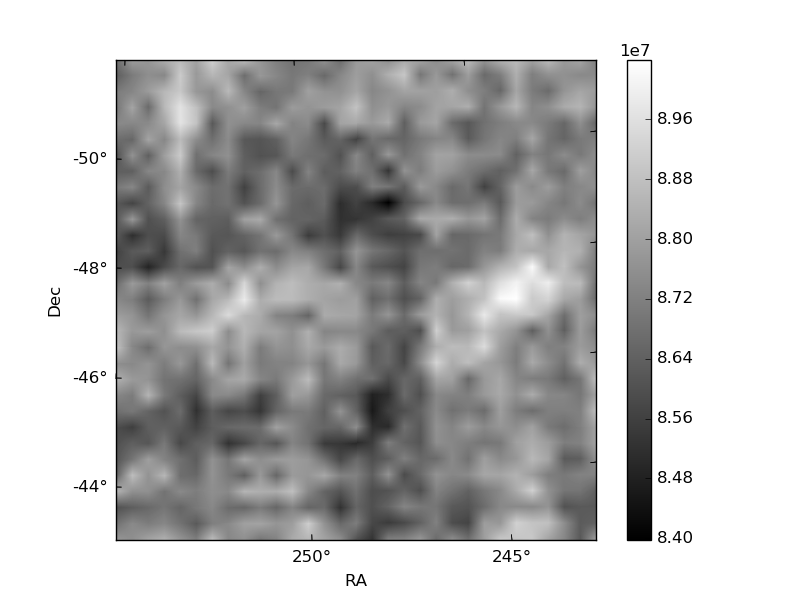
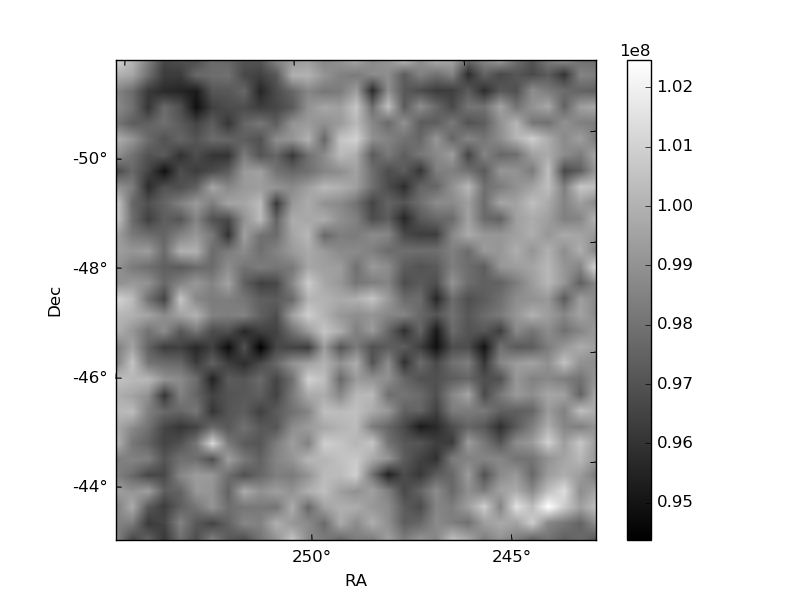
Histogram calculated using DETX and DETY for each event in the final _common_clean file
| Quadrant A | 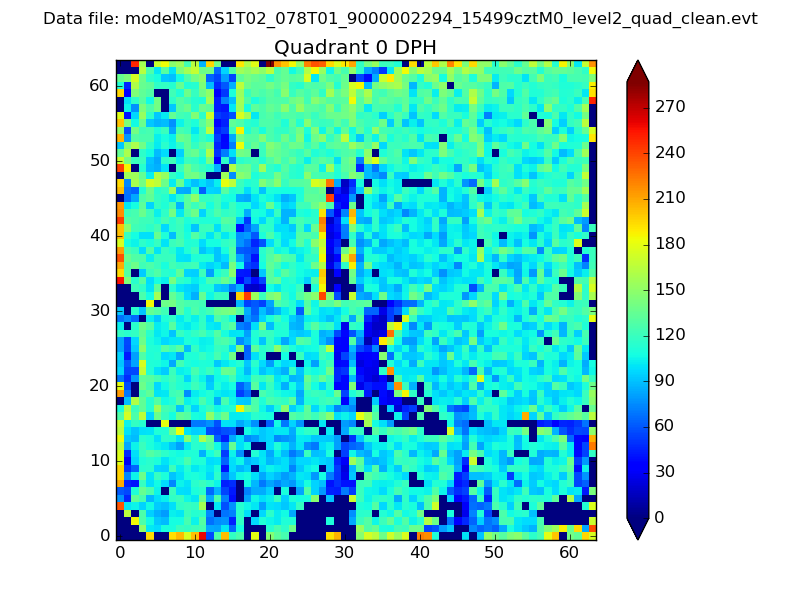 |
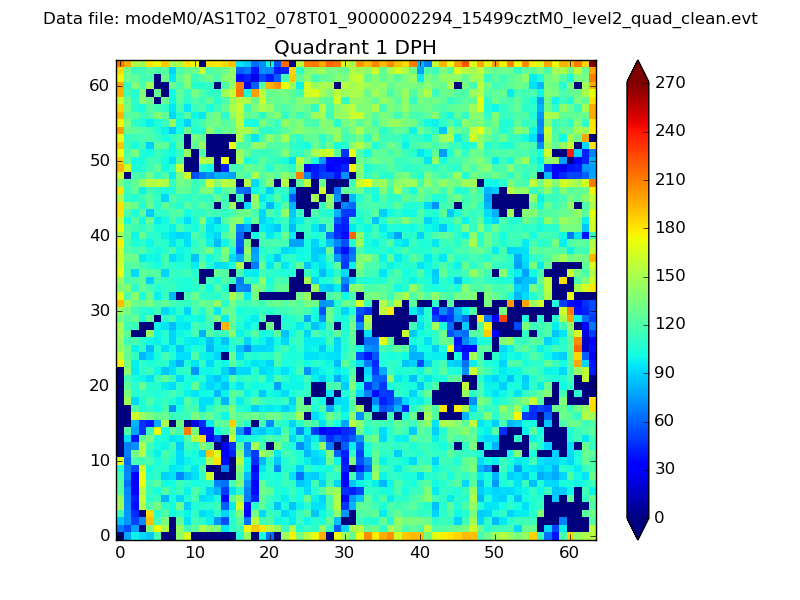 |
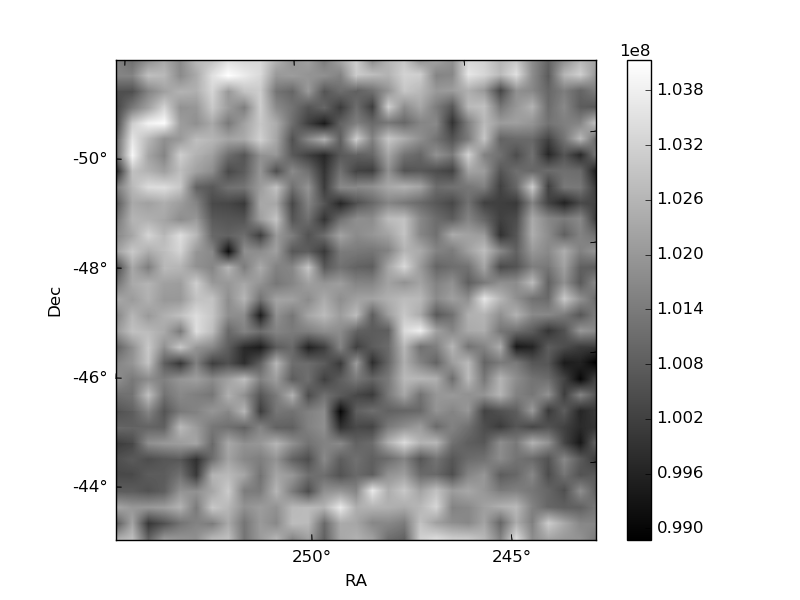
Quadrant B |
|---|---|---|---|
| Quadrant D | 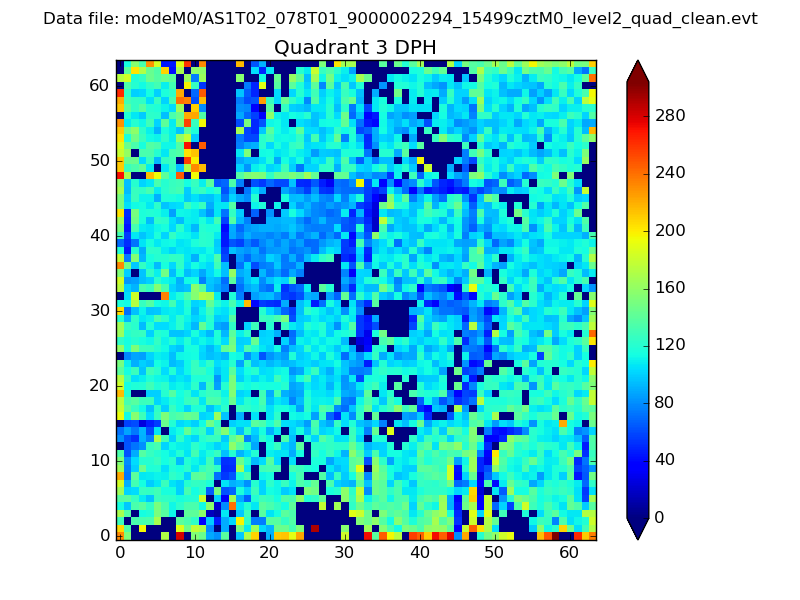 |
 |
Quadrant C |
| Plot type | Count rate plots | Images |
|---|---|---|
| Comparison with Poisson distribution Blue bars denote a histogram of data divided into 1 sec bins. Red curve is a Poisson curve with rate = median count rate of data. |
 |
 |
| Quadrant-wise count rates Data is divided into 100 sec bins |
 |
|
| Module-wise count rates for Quadrant A Data is divided into 100 sec bins |
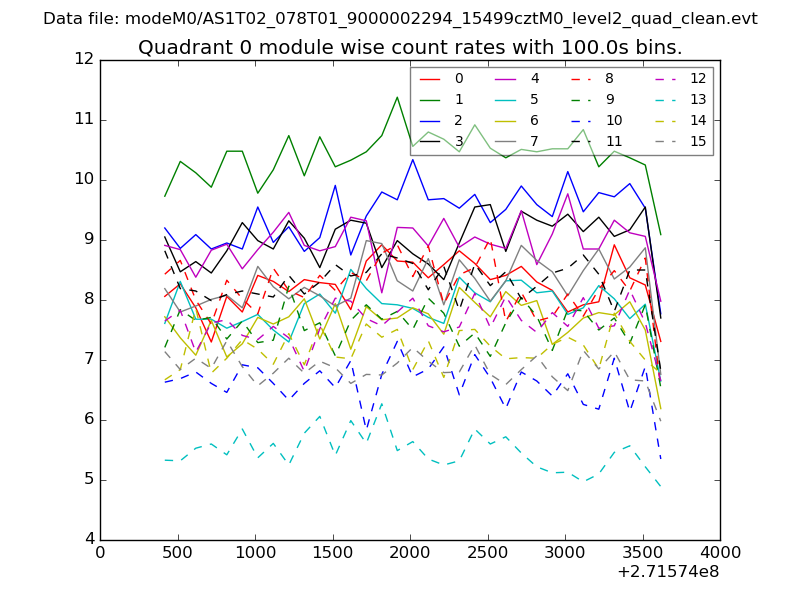 |
 |
| Module-wise count rates for Quadrant B Data is divided into 100 sec bins |
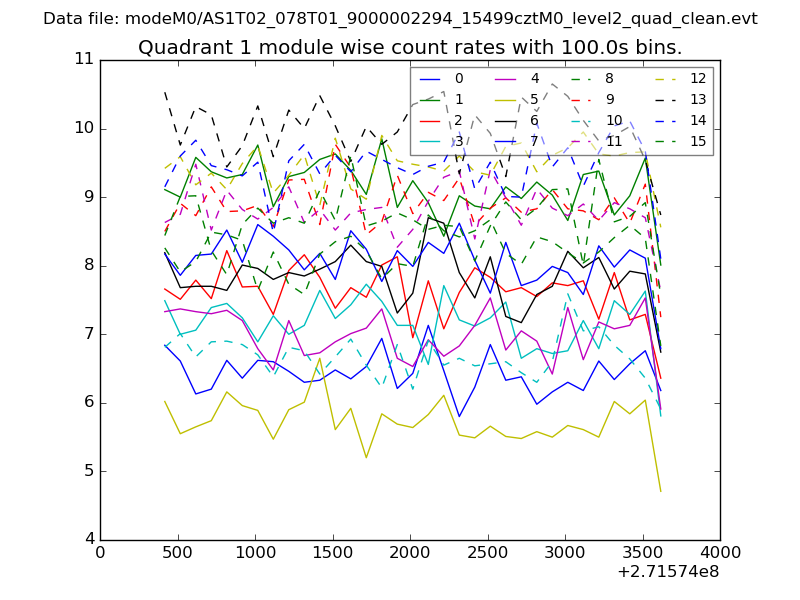 |
 |
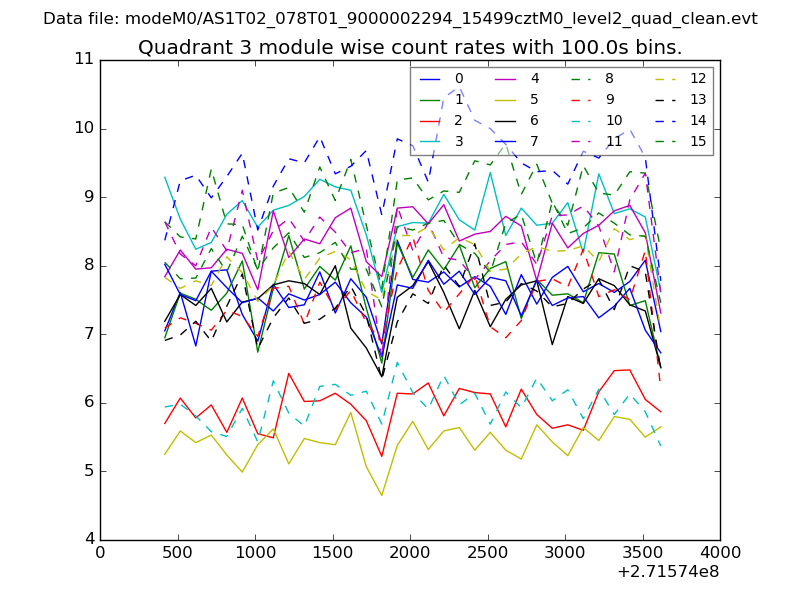
| Module-wise count rates for Quadrant C Data is divided into 100 sec bins |
 |
 |
| Module-wise count rates for Quadrant D Data is divided into 100 sec bins |
 |
 |
| Parameter | Plot |
|---|---|
| CZT HV Monitor |  |
| D_VDD | 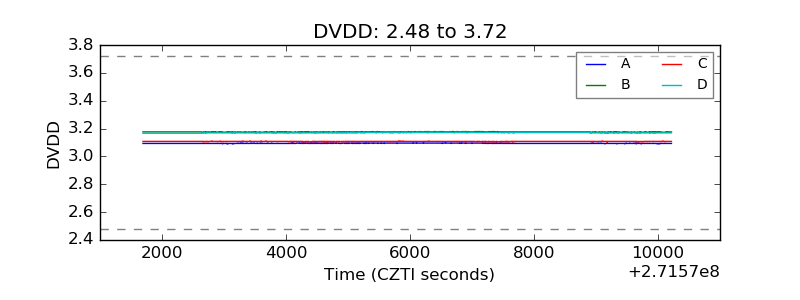 |
| Temperature 1 | 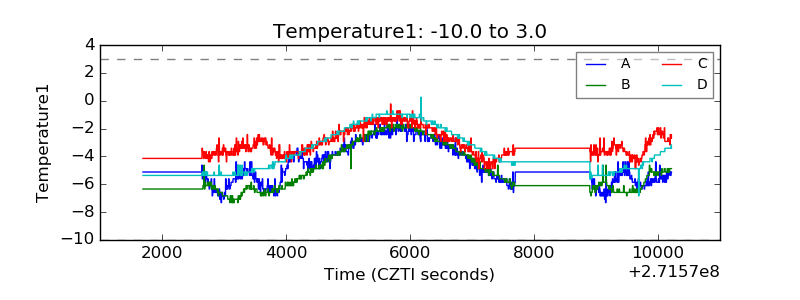 |
| Veto HV Monitor | 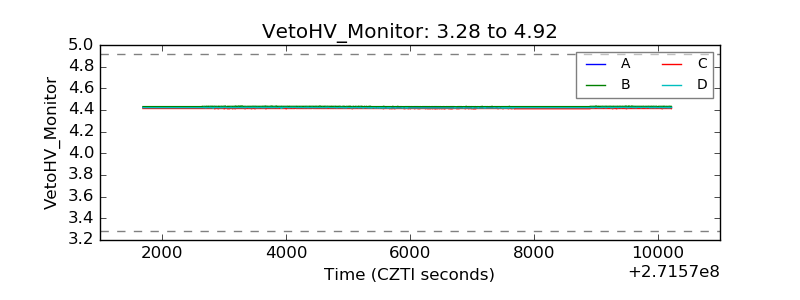 |
| Veto LLD | 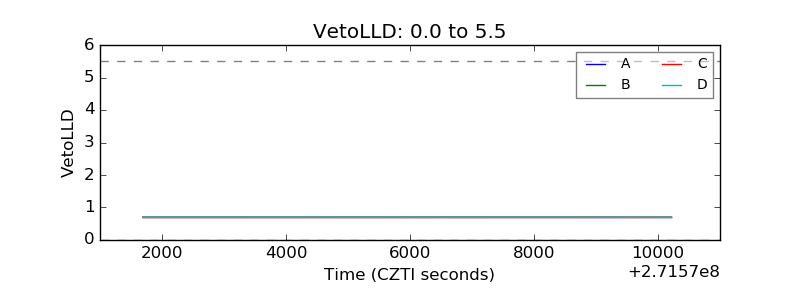 |
| Alpha Counter |  |
| _CPM_Rate | 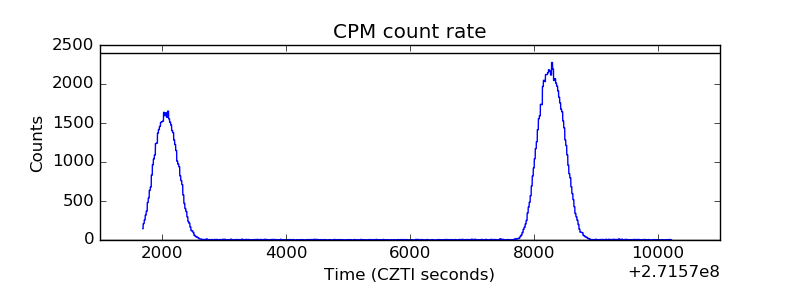 |
| CZT Counter | 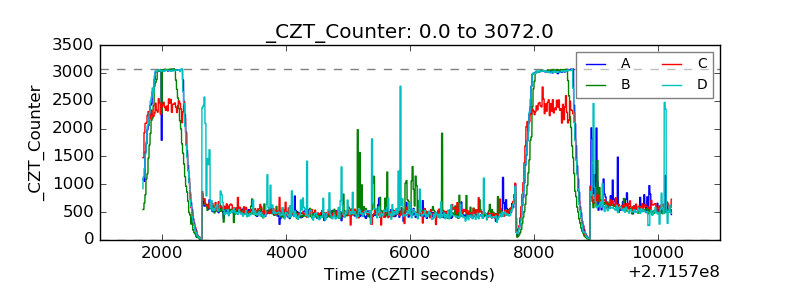 |
| +2.5 Volts monitor |  |
| +5 Volts monitor |  |
| _ROLL_ROT | 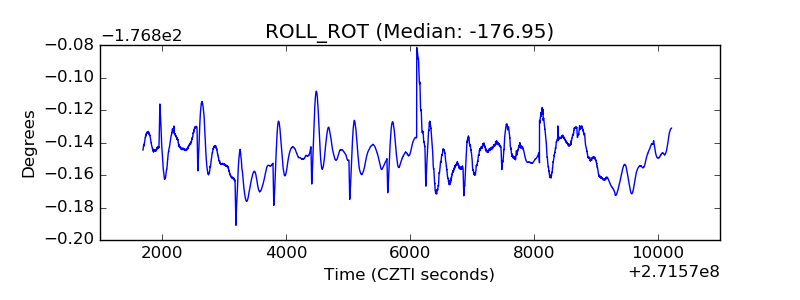 |
| _Roll_DEC | 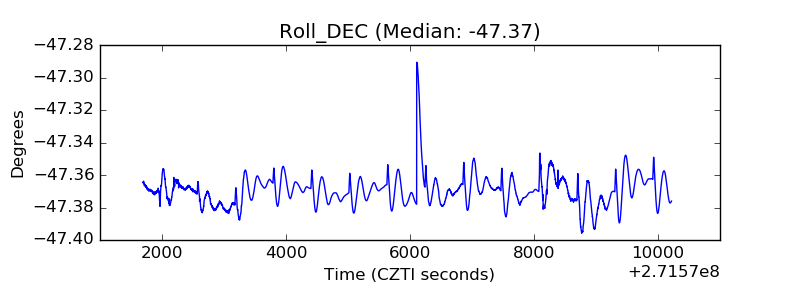 |
| _Roll_RA | 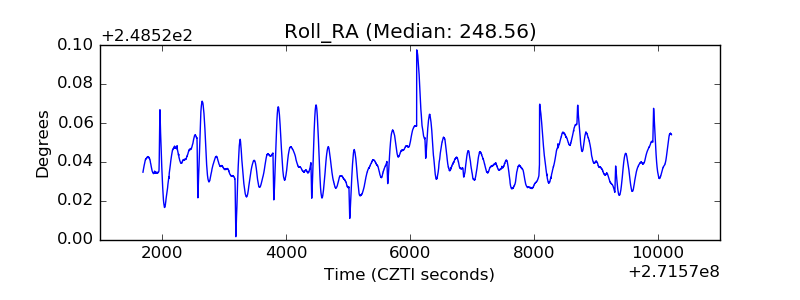 |
| Veto Counter | 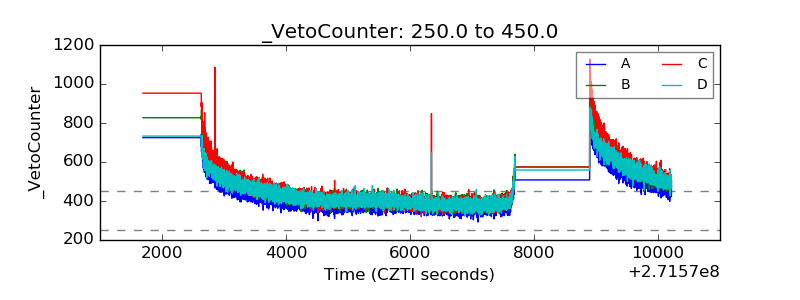 |