| Param | Original file | Final file |
|---|---|---|
| Filename | modeM0/AS1T02_078T01_9000002294_15501cztM0_level2.evt | modeM0/AS1T02_078T01_9000002294_15501cztM0_level2_quad_clean.evt |
| Size (bytes) | 323,009,280 | 70,231,680 |
| Size | 308.0 MB | 67.0 MB |
| Events in quadrant A | 2,091,521 | 470,354 |
| Events in quadrant B | 2,243,836 | 473,092 |
| Events in quadrant C | 2,193,558 | 460,170 |
| Events in quadrant D | 2,981,455 | 441,599 |
| Mode SS | |||
|---|---|---|---|
| Quadrant | BADHDUFLAG | Total packets | Discarded packets |
| A | 0 | 80 | 0 |
| B | 0 | 80 | 0 |
| C | 0 | 80 | 0 |
| D | 0 | 80 | 0 |
| Mode M0 | |||
|---|---|---|---|
| Quadrant | BADHDUFLAG | Total packets | Discarded packets |
| A | 0 | 8669 | 0 |
| B | 0 | 9167 | 0 |
| C | 0 | 9011 | 0 |
| D | 0 | 11546 | 0 |
| Quadrant | Total seconds | Saturated seconds | Saturation percentage |
|---|---|---|---|
| A | 3991 | 11 | 0.275620% |
| B | 3991 | 32 | 0.801804% |
| C | 3991 | 25 | 0.626409% |
| D | 3991 | 134 | 3.357554% |
Noise dominated data is calculated using 1-second bins in cleaned event files. If a bin has >2000 counts, and if more than 50% of those come from <1% of pixels, then it is considered to be noise-dominated and hence unusable.
| Quadrant | # 1 sec bins | Bins with >0 counts | Bins with >2000 counts | High rate bins dominated by noise | Noise dominated (total time) | Noise dominated (detector-on time) | Marked lightcurve |
|---|---|---|---|---|---|---|---|
| A | 3992 | 3992 | 1 | 1 | 0.03% | 0.03% | 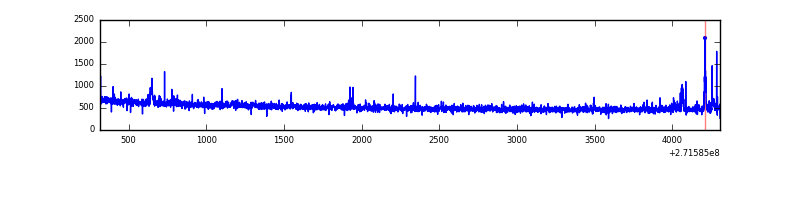 |
| B | 3992 | 3992 | 22 | 22 | 0.55% | 0.55% | 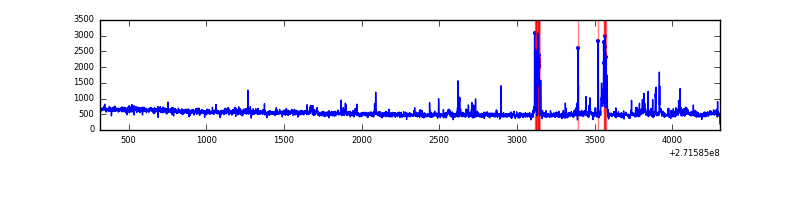 |
| C | 3992 | 3992 | 0 | 0 | 0.00% | 0.00% | 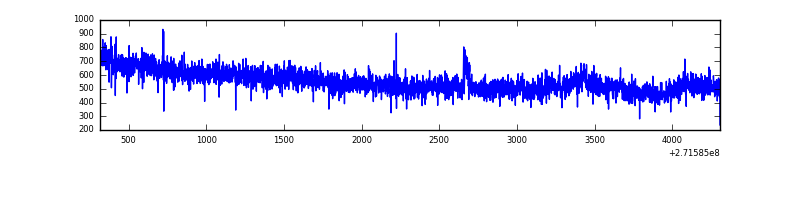 |
| D | 3992 | 3992 | 129 | 129 | 3.23% | 3.23% | 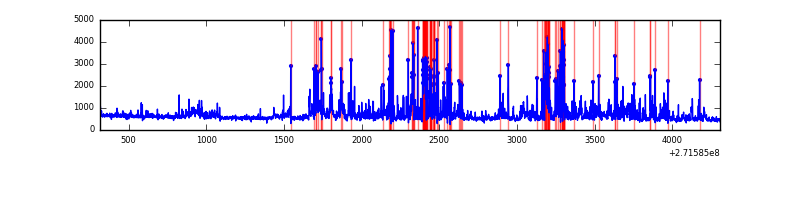 |
Top three noisy pixels from each quadrant. If the there are fewer than three noisy pixels in the level2.evt file, extra rows are filled as -1
| Pixel properties | Quadrant properties | ||||||
|---|---|---|---|---|---|---|---|
| Quadrant | DetID | PixID | Counts | Sigma | Mean | Median | Sigma |
| A | 14 | 238 | 34627 | 317.71 | 529 | 519 | 107.4 |
| A | 0 | 253 | 13499 | 120.91 | 529 | 519 | 107.4 |
| A | 14 | 237 | 5106 | 42.73 | 529 | 519 | 107.4 |
| B | 4 | 142 | 101884 | 1049.43 | 520 | 509 | 96.6 |
| B | 0 | 189 | 30006 | 305.35 | 520 | 509 | 96.6 |
| B | 10 | 245 | 22889 | 231.68 | 520 | 509 | 96.6 |
| C | 3 | 233 | 147864 | 1284.86 | 502 | 508 | 114.7 |
| C | 14 | 238 | 81401 | 705.34 | 502 | 508 | 114.7 |
| C | 0 | 207 | 4407 | 34.0 | 502 | 508 | 114.7 |
| D | 1 | 52 | 848117 | 6820.56 | 509 | 496 | 124.3 |
| D | 5 | 222 | 113348 | 908.09 | 509 | 496 | 124.3 |
| D | 7 | 38 | 48194 | 383.81 | 509 | 496 | 124.3 |
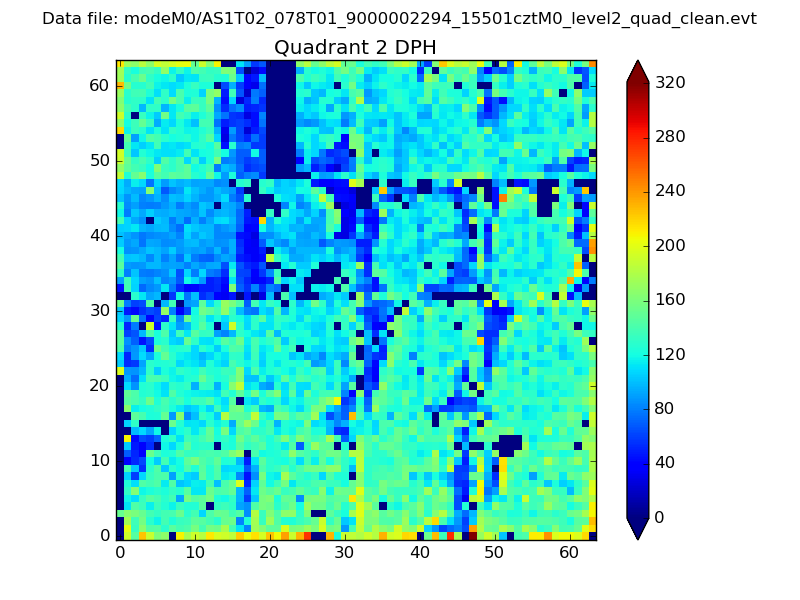
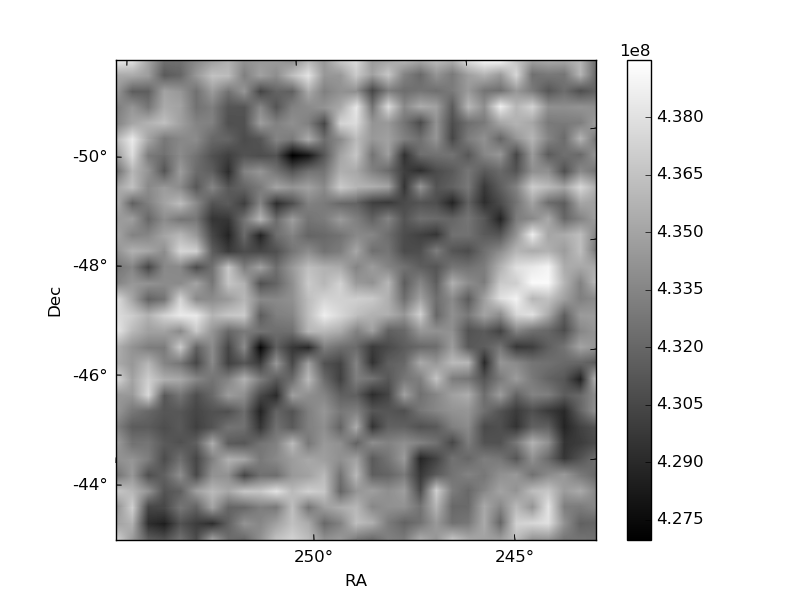
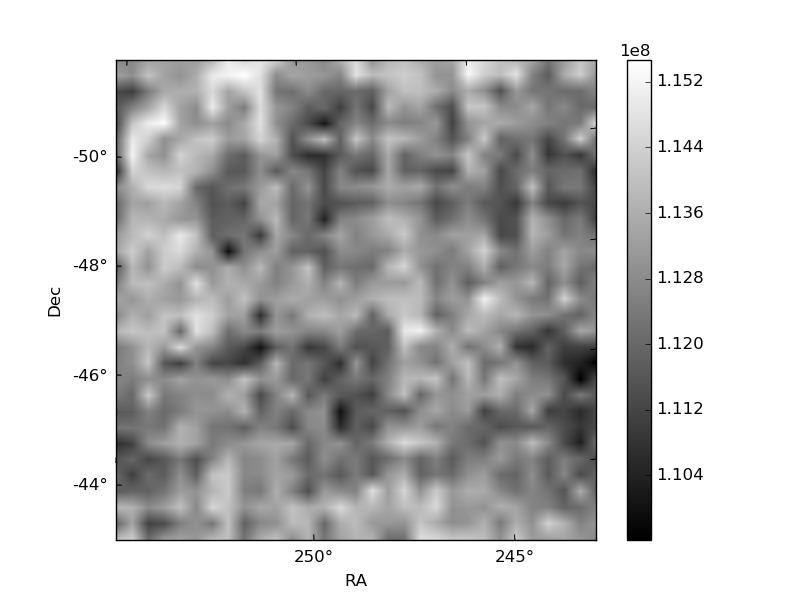
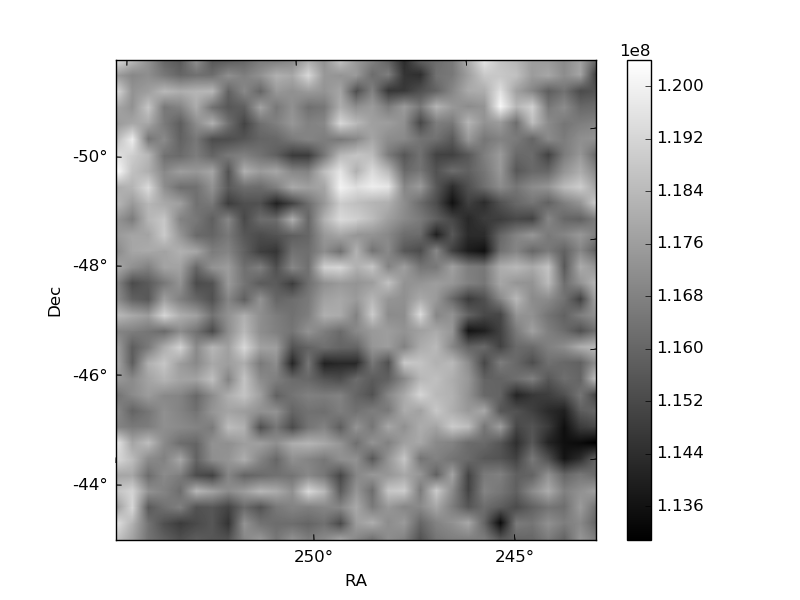
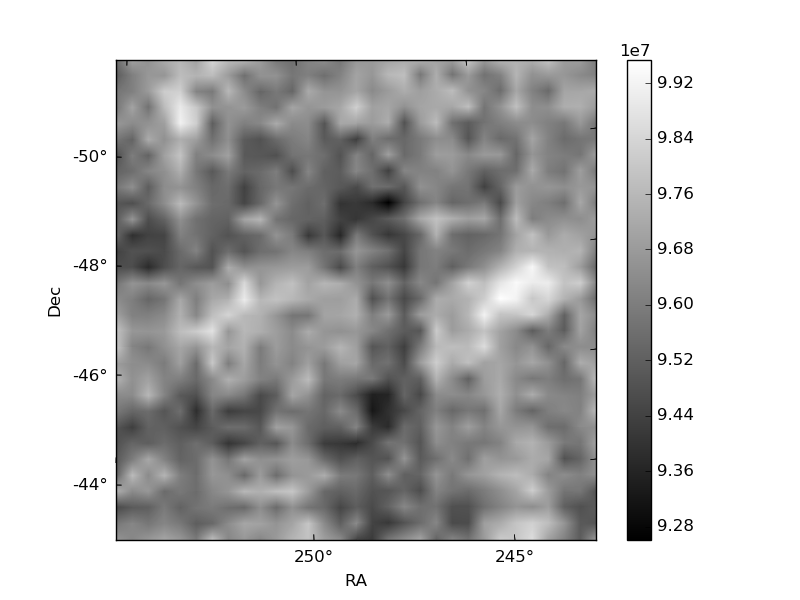
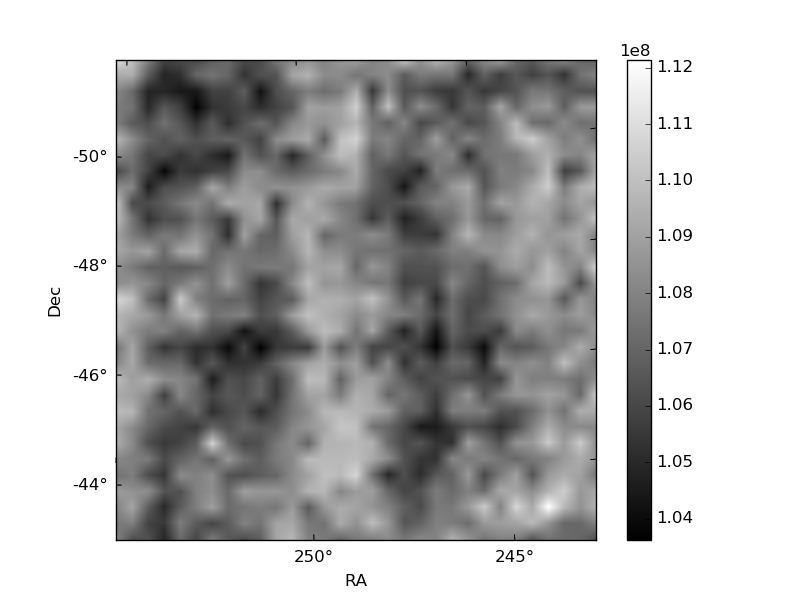
Histogram calculated using DETX and DETY for each event in the final _common_clean file
| Quadrant A | 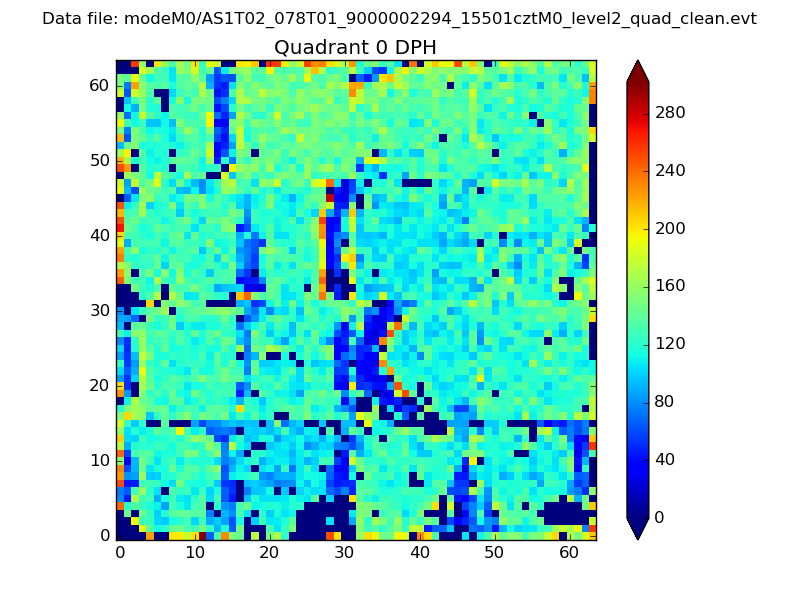 |
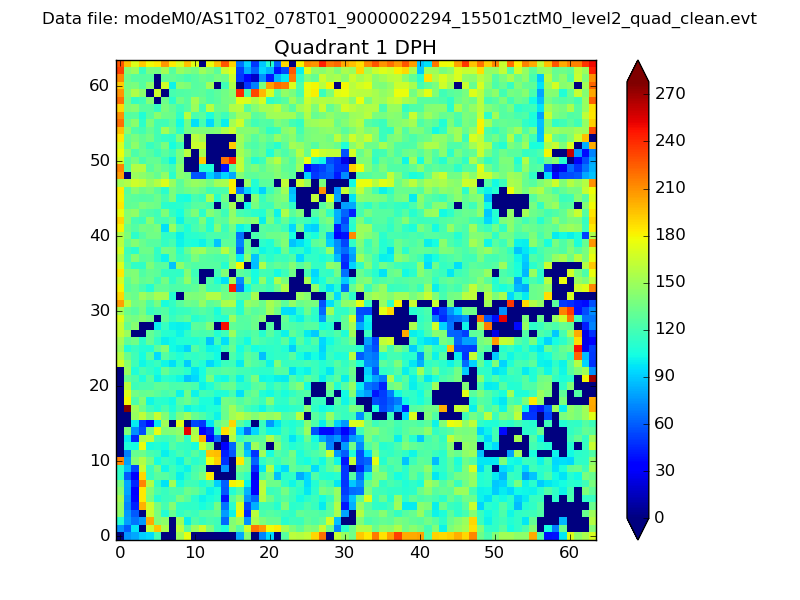 |
Quadrant B |
|---|---|---|---|
| Quadrant D | 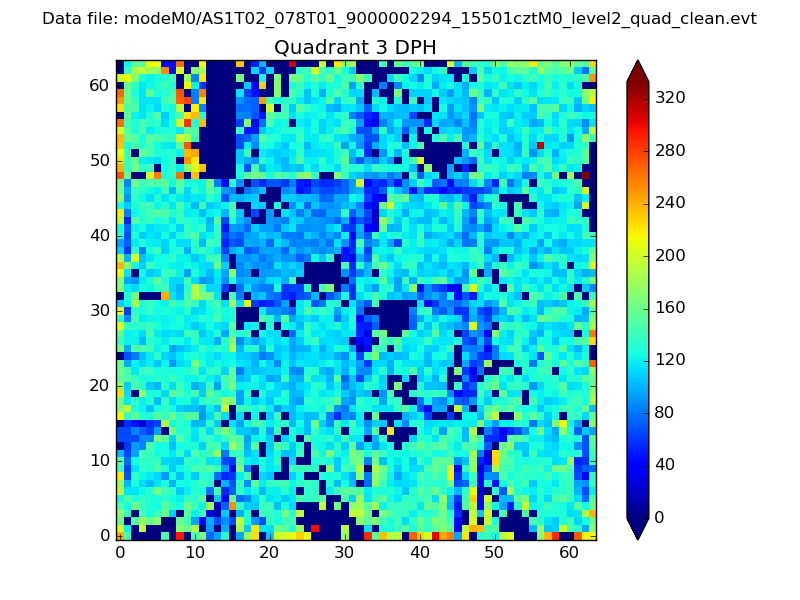 |
 |
Quadrant C |
| Plot type | Count rate plots | Images |
|---|---|---|
| Comparison with Poisson distribution Blue bars denote a histogram of data divided into 1 sec bins. Red curve is a Poisson curve with rate = median count rate of data. |
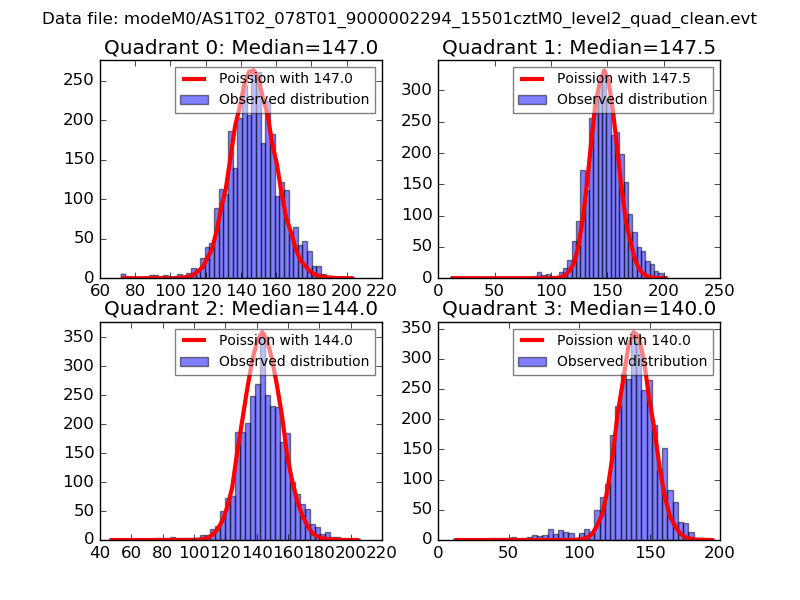 |
 |
| Quadrant-wise count rates Data is divided into 100 sec bins |
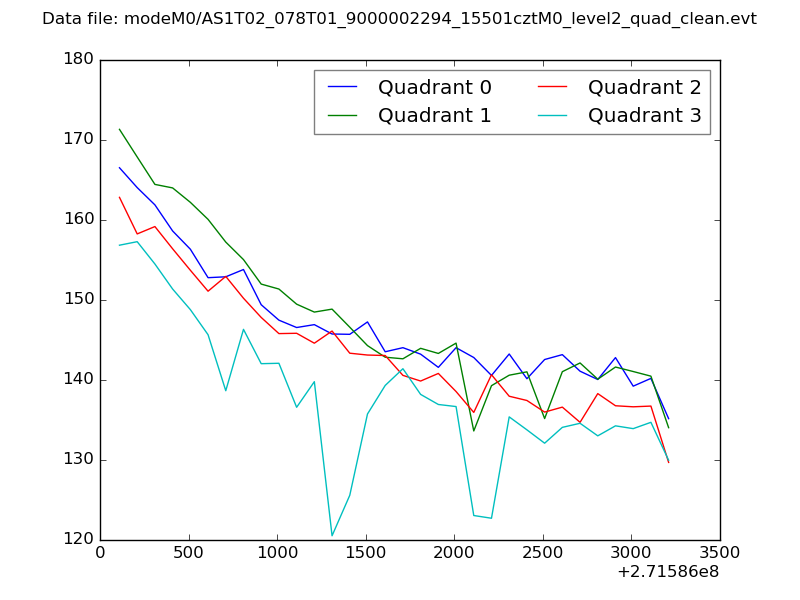 |
|
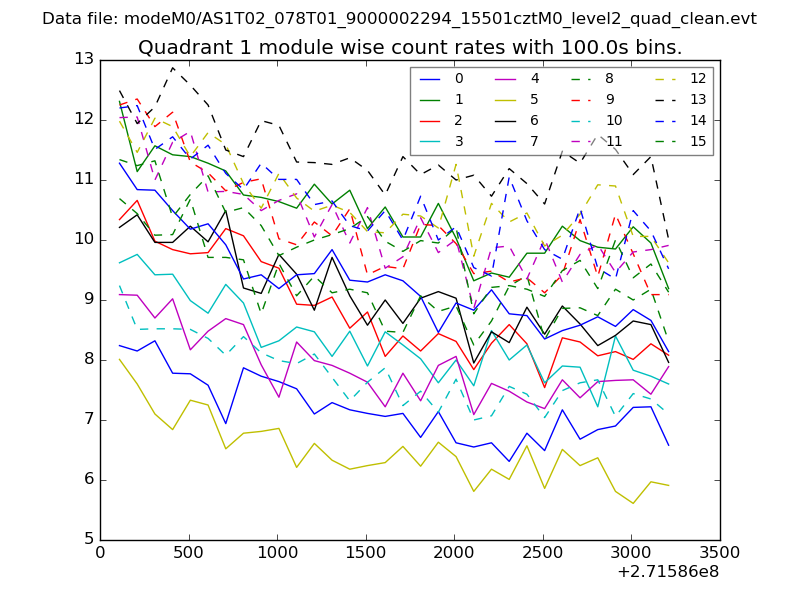
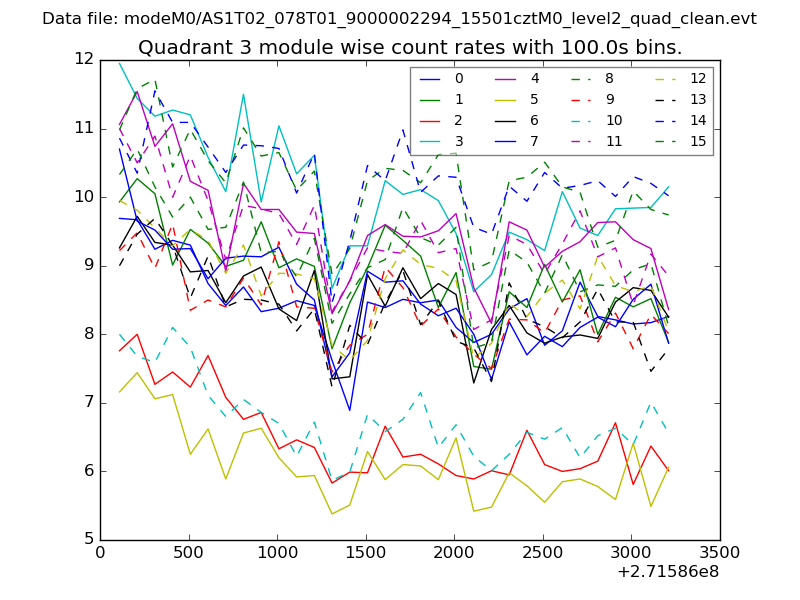
| Module-wise count rates for Quadrant A Data is divided into 100 sec bins |
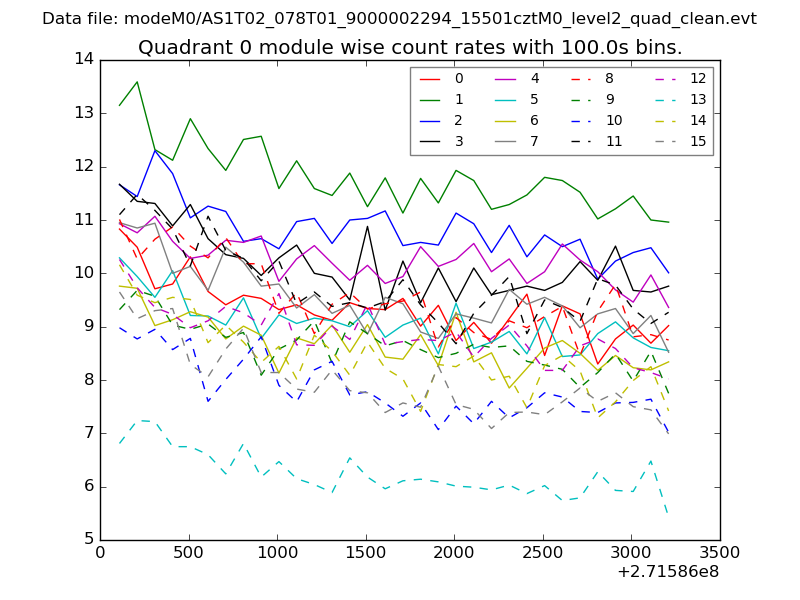 |
 |
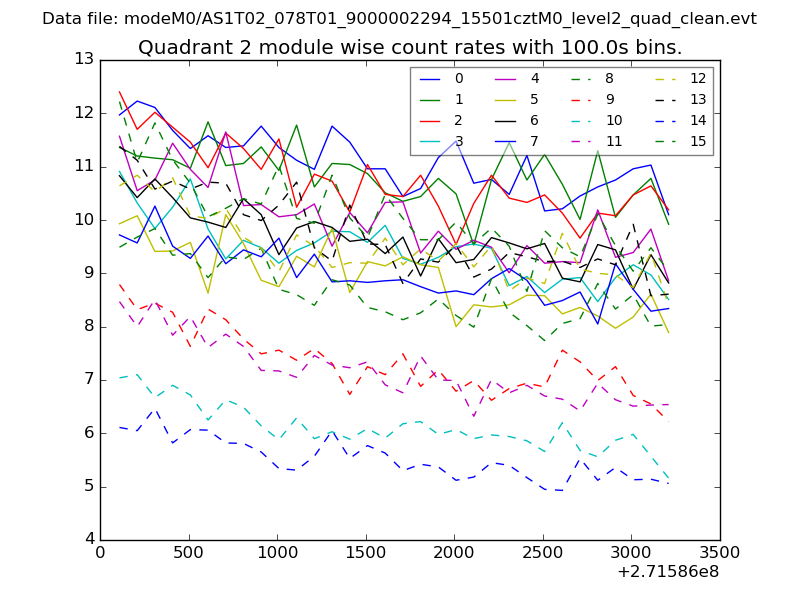
| Module-wise count rates for Quadrant B Data is divided into 100 sec bins |
 |
 |
| Module-wise count rates for Quadrant C Data is divided into 100 sec bins |
 |
 |
| Module-wise count rates for Quadrant D Data is divided into 100 sec bins |
 |
 |
| Parameter | Plot |
|---|---|
| CZT HV Monitor | 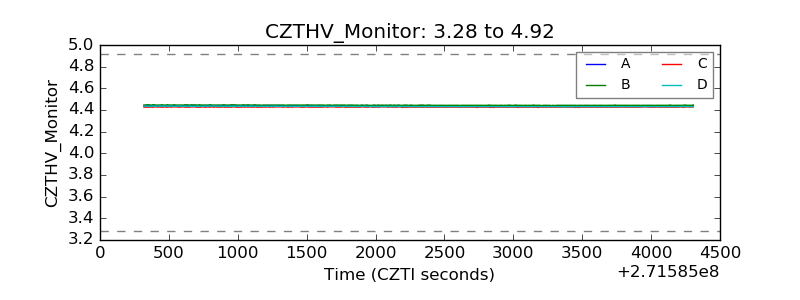 |
| D_VDD | 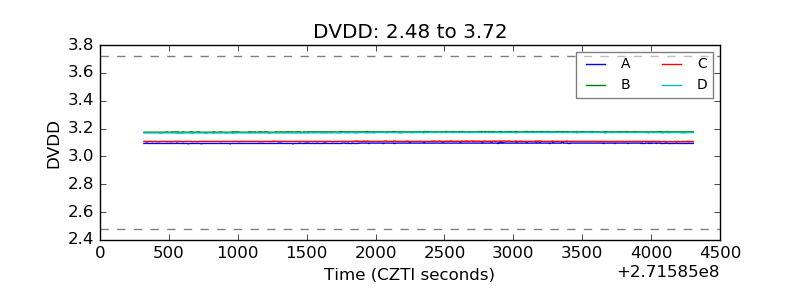 |
| Temperature 1 | 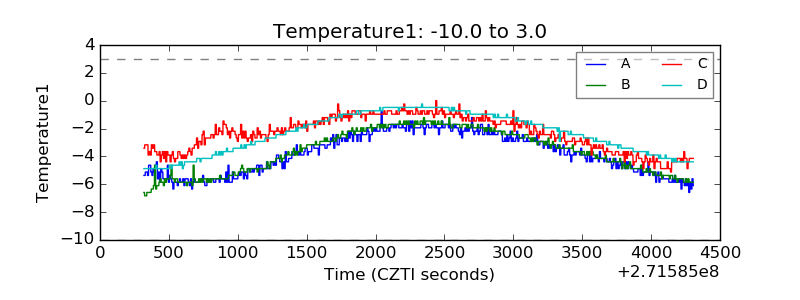 |
| Veto HV Monitor | 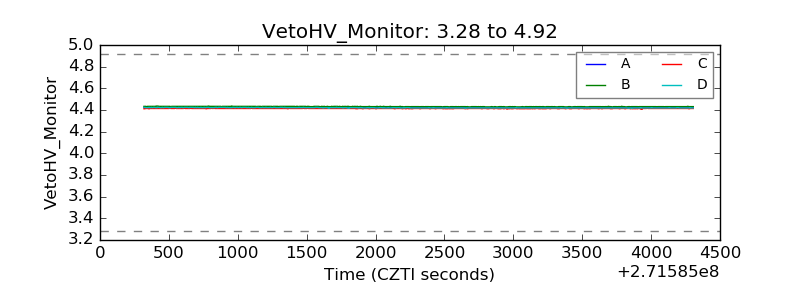 |
| Veto LLD | 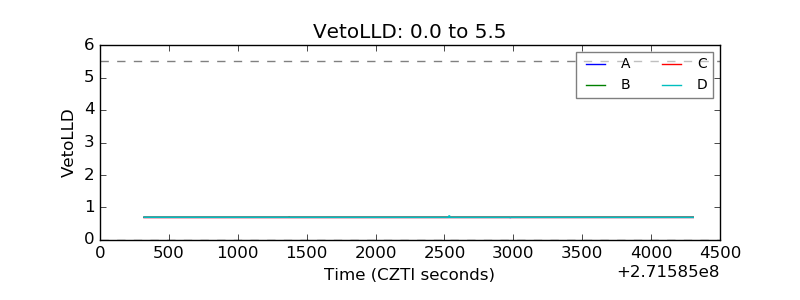 |
| Alpha Counter | 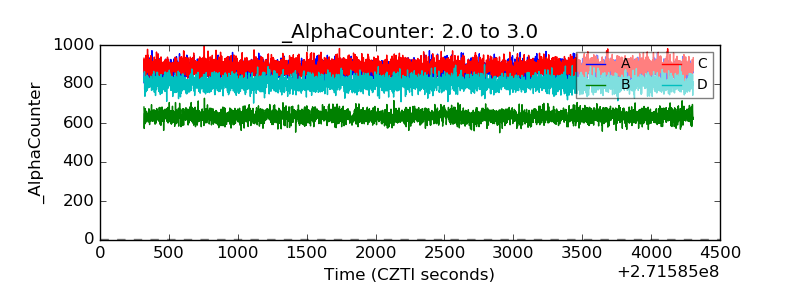 |
| _CPM_Rate | 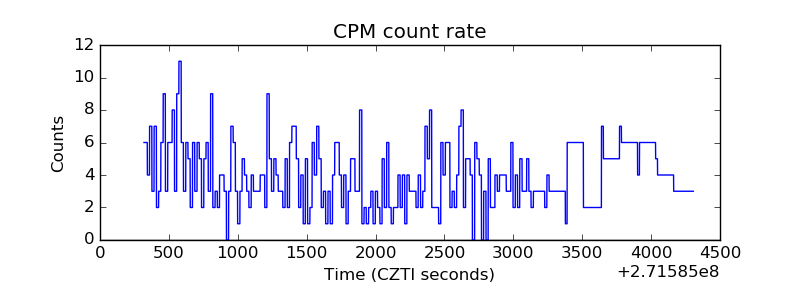 |
| CZT Counter | 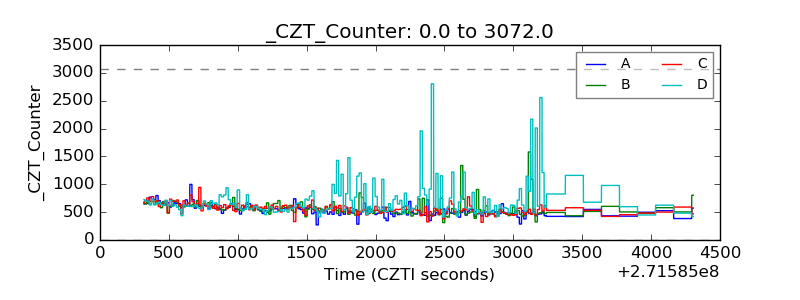 |
| +2.5 Volts monitor | 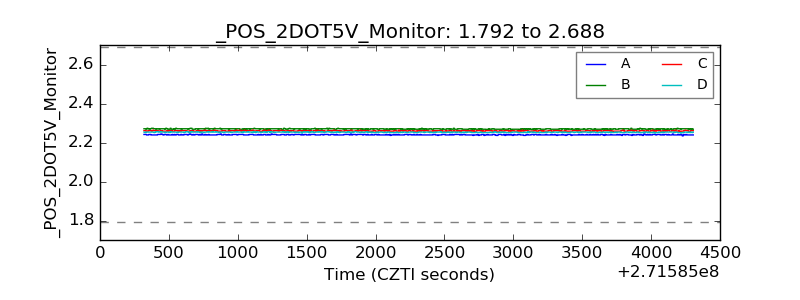 |
| +5 Volts monitor | 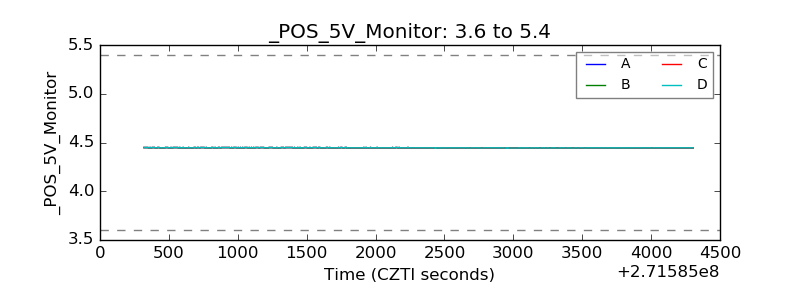 |
| _ROLL_ROT | 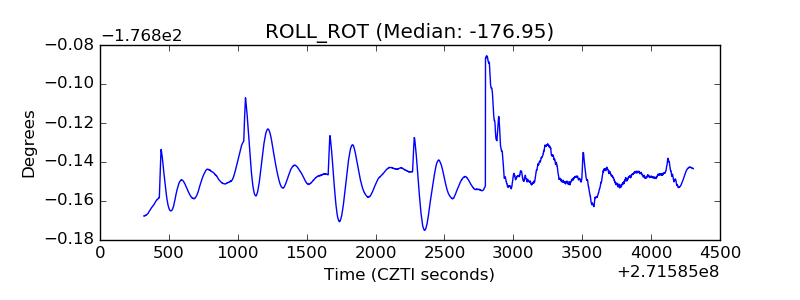 |
| _Roll_DEC | 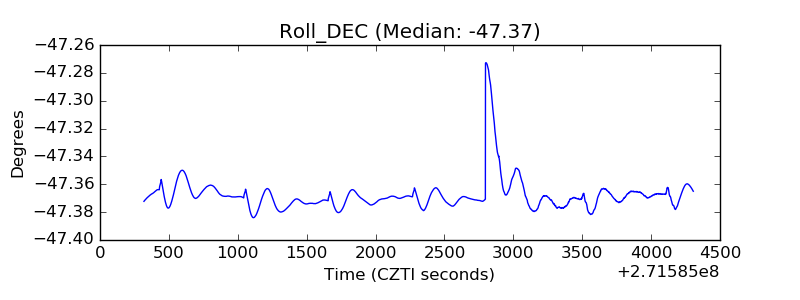 |
| _Roll_RA | 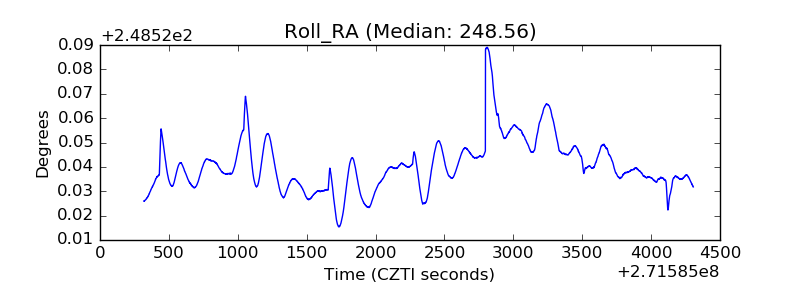 |
| Veto Counter | 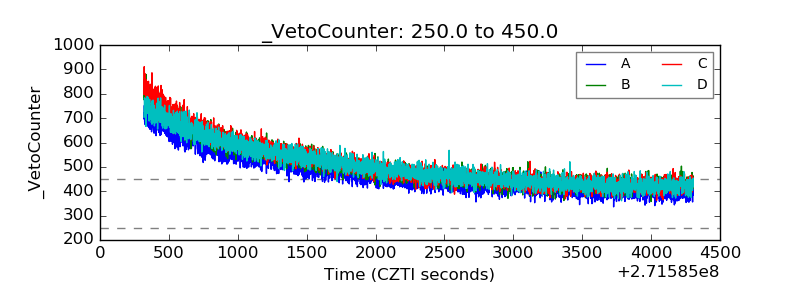 |