| Param | Original file | Final file |
|---|---|---|
| Filename | modeM0/AS1T02_085T01_9000002296cztM0_level2.fits | modeM0/AS1T02_085T01_9000002296cztM0_level2_quad_clean.evt |
| Size (bytes) | 1,026,722,880 | 888,125,760 |
| Size | 979.2 MB | 847.0 MB |
| Events in quadrant A | 6,335,546 | 5,135,886 |
| Events in quadrant B | 6,077,520 | 5,171,964 |
| Events in quadrant C | 6,185,972 | 4,932,484 |
| Events in quadrant D | 5,303,120 | 4,466,345 |
| Mode SS | |||
|---|---|---|---|
| Quadrant | BADHDUFLAG | Total packets | Discarded packets |
| A | 0 | 2138 | 0 |
| B | 0 | 2138 | 0 |
| C | 0 | 2138 | 0 |
| D | 0 | 2138 | 0 |
| Mode M9 | |||
|---|---|---|---|
| Quadrant | BADHDUFLAG | Total packets | Discarded packets |
| A | 0 | 174 | 0 |
| B | 0 | 174 | 0 |
| C | 0 | 174 | 0 |
| D | 0 | 174 | 0 |
| Mode M0 | |||
|---|---|---|---|
| Quadrant | BADHDUFLAG | Total packets | Discarded packets |
| A | 0 | 242816 | 0 |
| B | 0 | 225722 | 0 |
| C | 0 | 229844 | 0 |
| D | 0 | 293573 | 0 |
| Quadrant | Total seconds | Saturated seconds | Saturation percentage |
|---|---|---|---|
| A | 104890 | 3179 | 3.030794% |
| B | 104890 | 1591 | 1.516827% |
| C | 104890 | 1765 | 1.682715% |
| D | 104890 | 6379 | 6.081609% |
Noise dominated data is calculated using 1-second bins in cleaned event files. If a bin has >2000 counts, and if more than 50% of those come from <1% of pixels, then it is considered to be noise-dominated and hence unusable.
| Quadrant | # 1 sec bins | Bins with >0 counts | Bins with >2000 counts | High rate bins dominated by noise | Noise dominated (total time) | Noise dominated (detector-on time) | Marked lightcurve |
|---|---|---|---|---|---|---|---|
| A | 121205 | 104873 | 0 | 0 | 0.00% | 0.00% |  |
| B | 121205 | 104885 | 0 | 0 | 0.00% | 0.00% |  |
| C | 121205 | 104885 | 0 | 0 | 0.00% | 0.00% | 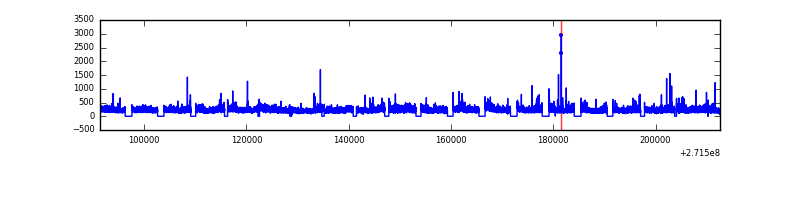 |
| D | 121205 | 104628 | 0 | 0 | 0.00% | 0.00% |  |
Top three noisy pixels from each quadrant. If the there are fewer than three noisy pixels in the level2.evt file, extra rows are filled as -1
| Pixel properties | Quadrant properties | ||||||
|---|---|---|---|---|---|---|---|
| Quadrant | DetID | PixID | Counts | Sigma | Mean | Median | Sigma |
| A | 0 | 29 | 5811 | 10.72 | 1649 | 1552 | 397.4 |
| A | 7 | 110 | 5026 | 8.74 | 1649 | 1552 | 397.4 |
| A | 9 | 19 | 4719 | 7.97 | 1649 | 1552 | 397.4 |
| B | 2 | 9 | 4951 | 10.94 | 1609 | 1540 | 311.7 |
| B | 2 | 8 | 4090 | 8.18 | 1609 | 1540 | 311.7 |
| B | 3 | 80 | 4089 | 8.18 | 1609 | 1540 | 311.7 |
| C | 1 | 80 | 4671 | 7.59 | 1631 | 1524 | 414.8 |
| C | 1 | 81 | 4606 | 7.43 | 1631 | 1524 | 414.8 |
| C | 12 | 241 | 4272 | 6.62 | 1631 | 1524 | 414.8 |
| D | 6 | 231 | 3811 | 6.09 | 1514 | 1380 | 399.2 |
| D | 3 | 14 | 3769 | 5.98 | 1514 | 1380 | 399.2 |
| D | 10 | 189 | 3697 | 5.8 | 1514 | 1380 | 399.2 |
Histogram calculated using DETX and DETY for each event in the final _common_clean file
| Quadrant A | 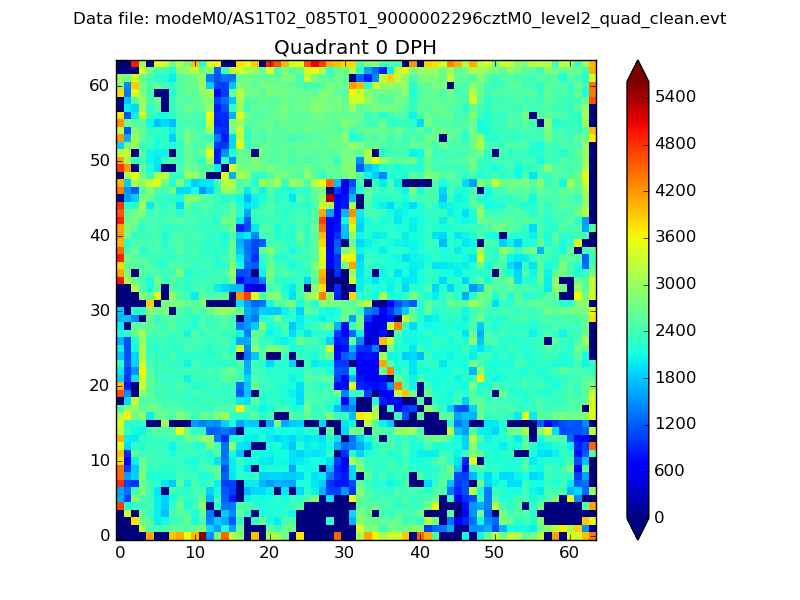 |
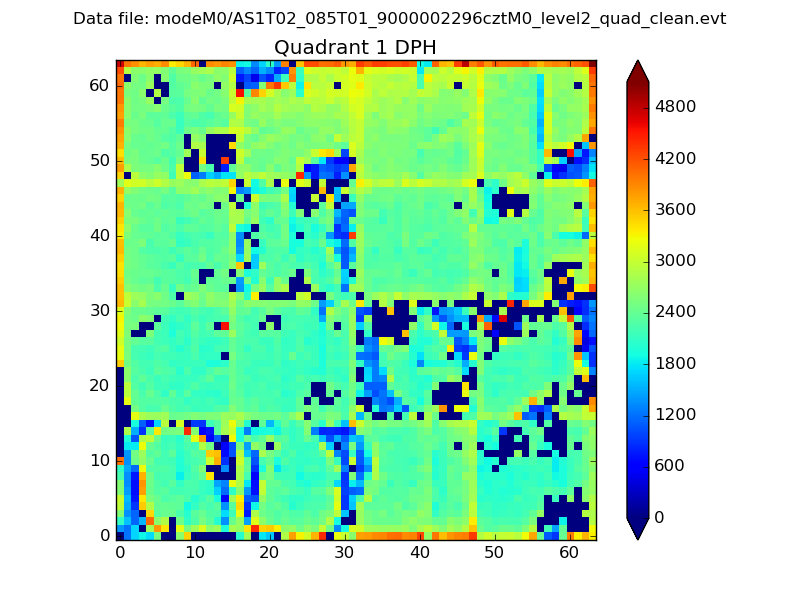 |
Quadrant B |
|---|---|---|---|
| Quadrant D |  |
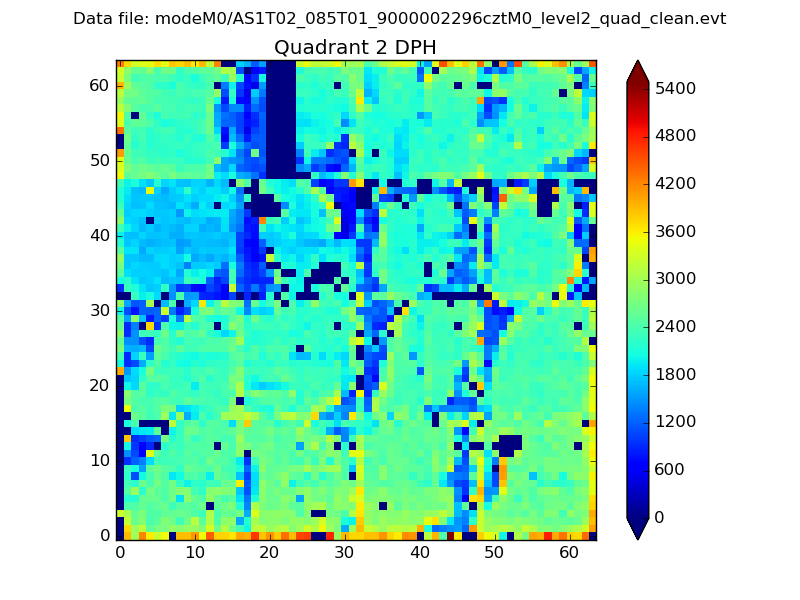 |
Quadrant C |
| Plot type | Count rate plots | Images |
|---|---|---|
| Comparison with Poisson distribution Blue bars denote a histogram of data divided into 1 sec bins. Red curve is a Poisson curve with rate = median count rate of data. |
 |
 |
| Quadrant-wise count rates Data is divided into 100 sec bins |
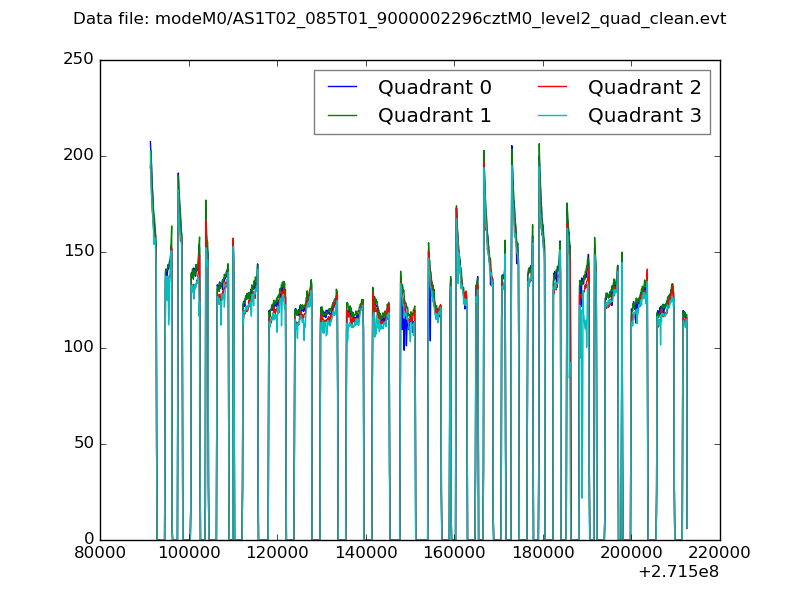 |
|
| Module-wise count rates for Quadrant A Data is divided into 100 sec bins |
 |
 |
| Module-wise count rates for Quadrant B Data is divided into 100 sec bins |
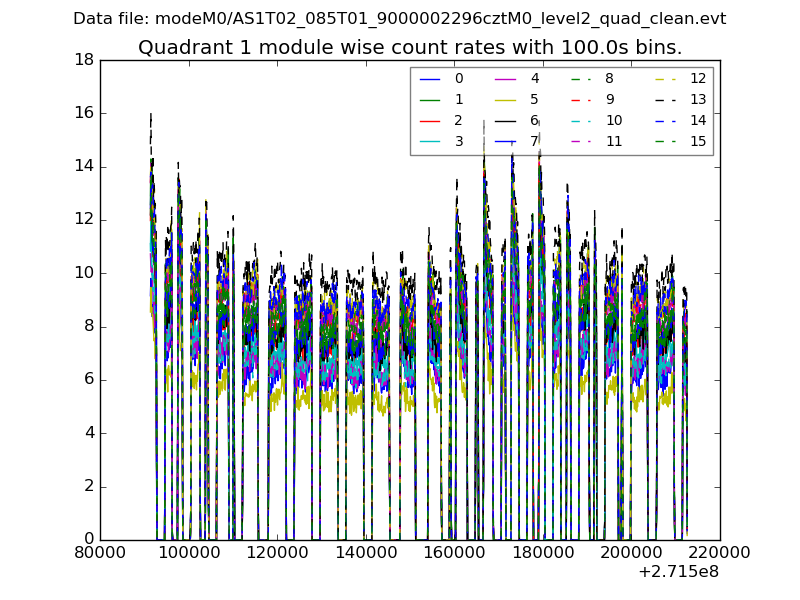 |
 |
| Module-wise count rates for Quadrant C Data is divided into 100 sec bins |
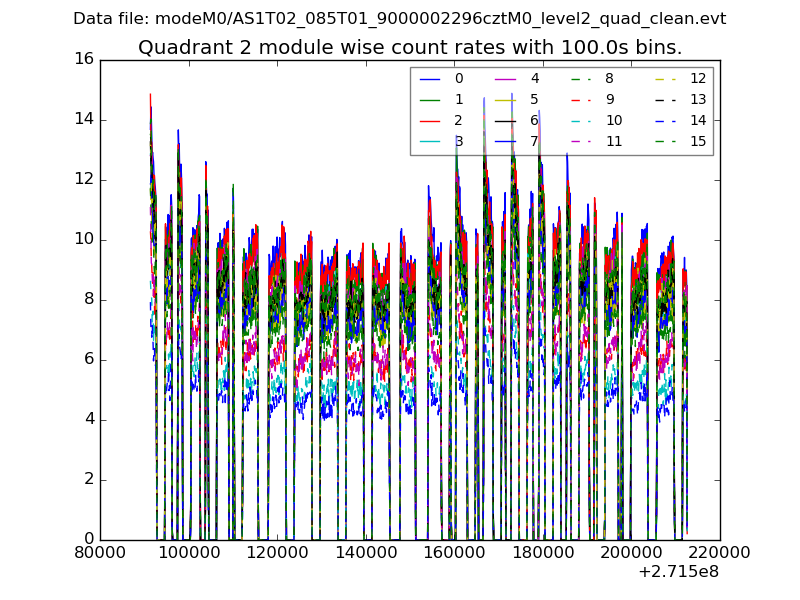 |
 |
| Module-wise count rates for Quadrant D Data is divided into 100 sec bins |
 |
 |
| Parameter | Plot |
|---|---|
| CZT HV Monitor |  |
| D_VDD | 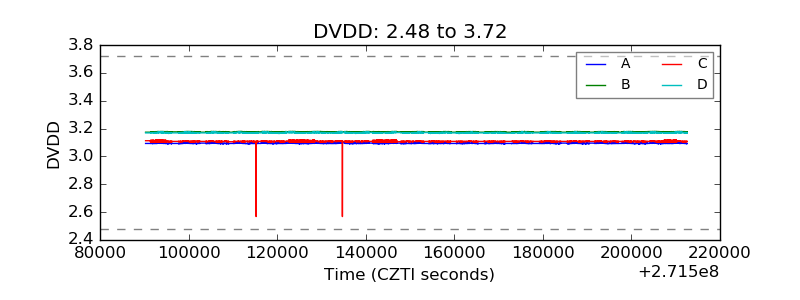 |
| Temperature 1 |  |
| Veto HV Monitor | 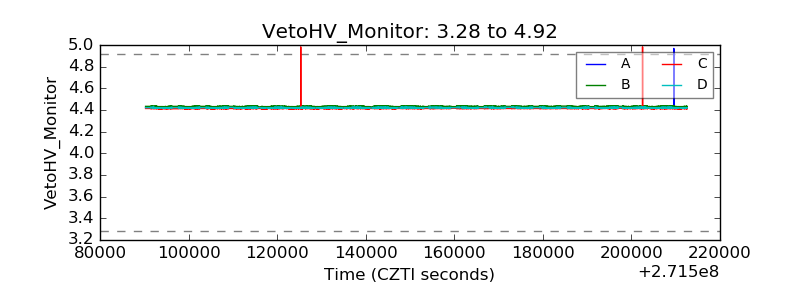 |
| Veto LLD |  |
| Alpha Counter |  |
| _CPM_Rate |  |
| CZT Counter |  |
| +2.5 Volts monitor |  |
| +5 Volts monitor | 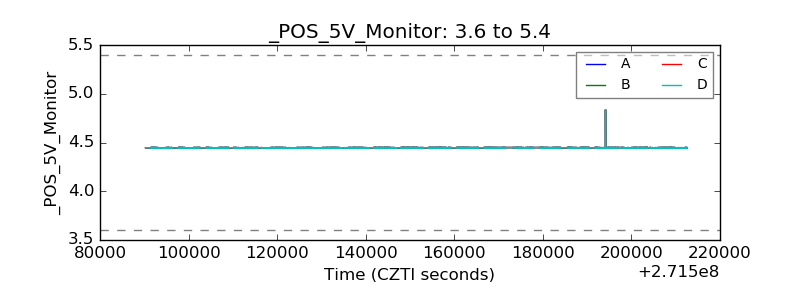 |
| _ROLL_ROT |  |
| _Roll_DEC | 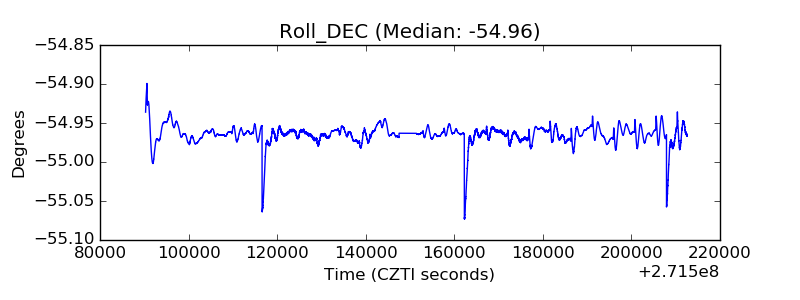 |
| _Roll_RA |  |
| Veto Counter |  |