| Param | Original file | Final file |
|---|---|---|
| Filename | modeM0/AS1T02_085T01_9000002296_15503cztM0_level2.evt | modeM0/AS1T02_085T01_9000002296_15503cztM0_level2_quad_clean.evt |
| Size (bytes) | 469,402,560 | 74,960,640 |
| Size | 447.7 MB | 71.5 MB |
| Events in quadrant A | 3,128,502 | 473,411 |
| Events in quadrant B | 3,276,918 | 478,689 |
| Events in quadrant C | 3,251,038 | 454,038 |
| Events in quadrant D | 4,150,106 | 442,646 |
| Mode SS | |||
|---|---|---|---|
| Quadrant | BADHDUFLAG | Total packets | Discarded packets |
| A | 0 | 124 | 0 |
| B | 0 | 124 | 0 |
| C | 0 | 124 | 0 |
| D | 0 | 124 | 0 |
| Mode M9 | |||
|---|---|---|---|
| Quadrant | BADHDUFLAG | Total packets | Discarded packets |
| A | 0 | 12 | 0 |
| B | 0 | 12 | 0 |
| C | 0 | 12 | 0 |
| D | 0 | 12 | 0 |
| Mode M0 | |||
|---|---|---|---|
| Quadrant | BADHDUFLAG | Total packets | Discarded packets |
| A | 0 | 12863 | 2 |
| B | 0 | 13251 | 1 |
| C | 0 | 12950 | 1 |
| D | 0 | 16162 | 1 |
| Quadrant | Total seconds | Saturated seconds | Saturation percentage |
|---|---|---|---|
| A | 6024 | 101 | 1.676627% |
| B | 6024 | 99 | 1.643426% |
| C | 6024 | 127 | 2.108234% |
| D | 6024 | 297 | 4.930279% |
Noise dominated data is calculated using 1-second bins in cleaned event files. If a bin has >2000 counts, and if more than 50% of those come from <1% of pixels, then it is considered to be noise-dominated and hence unusable.
| Quadrant | # 1 sec bins | Bins with >0 counts | Bins with >2000 counts | High rate bins dominated by noise | Noise dominated (total time) | Noise dominated (detector-on time) | Marked lightcurve |
|---|---|---|---|---|---|---|---|
| A | 7275 | 6025 | 4 | 4 | 0.05% | 0.07% | 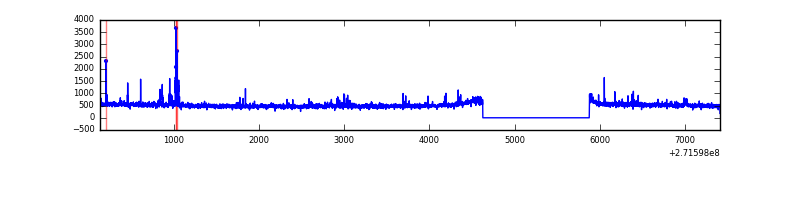 |
| B | 7275 | 6026 | 7 | 7 | 0.10% | 0.12% | 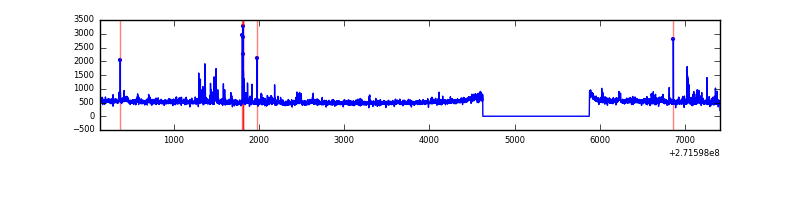 |
| C | 7275 | 6026 | 0 | 0 | 0.00% | 0.00% | 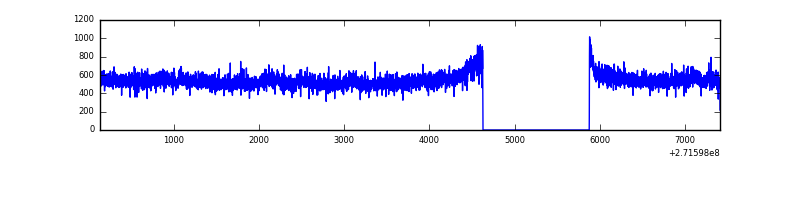 |
| D | 7275 | 6026 | 152 | 152 | 2.09% | 2.52% | 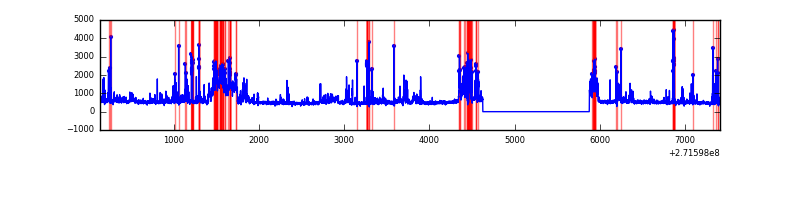 |
Top three noisy pixels from each quadrant. If the there are fewer than three noisy pixels in the level2.evt file, extra rows are filled as -1
| Pixel properties | Quadrant properties | ||||||
|---|---|---|---|---|---|---|---|
| Quadrant | DetID | PixID | Counts | Sigma | Mean | Median | Sigma |
| A | 14 | 238 | 70911 | 448.4 | 783 | 765 | 156.4 |
| A | 9 | 143 | 19864 | 122.09 | 783 | 765 | 156.4 |
| A | 15 | 69 | 9511 | 55.91 | 783 | 765 | 156.4 |
| B | 4 | 142 | 63627 | 439.19 | 774 | 755 | 143.2 |
| B | 0 | 189 | 32556 | 222.14 | 774 | 755 | 143.2 |
| B | 4 | 80 | 26450 | 179.49 | 774 | 755 | 143.2 |
| C | 3 | 233 | 247313 | 1448.76 | 740 | 746 | 170.2 |
| C | 14 | 238 | 117013 | 683.15 | 740 | 746 | 170.2 |
| C | 13 | 61 | 5205 | 26.2 | 740 | 746 | 170.2 |
| D | 1 | 52 | 756758 | 4173.99 | 749 | 727 | 181.1 |
| D | 5 | 222 | 296130 | 1630.89 | 749 | 727 | 181.1 |
| D | 10 | 70 | 154356 | 848.17 | 749 | 727 | 181.1 |
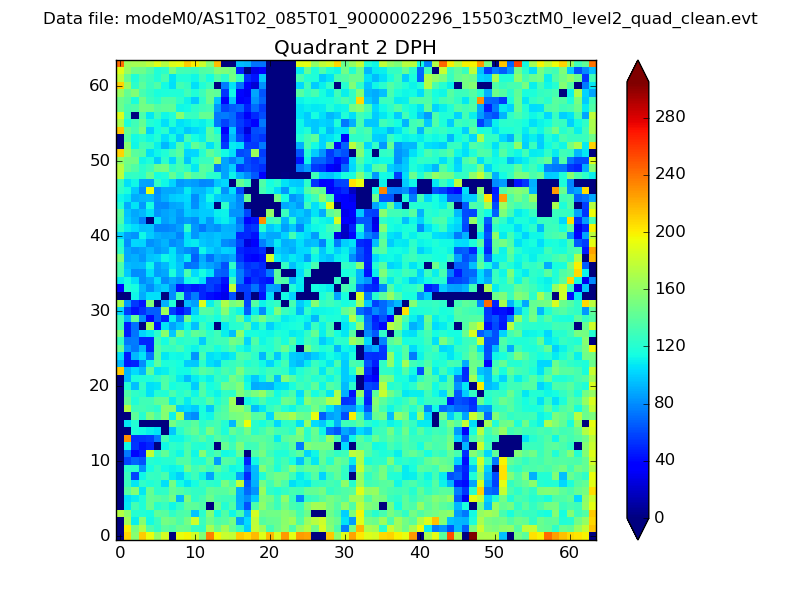
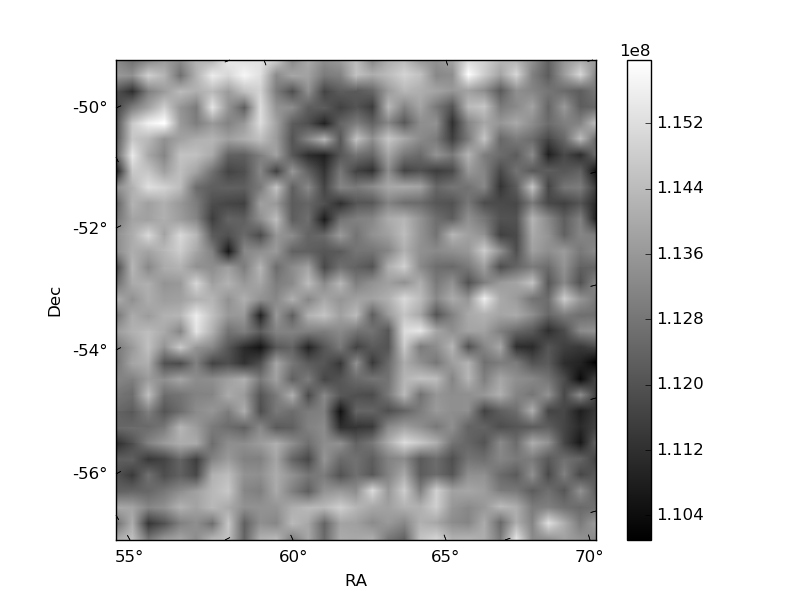
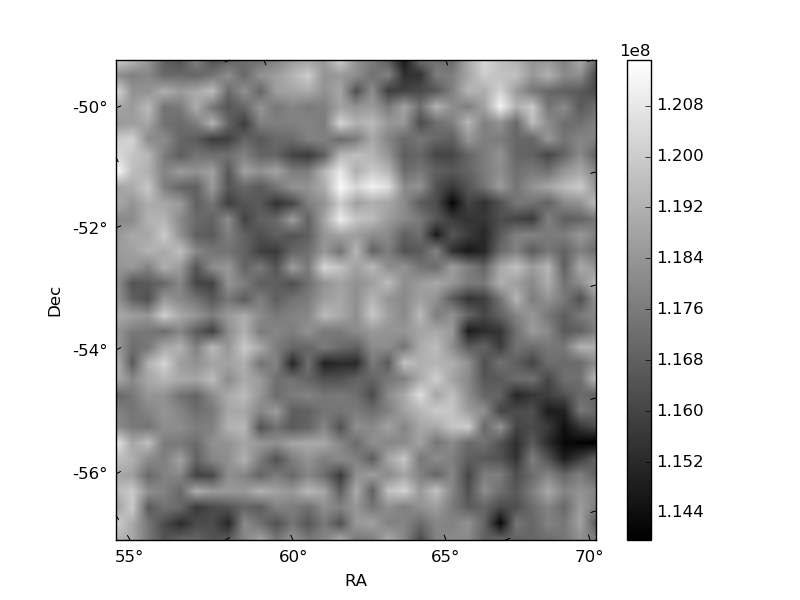
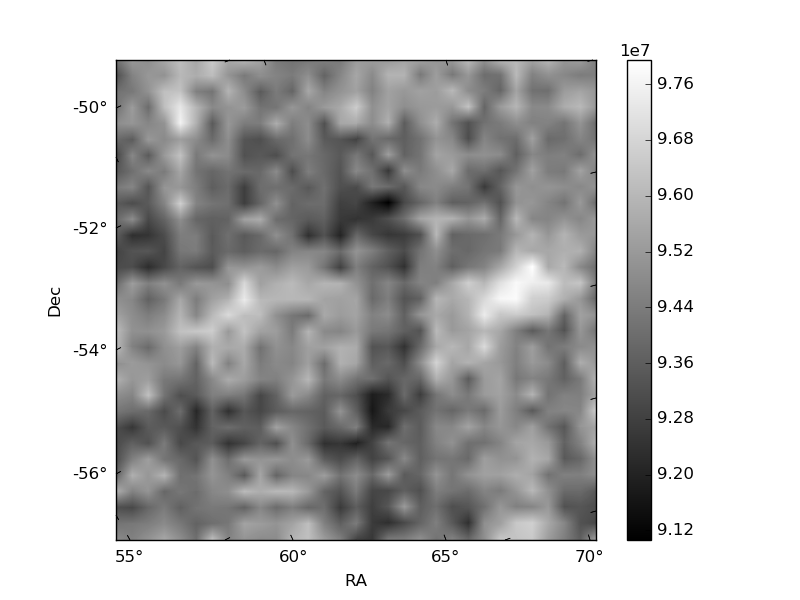
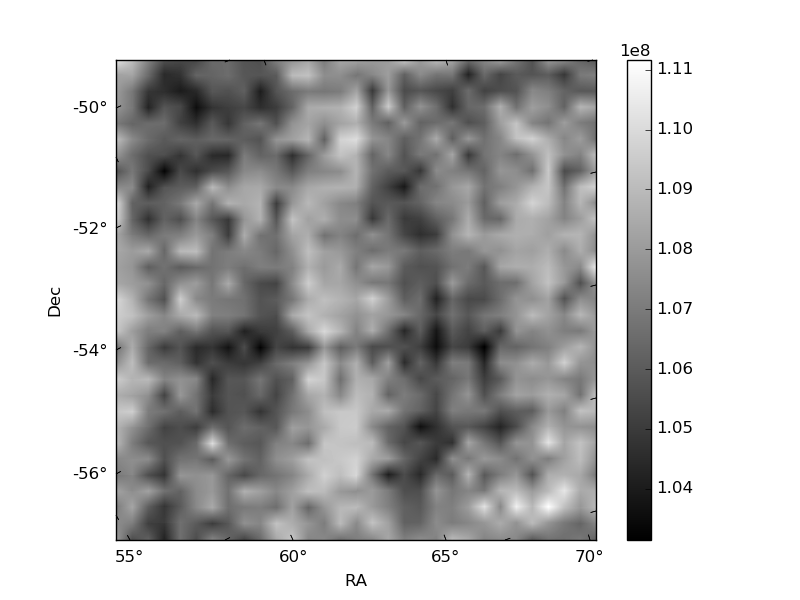
Histogram calculated using DETX and DETY for each event in the final _common_clean file
| Quadrant A | 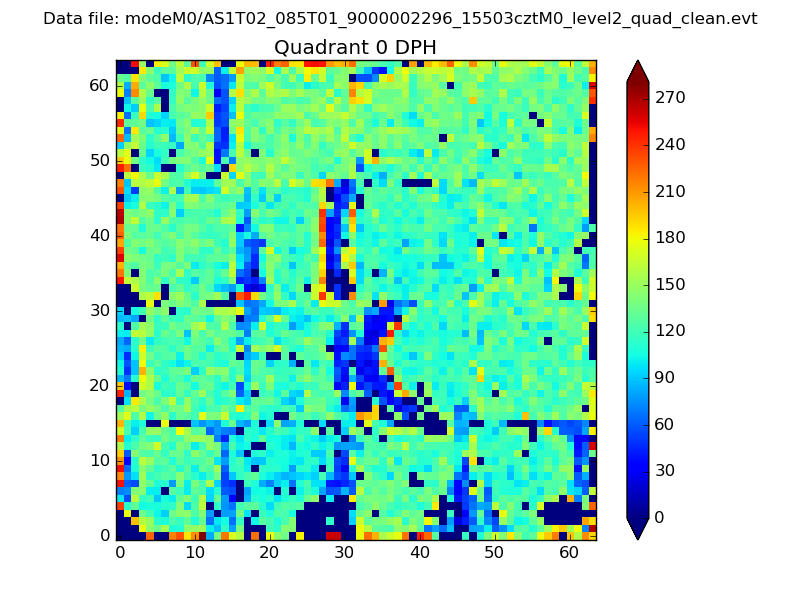 |
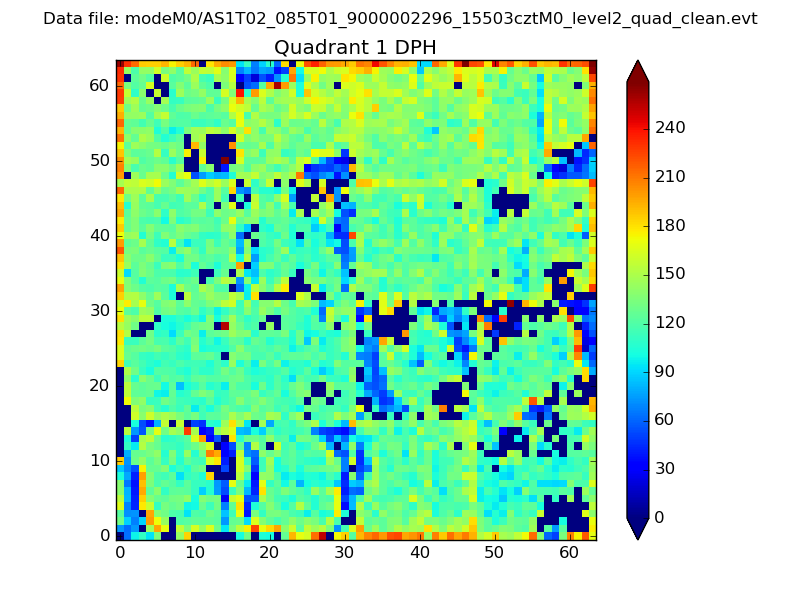 |
Quadrant B |
|---|---|---|---|
| Quadrant D | 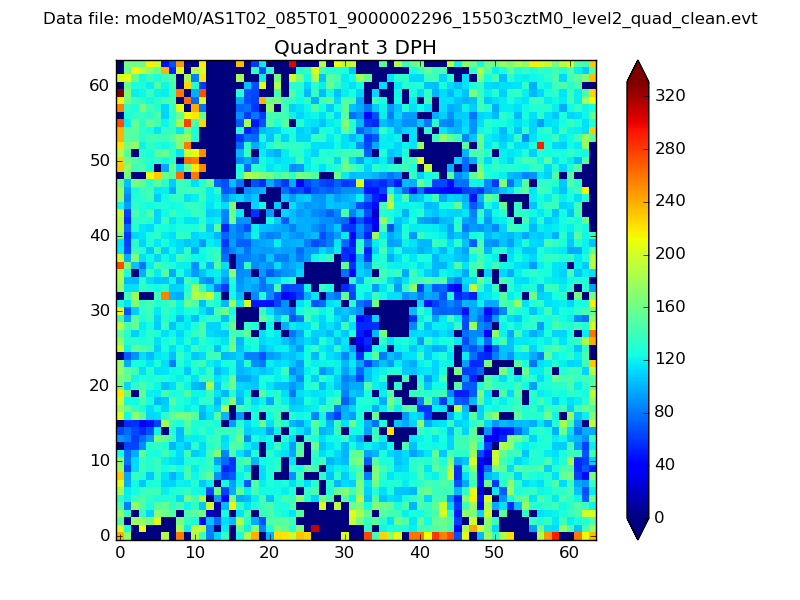 |
 |
Quadrant C |
| Plot type | Count rate plots | Images |
|---|---|---|
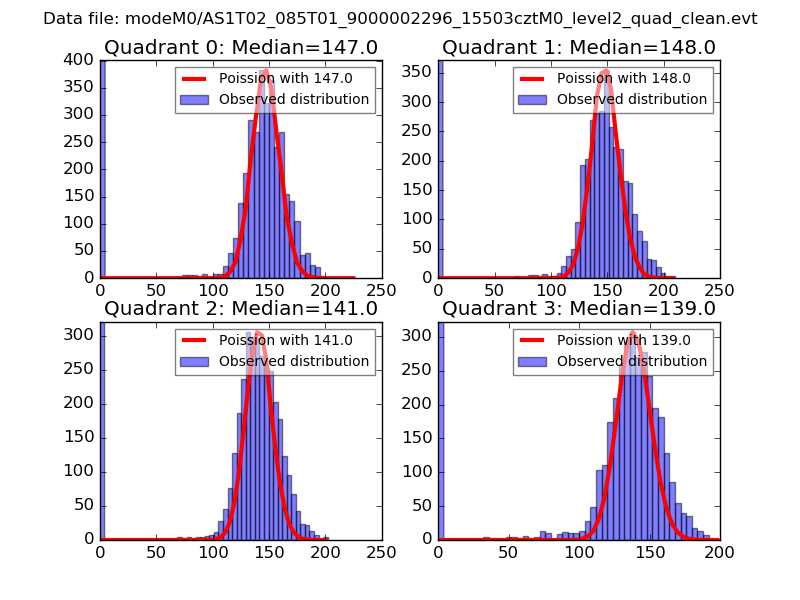
| Comparison with Poisson distribution Blue bars denote a histogram of data divided into 1 sec bins. Red curve is a Poisson curve with rate = median count rate of data. |
 |
 |
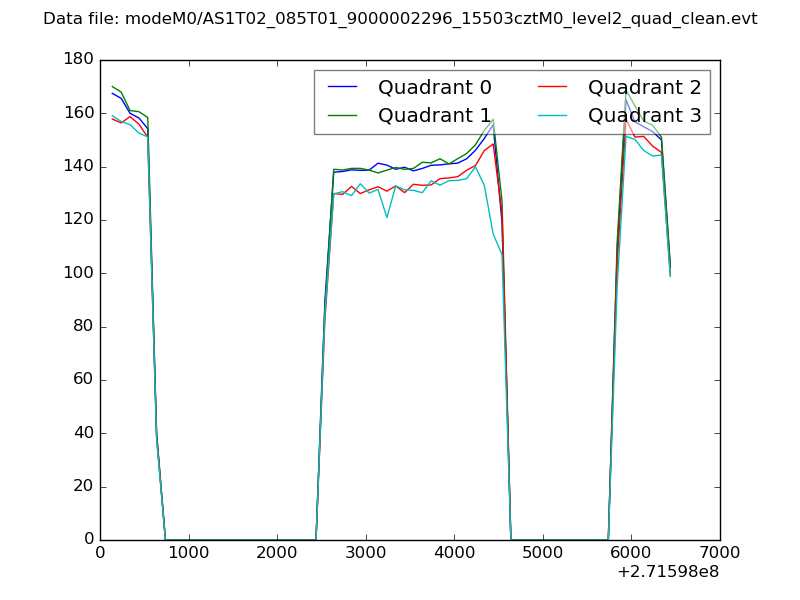
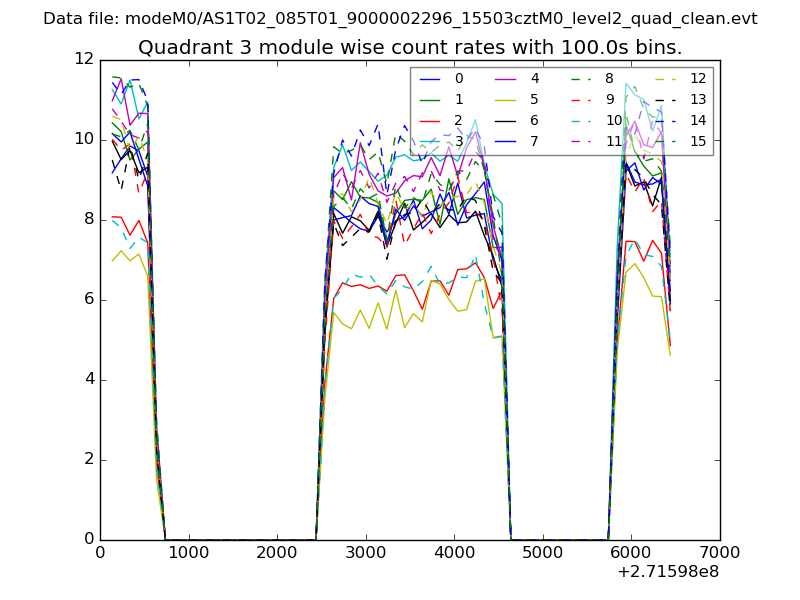
| Quadrant-wise count rates Data is divided into 100 sec bins |
 |
|
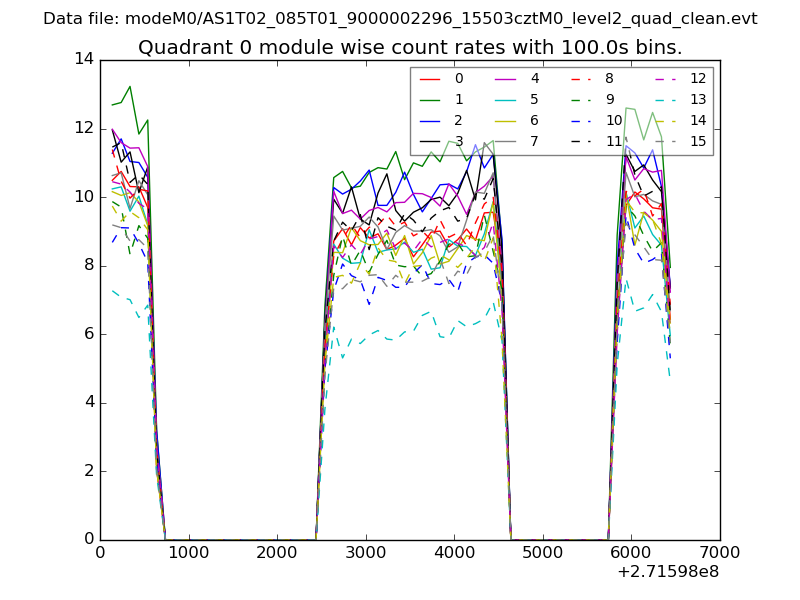
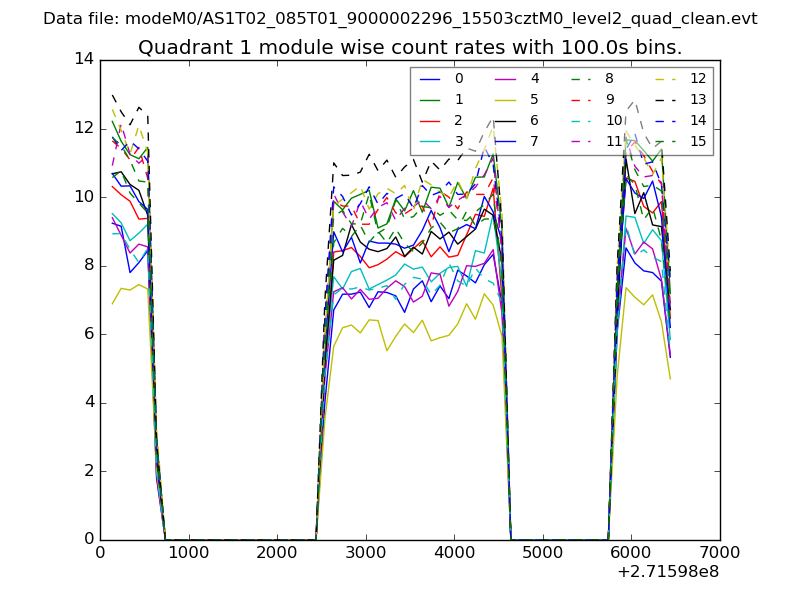
| Module-wise count rates for Quadrant A Data is divided into 100 sec bins |
 |
 |
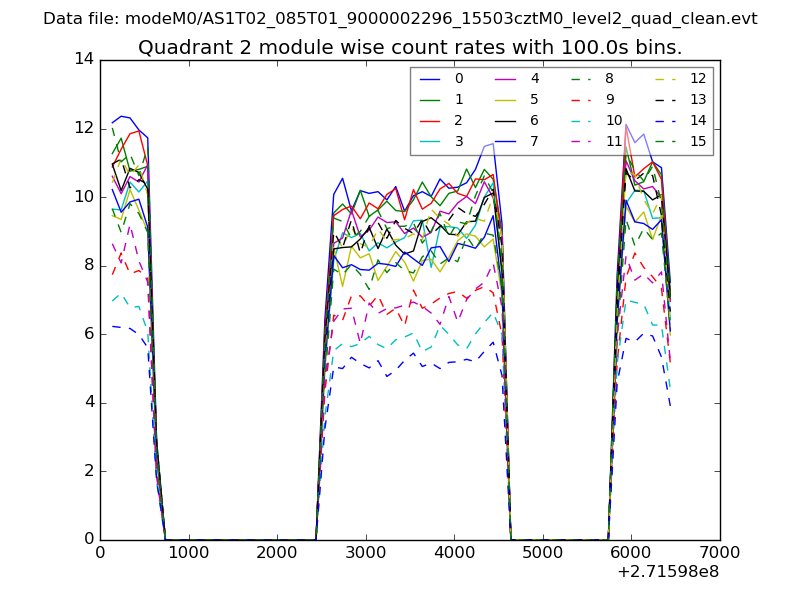
| Module-wise count rates for Quadrant B Data is divided into 100 sec bins |
 |
 |
| Module-wise count rates for Quadrant C Data is divided into 100 sec bins |
 |
 |
| Module-wise count rates for Quadrant D Data is divided into 100 sec bins |
 |
 |
| Parameter | Plot |
|---|---|
| CZT HV Monitor | 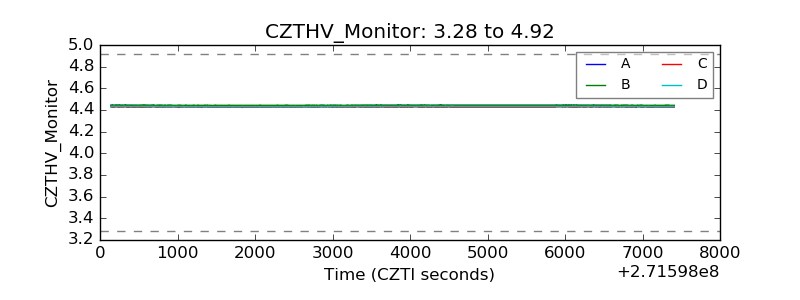 |
| D_VDD | 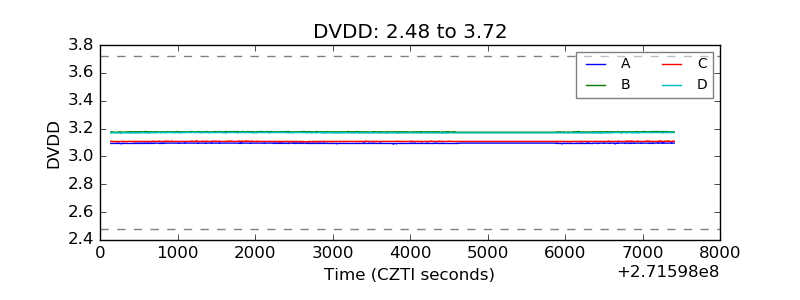 |
| Temperature 1 | 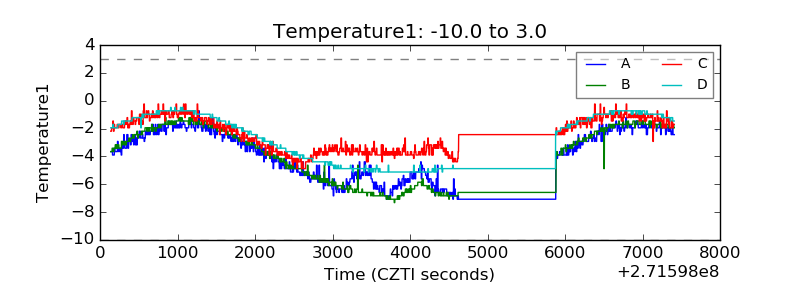 |
| Veto HV Monitor | 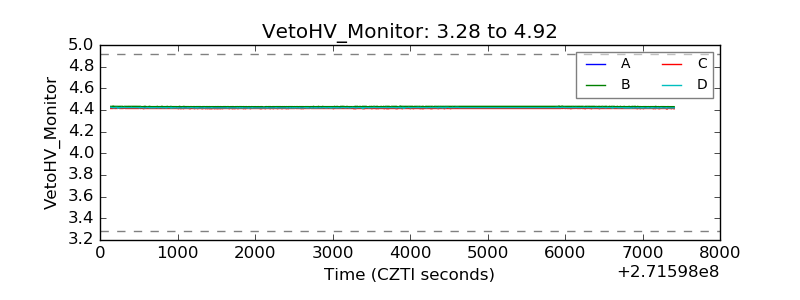 |
| Veto LLD |  |
| Alpha Counter | 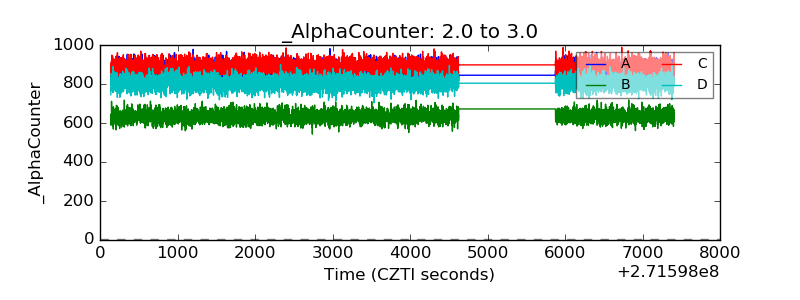 |
| _CPM_Rate | 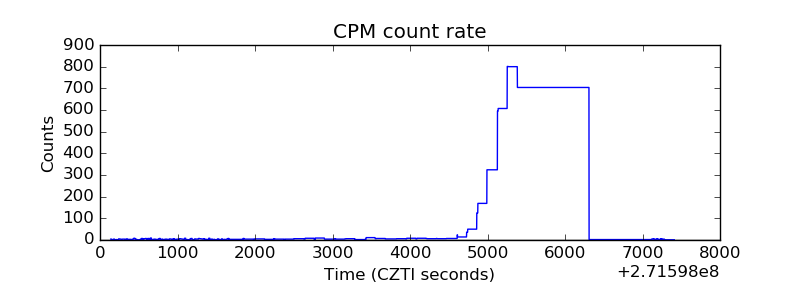 |
| CZT Counter | 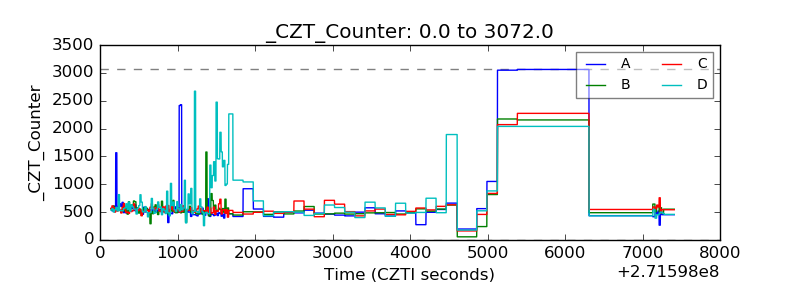 |
| +2.5 Volts monitor |  |
| +5 Volts monitor |  |
| _ROLL_ROT | 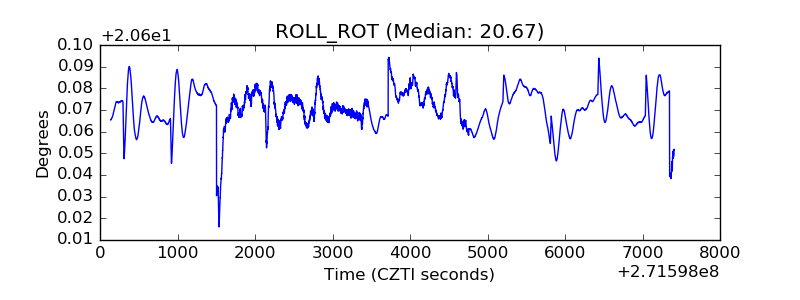 |
| _Roll_DEC | 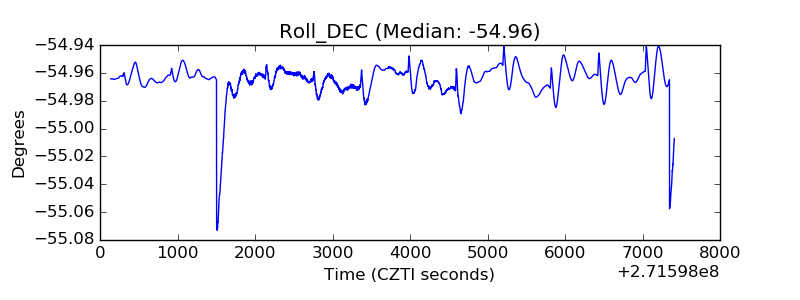 |
| _Roll_RA | 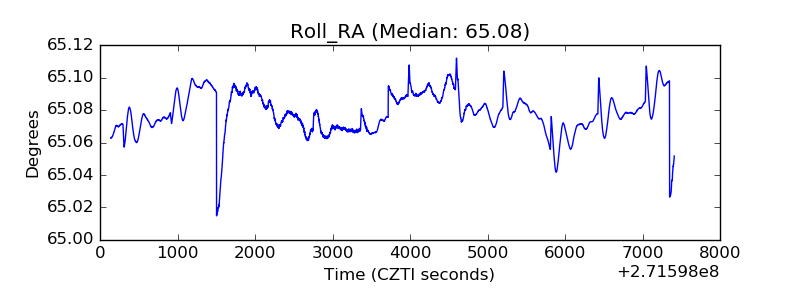 |
| Veto Counter | 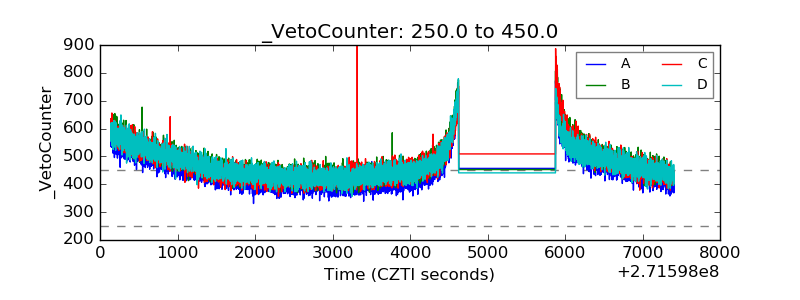 |