| Param | Original file | Final file |
|---|---|---|
| Filename | modeM0/AS1T02_085T01_9000002296_15504cztM0_level2.evt | modeM0/AS1T02_085T01_9000002296_15504cztM0_level2_quad_clean.evt |
| Size (bytes) | 506,272,320 | 79,750,080 |
| Size | 482.8 MB | 76.1 MB |
| Events in quadrant A | 3,348,867 | 497,488 |
| Events in quadrant B | 3,548,633 | 501,996 |
| Events in quadrant C | 3,632,119 | 479,722 |
| Events in quadrant D | 4,349,480 | 470,019 |
| Mode SS | |||
|---|---|---|---|
| Quadrant | BADHDUFLAG | Total packets | Discarded packets |
| A | 0 | 136 | 0 |
| B | 0 | 136 | 0 |
| C | 0 | 136 | 0 |
| D | 0 | 136 | 0 |
| Mode M9 | |||
|---|---|---|---|
| Quadrant | BADHDUFLAG | Total packets | Discarded packets |
| A | 0 | 9 | 0 |
| B | 0 | 9 | 0 |
| C | 0 | 9 | 0 |
| D | 0 | 9 | 0 |
| Mode M0 | |||
|---|---|---|---|
| Quadrant | BADHDUFLAG | Total packets | Discarded packets |
| A | 0 | 14080 | 2 |
| B | 0 | 14519 | 1 |
| C | 0 | 14829 | 1 |
| D | 0 | 17198 | 1 |
| Quadrant | Total seconds | Saturated seconds | Saturation percentage |
|---|---|---|---|
| A | 6677 | 118 | 1.767261% |
| B | 6677 | 121 | 1.812191% |
| C | 6677 | 124 | 1.857121% |
| D | 6677 | 283 | 4.238430% |
Noise dominated data is calculated using 1-second bins in cleaned event files. If a bin has >2000 counts, and if more than 50% of those come from <1% of pixels, then it is considered to be noise-dominated and hence unusable.
| Quadrant | # 1 sec bins | Bins with >0 counts | Bins with >2000 counts | High rate bins dominated by noise | Noise dominated (total time) | Noise dominated (detector-on time) | Marked lightcurve |
|---|---|---|---|---|---|---|---|
| A | 7653 | 6678 | 7 | 7 | 0.09% | 0.10% | 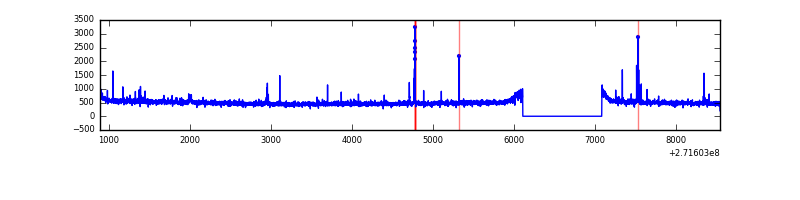 |
| B | 7653 | 6679 | 5 | 5 | 0.07% | 0.07% | 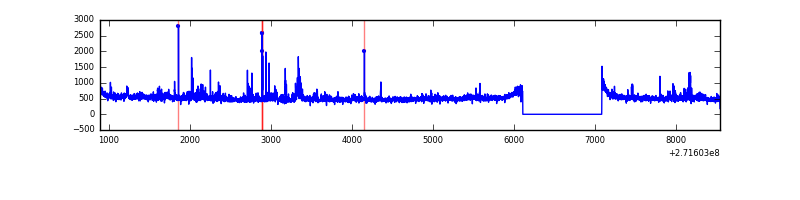 |
| C | 7653 | 6678 | 0 | 0 | 0.00% | 0.00% | 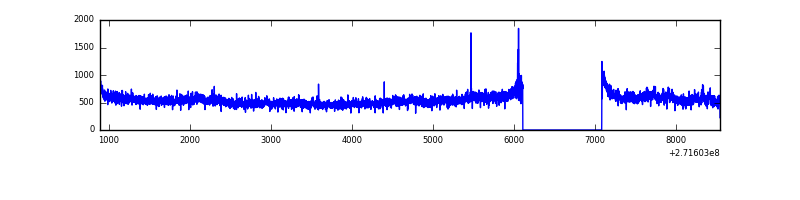 |
| D | 7653 | 6678 | 197 | 197 | 2.57% | 2.95% | 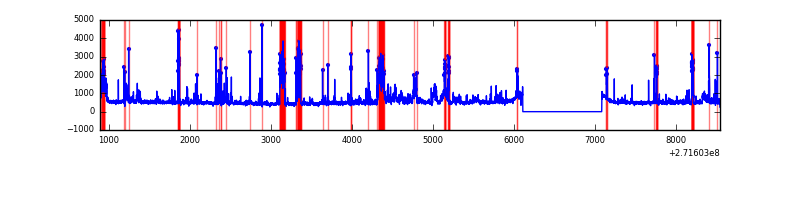 |
Top three noisy pixels from each quadrant. If the there are fewer than three noisy pixels in the level2.evt file, extra rows are filled as -1
| Pixel properties | Quadrant properties | ||||||
|---|---|---|---|---|---|---|---|
| Quadrant | DetID | PixID | Counts | Sigma | Mean | Median | Sigma |
| A | 14 | 238 | 45954 | 270.35 | 844 | 826 | 166.9 |
| A | 15 | 69 | 27204 | 158.02 | 844 | 826 | 166.9 |
| A | 9 | 143 | 11953 | 66.66 | 844 | 826 | 166.9 |
| B | 4 | 142 | 75610 | 474.05 | 837 | 817 | 157.8 |
| B | 4 | 216 | 45245 | 281.59 | 837 | 817 | 157.8 |
| B | 0 | 189 | 34842 | 215.66 | 837 | 817 | 157.8 |
| C | 3 | 233 | 370788 | 2011.06 | 801 | 807 | 184.0 |
| C | 14 | 238 | 124707 | 673.47 | 801 | 807 | 184.0 |
| C | 10 | 22 | 7446 | 36.09 | 801 | 807 | 184.0 |
| D | 1 | 52 | 884671 | 4467.64 | 815 | 790 | 197.8 |
| D | 5 | 222 | 229478 | 1155.92 | 815 | 790 | 197.8 |
| D | 10 | 70 | 57793 | 288.12 | 815 | 790 | 197.8 |
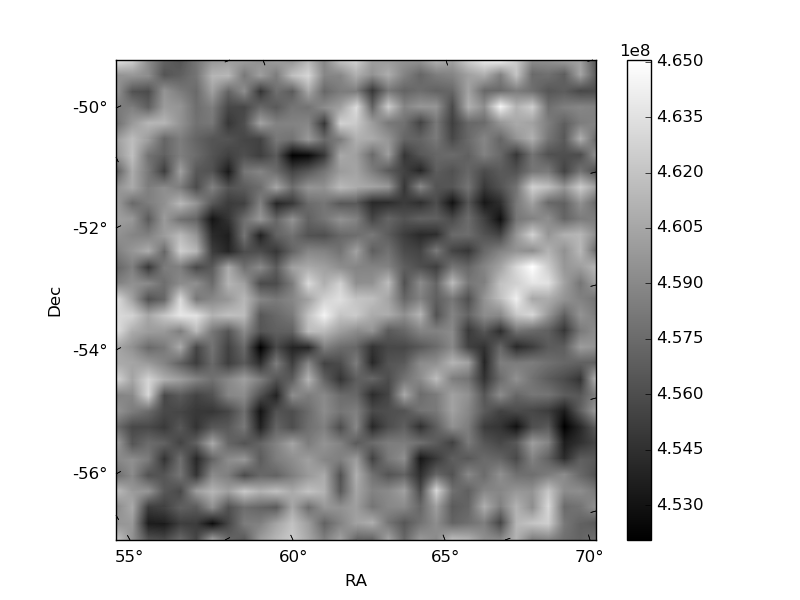
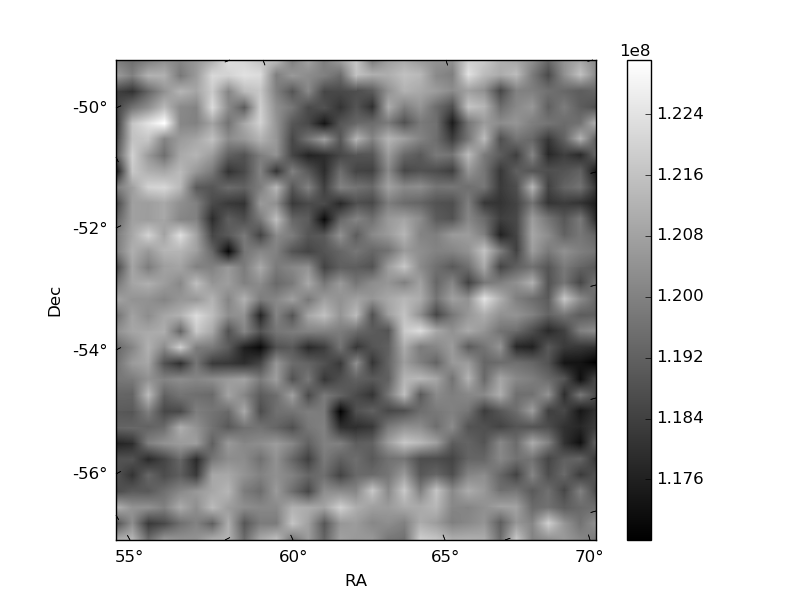
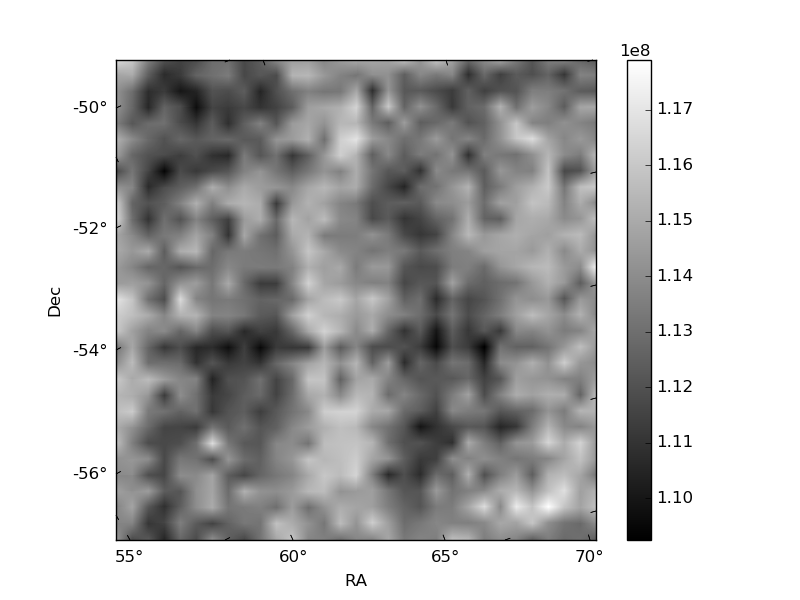
Histogram calculated using DETX and DETY for each event in the final _common_clean file
| Quadrant A | 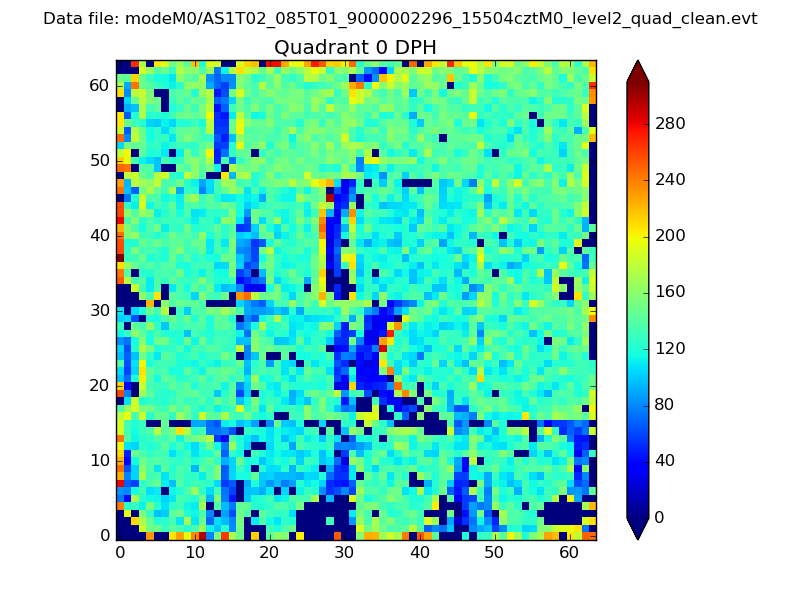 |
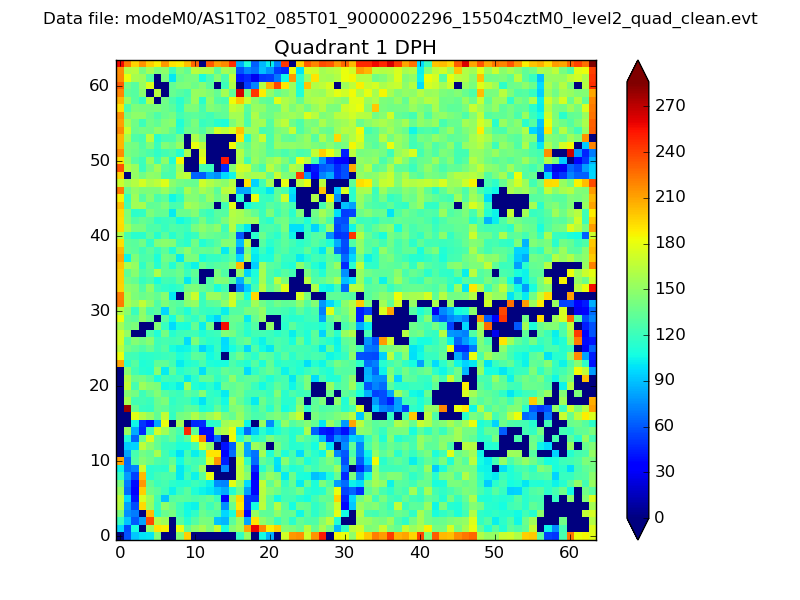 |
Quadrant B |
|---|---|---|---|
| Quadrant D | 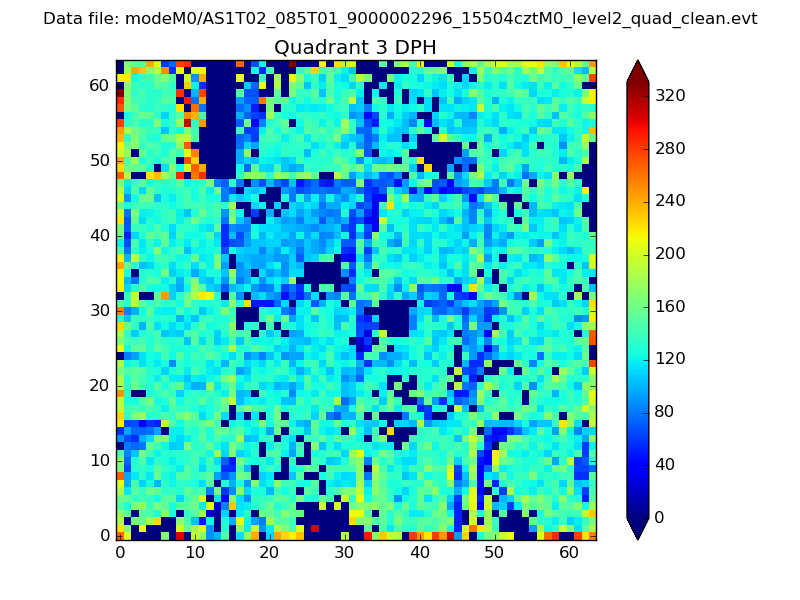 |
 |
Quadrant C |
| Plot type | Count rate plots | Images |
|---|---|---|
| Comparison with Poisson distribution Blue bars denote a histogram of data divided into 1 sec bins. Red curve is a Poisson curve with rate = median count rate of data. |
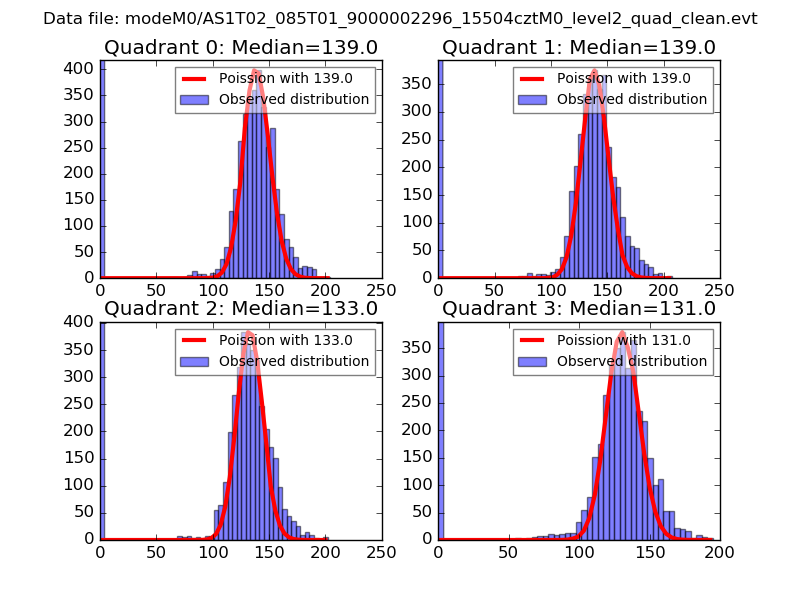 |
 |
| Quadrant-wise count rates Data is divided into 100 sec bins |
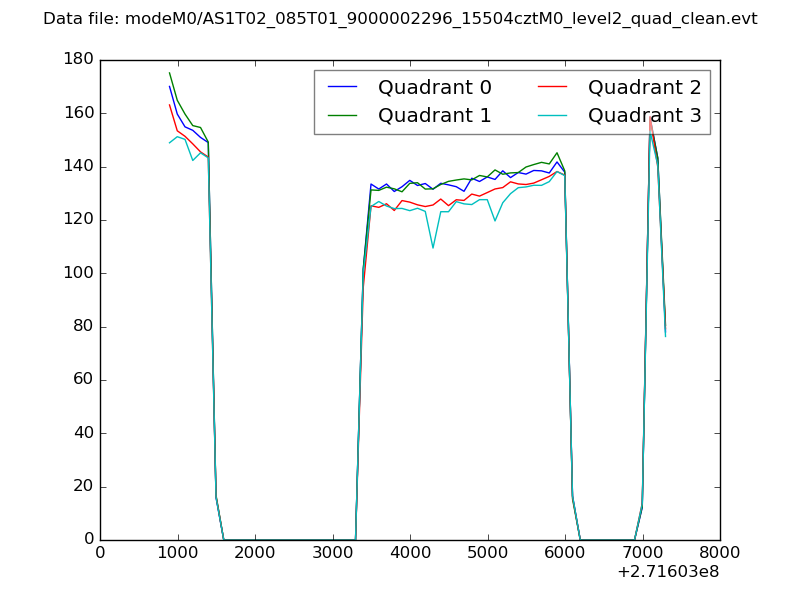 |
|
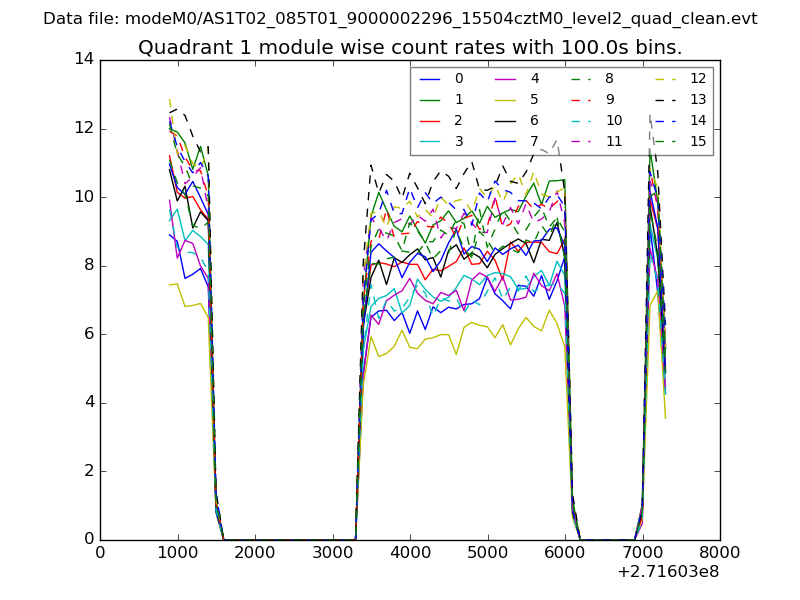
| Module-wise count rates for Quadrant A Data is divided into 100 sec bins |
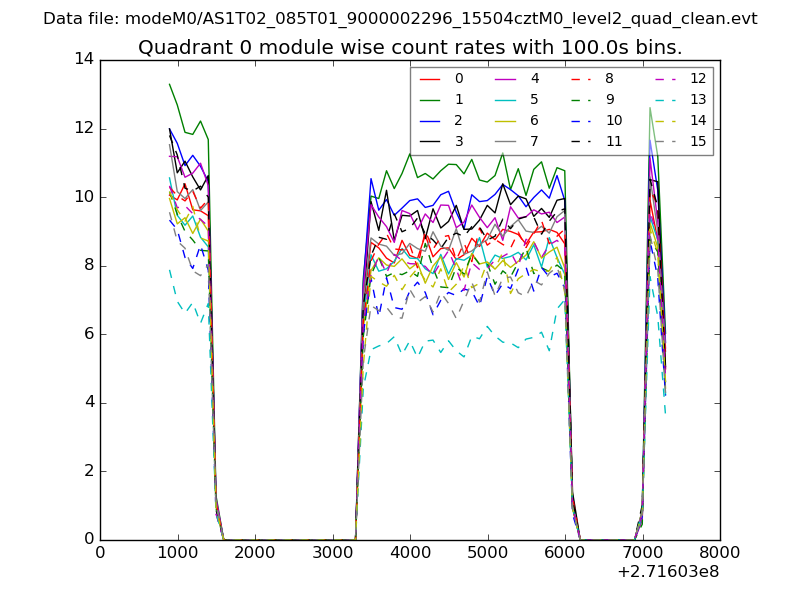 |
 |
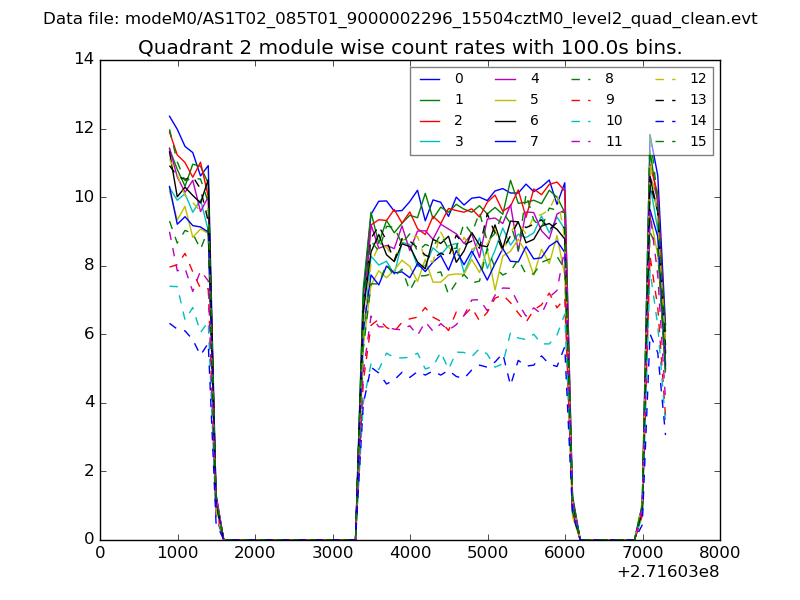
| Module-wise count rates for Quadrant B Data is divided into 100 sec bins |
 |
 |
| Module-wise count rates for Quadrant C Data is divided into 100 sec bins |
 |
 |
| Module-wise count rates for Quadrant D Data is divided into 100 sec bins |
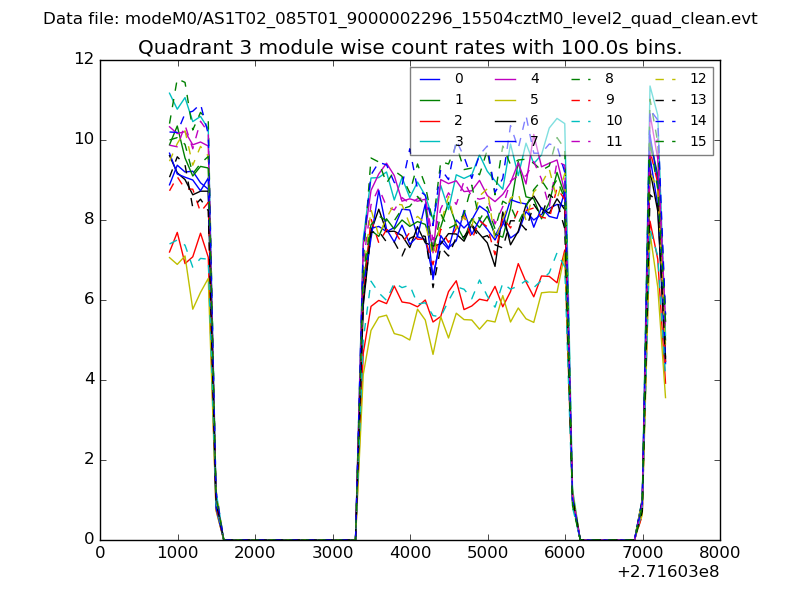 |
 |
| Parameter | Plot |
|---|---|
| CZT HV Monitor | 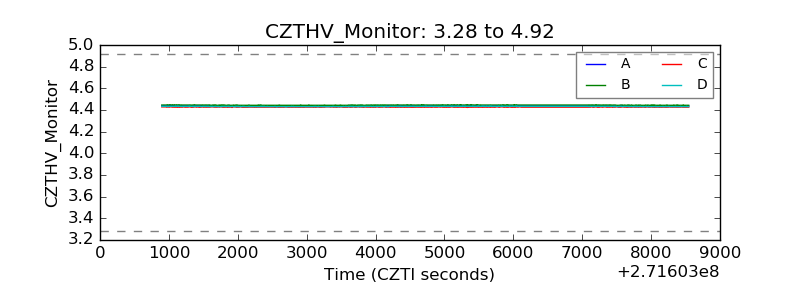 |
| D_VDD | 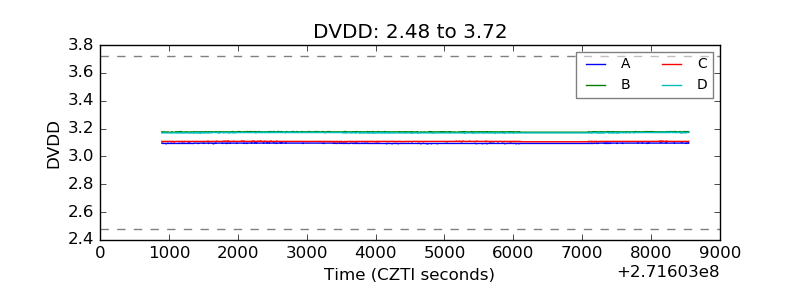 |
| Temperature 1 | 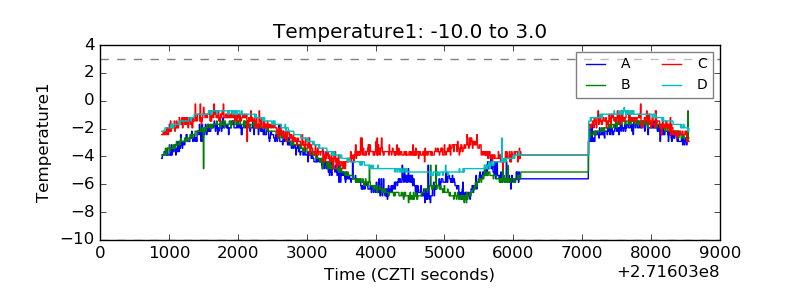 |
| Veto HV Monitor | 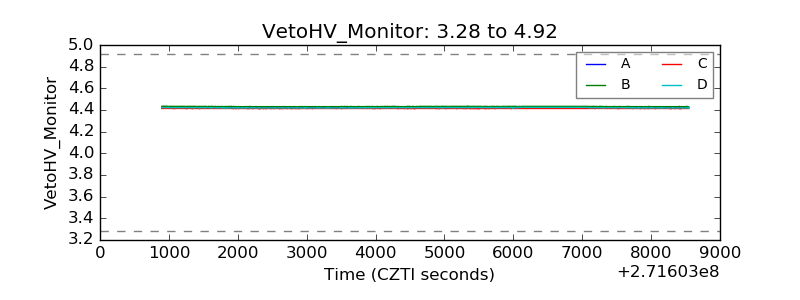 |
| Veto LLD | 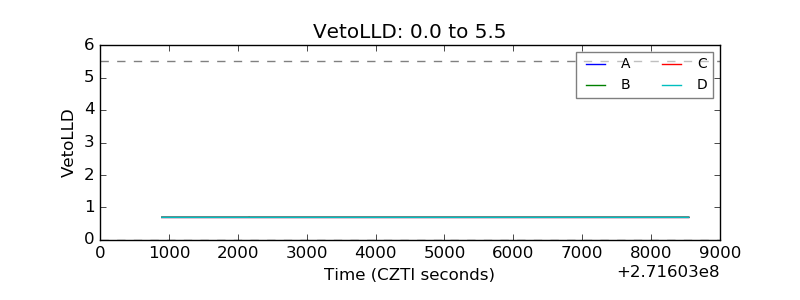 |
| Alpha Counter | 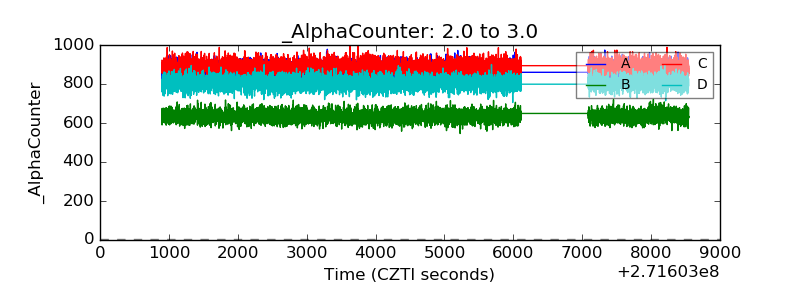 |
| _CPM_Rate | 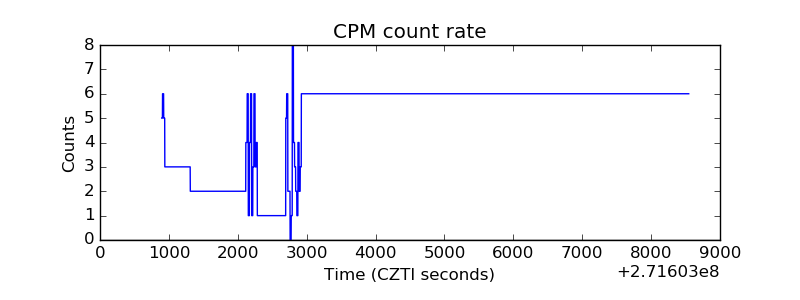 |
| CZT Counter | 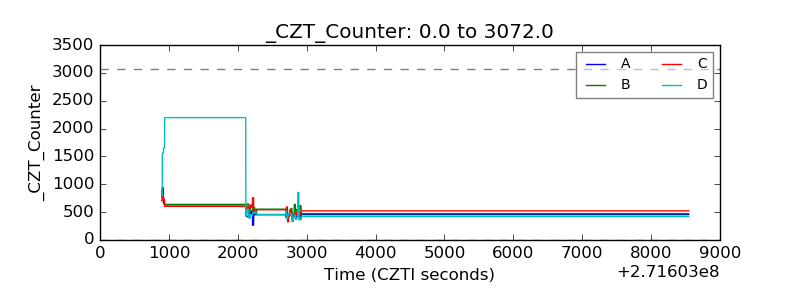 |
| +2.5 Volts monitor | 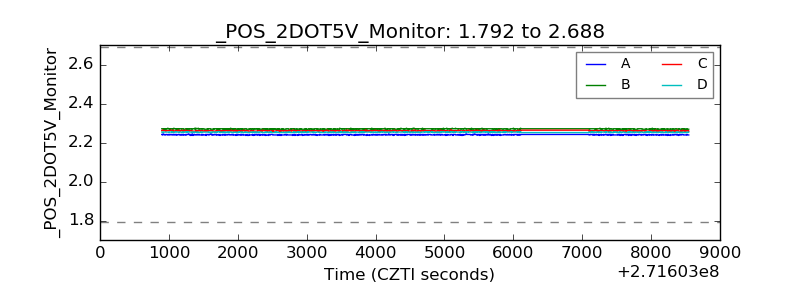 |
| +5 Volts monitor |  |
| _ROLL_ROT | 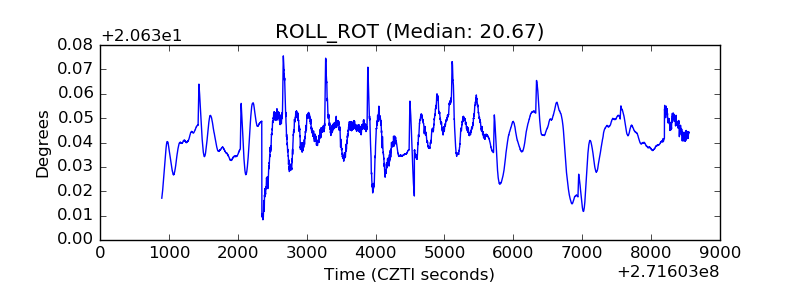 |
| _Roll_DEC |  |
| _Roll_RA | 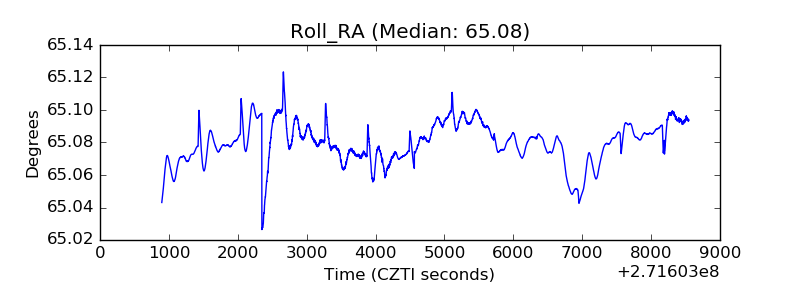 |
| Veto Counter |  |