| Param | Original file | Final file |
|---|---|---|
| Filename | modeM0/AS1T02_085T01_9000002296_15505cztM0_level2.evt | modeM0/AS1T02_085T01_9000002296_15505cztM0_level2_quad_clean.evt |
| Size (bytes) | 1,727,582,400 | 294,459,840 |
| Size | 1.6 GB | 280.8 MB |
| Events in quadrant A | 11,468,602 | 1,888,458 |
| Events in quadrant B | 12,173,825 | 1,903,749 |
| Events in quadrant C | 12,214,326 | 1,813,692 |
| Events in quadrant D | 14,961,355 | 1,780,247 |
| Mode SS | |||
|---|---|---|---|
| Quadrant | BADHDUFLAG | Total packets | Discarded packets |
| A | 0 | 458 | 0 |
| B | 0 | 458 | 0 |
| C | 0 | 458 | 0 |
| D | 0 | 458 | 0 |
| Mode M9 | |||
|---|---|---|---|
| Quadrant | BADHDUFLAG | Total packets | Discarded packets |
| A | 0 | 51 | 0 |
| B | 0 | 51 | 0 |
| C | 0 | 51 | 0 |
| D | 0 | 51 | 0 |
| Mode M0 | |||
|---|---|---|---|
| Quadrant | BADHDUFLAG | Total packets | Discarded packets |
| A | 0 | 48095 | 6 |
| B | 0 | 49713 | 5 |
| C | 0 | 49933 | 5 |
| D | 0 | 59144 | 5 |
| Quadrant | Total seconds | Saturated seconds | Saturation percentage |
|---|---|---|---|
| A | 22245 | 429 | 1.928523% |
| B | 22245 | 447 | 2.009440% |
| C | 22245 | 454 | 2.040908% |
| D | 22245 | 1057 | 4.751630% |
Noise dominated data is calculated using 1-second bins in cleaned event files. If a bin has >2000 counts, and if more than 50% of those come from <1% of pixels, then it is considered to be noise-dominated and hence unusable.
| Quadrant | # 1 sec bins | Bins with >0 counts | Bins with >2000 counts | High rate bins dominated by noise | Noise dominated (total time) | Noise dominated (detector-on time) | Marked lightcurve |
|---|---|---|---|---|---|---|---|
| A | 26421 | 22247 | 45 | 45 | 0.17% | 0.20% | 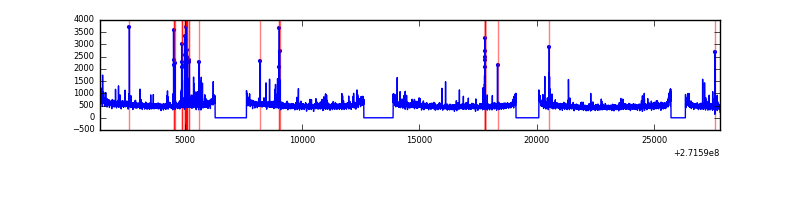 |
| B | 26421 | 22250 | 42 | 42 | 0.16% | 0.19% | 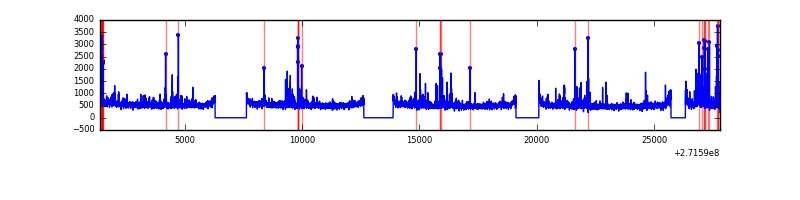 |
| C | 26421 | 22249 | 0 | 0 | 0.00% | 0.00% | 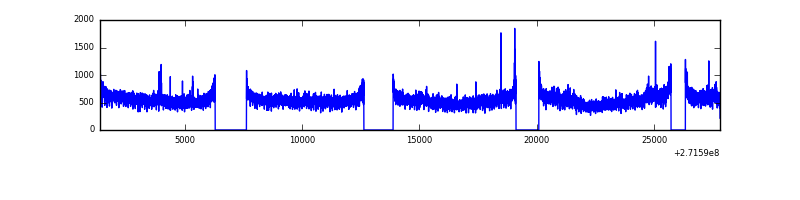 |
| D | 26421 | 22248 | 704 | 704 | 2.66% | 3.16% | 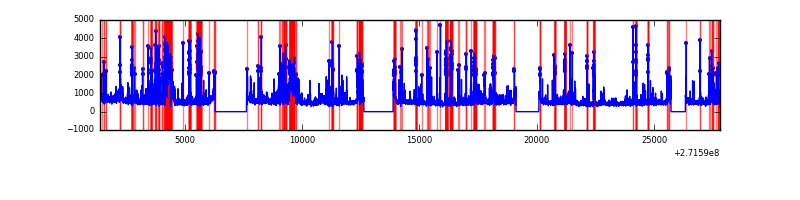 |
Top three noisy pixels from each quadrant. If the there are fewer than three noisy pixels in the level2.evt file, extra rows are filled as -1
| Pixel properties | Quadrant properties | ||||||
|---|---|---|---|---|---|---|---|
| Quadrant | DetID | PixID | Counts | Sigma | Mean | Median | Sigma |
| A | 14 | 238 | 328202 | 578.46 | 2849 | 2782 | 562.6 |
| A | 14 | 237 | 56892 | 96.18 | 2849 | 2782 | 562.6 |
| A | 9 | 143 | 51127 | 85.94 | 2849 | 2782 | 562.6 |
| B | 4 | 142 | 391202 | 747.97 | 2825 | 2758 | 519.3 |
| B | 0 | 189 | 125258 | 235.88 | 2825 | 2758 | 519.3 |
| B | 4 | 216 | 108255 | 203.14 | 2825 | 2758 | 519.3 |
| C | 3 | 233 | 1189105 | 1922.06 | 2706 | 2724 | 617.2 |
| C | 14 | 238 | 423378 | 681.5 | 2706 | 2724 | 617.2 |
| C | 0 | 207 | 32531 | 48.29 | 2706 | 2724 | 617.2 |
| D | 1 | 52 | 3282644 | 4933.83 | 2739 | 2661 | 664.8 |
| D | 5 | 222 | 746479 | 1118.87 | 2739 | 2661 | 664.8 |
| D | 10 | 70 | 331291 | 494.33 | 2739 | 2661 | 664.8 |
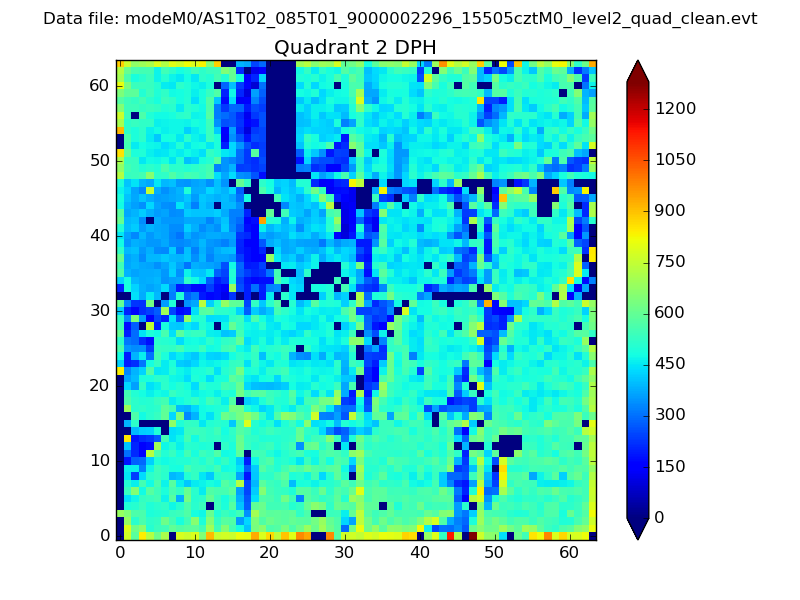
Histogram calculated using DETX and DETY for each event in the final _common_clean file
| Quadrant A |  |
 |
Quadrant B |
|---|---|---|---|
| Quadrant D | 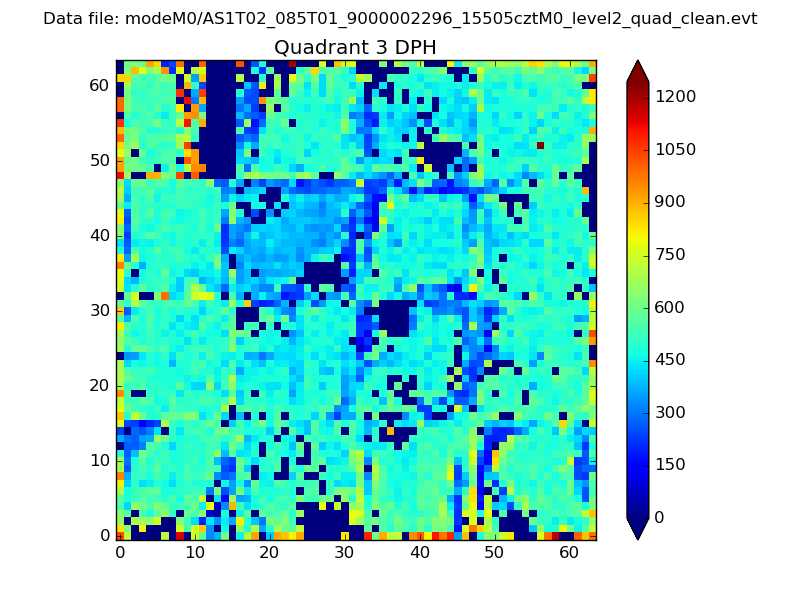 |
 |
Quadrant C |
| Plot type | Count rate plots | Images |
|---|---|---|
| Comparison with Poisson distribution Blue bars denote a histogram of data divided into 1 sec bins. Red curve is a Poisson curve with rate = median count rate of data. |
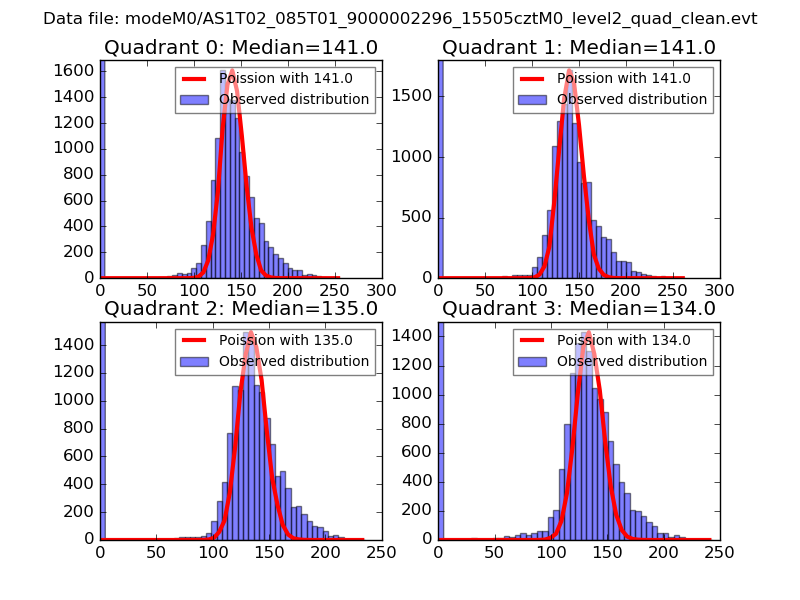 |
 |
| Quadrant-wise count rates Data is divided into 100 sec bins |
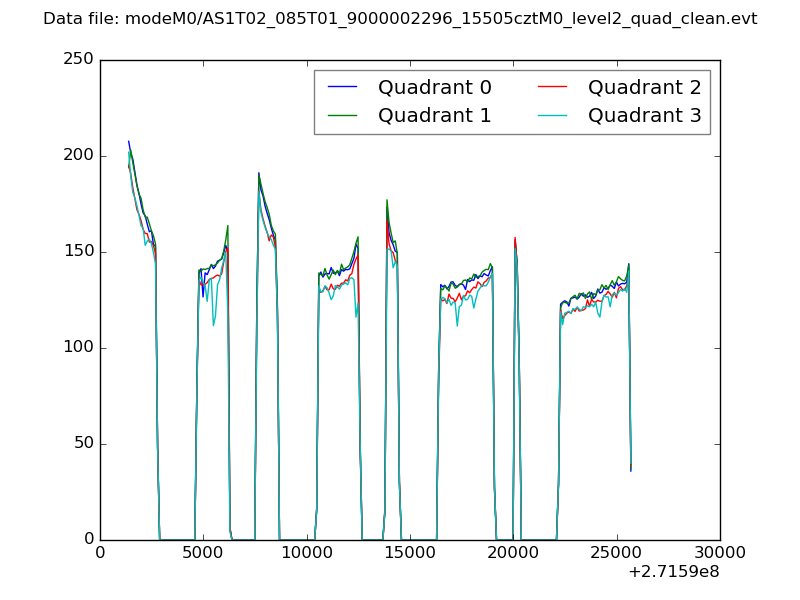 |
|
| Module-wise count rates for Quadrant A Data is divided into 100 sec bins |
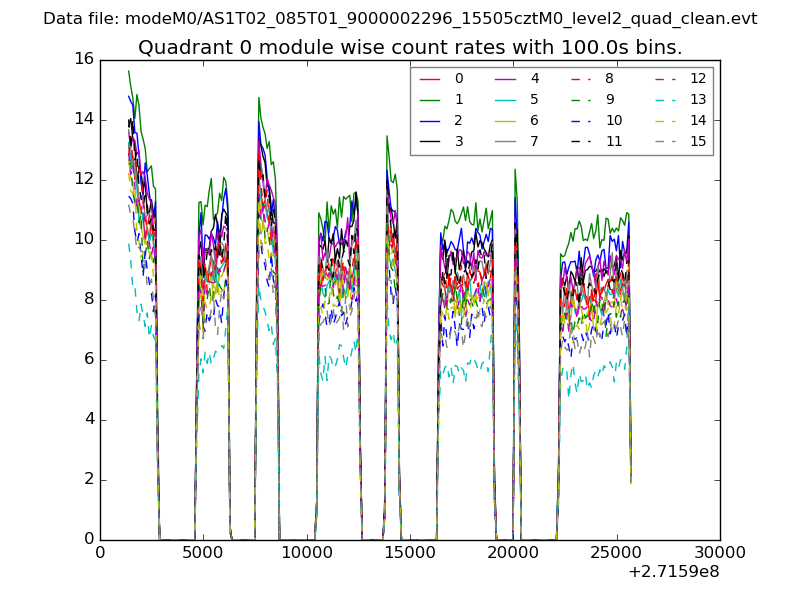 |
 |
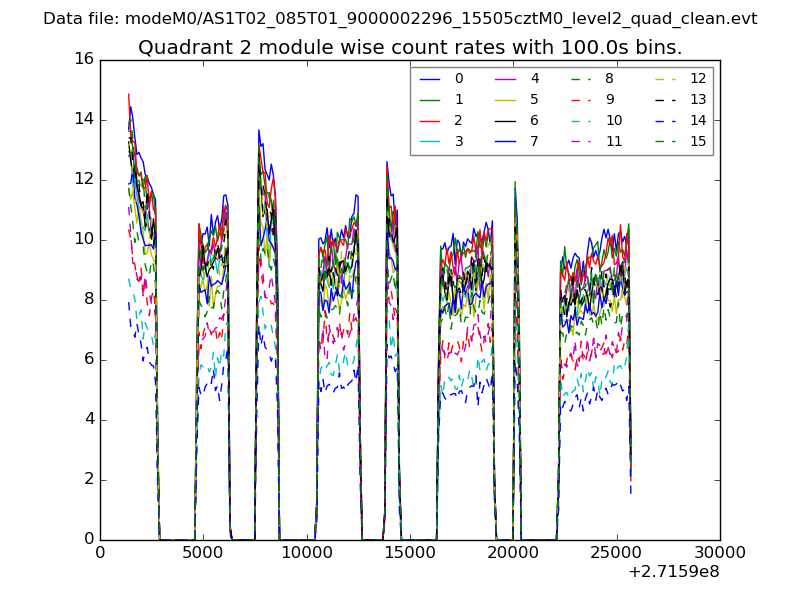
| Module-wise count rates for Quadrant B Data is divided into 100 sec bins |
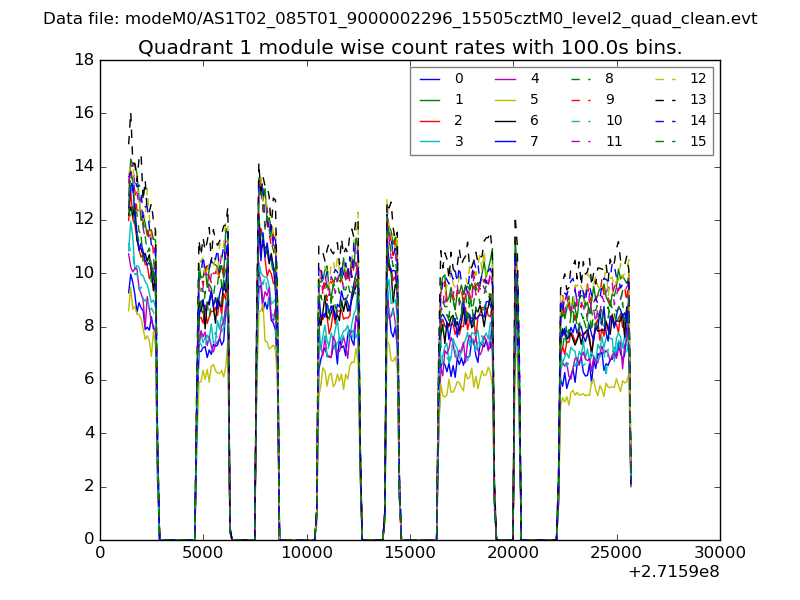 |
 |
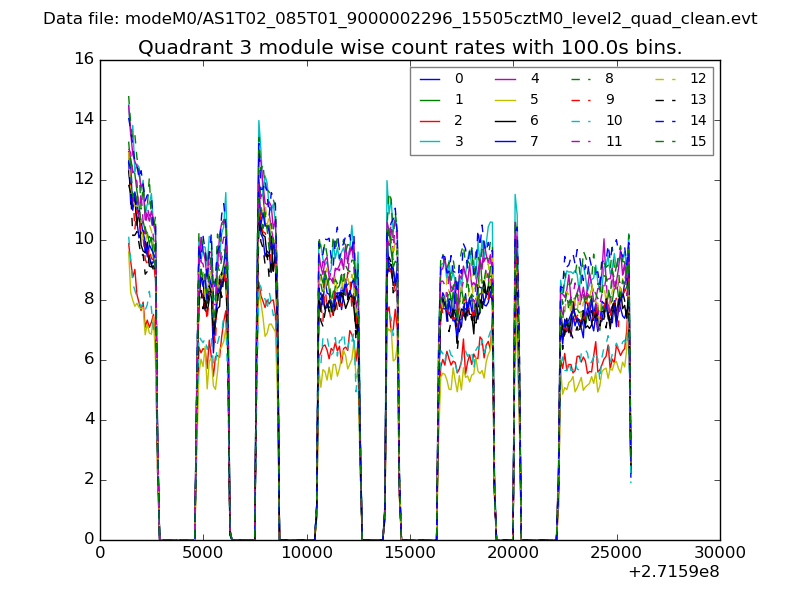
| Module-wise count rates for Quadrant C Data is divided into 100 sec bins |
 |
 |
| Module-wise count rates for Quadrant D Data is divided into 100 sec bins |
 |
 |
| Parameter | Plot |
|---|---|
| CZT HV Monitor |  |
| D_VDD | 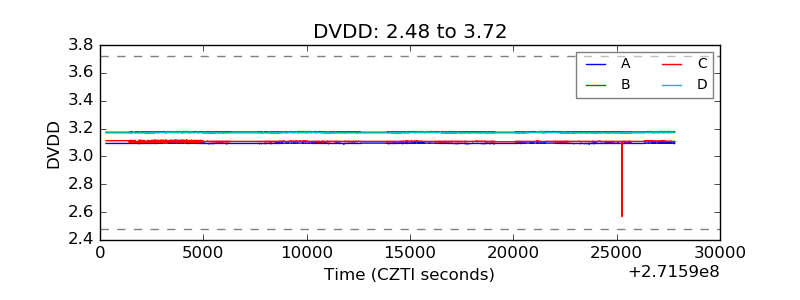 |
| Temperature 1 | 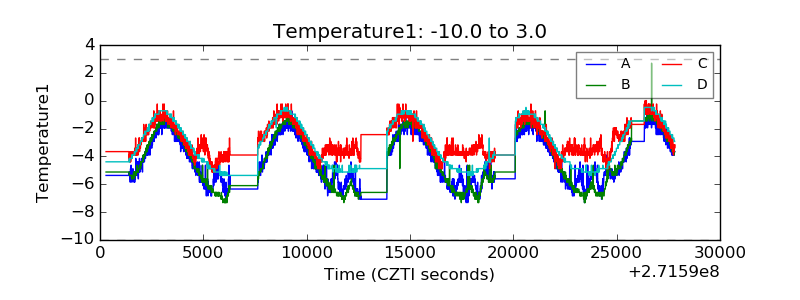 |
| Veto HV Monitor | 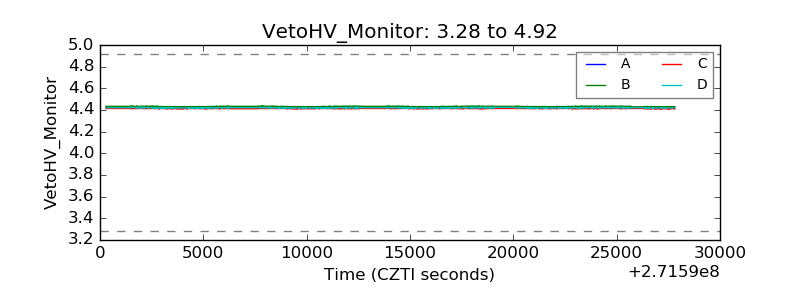 |
| Veto LLD | 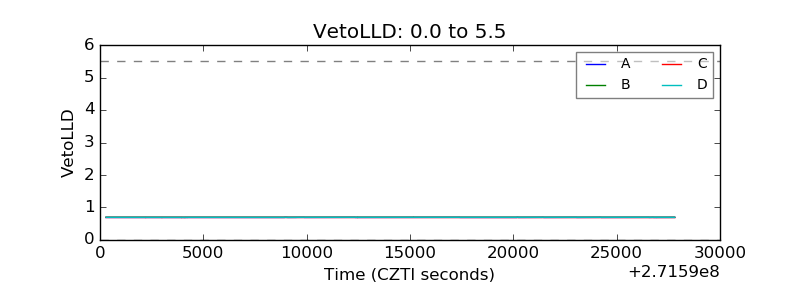 |
| Alpha Counter |  |
| _CPM_Rate | 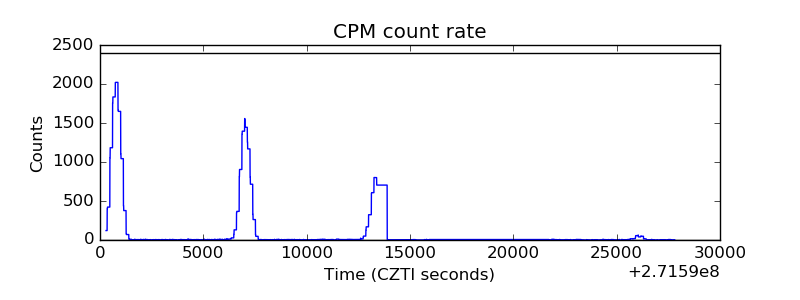 |
| CZT Counter | 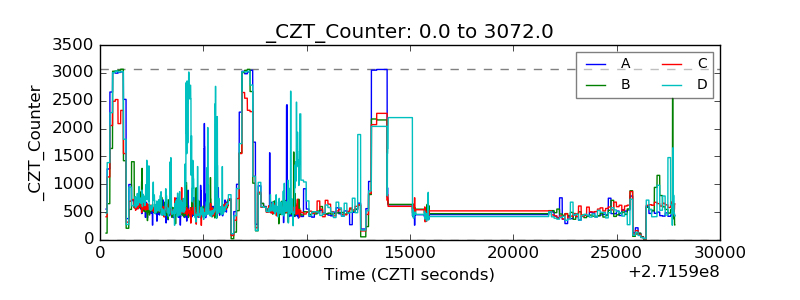 |
| +2.5 Volts monitor |  |
| +5 Volts monitor | 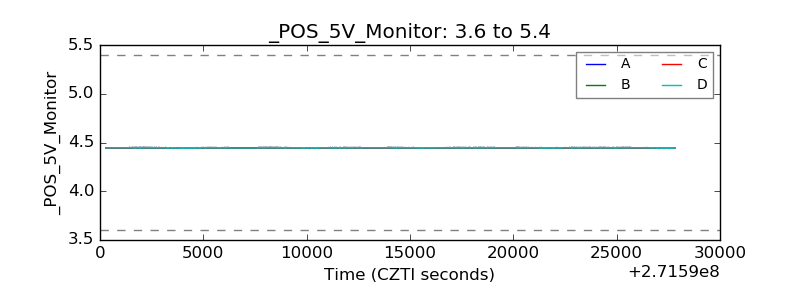 |
| _ROLL_ROT | 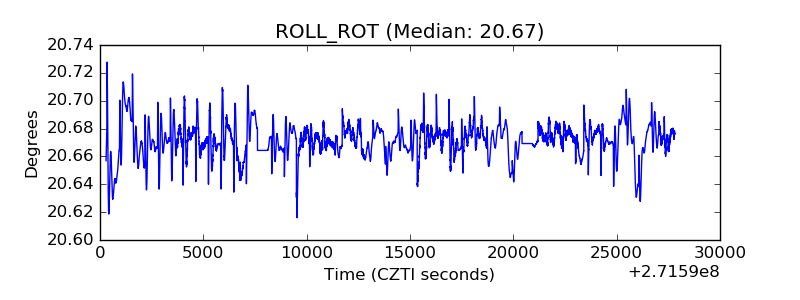 |
| _Roll_DEC | 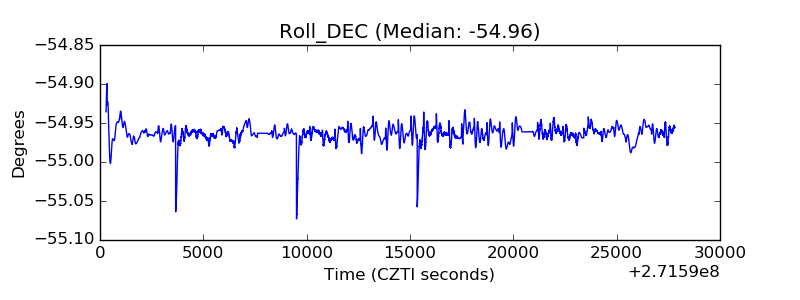 |
| _Roll_RA | 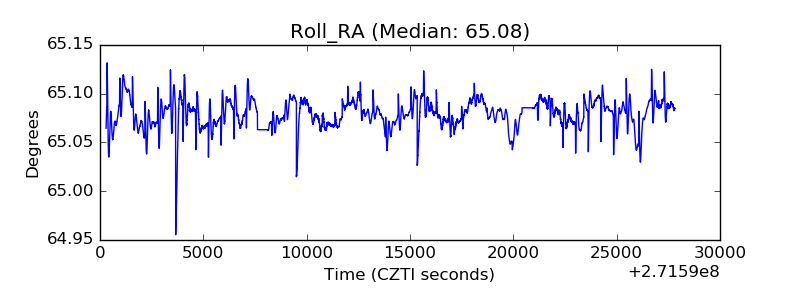 |
| Veto Counter | 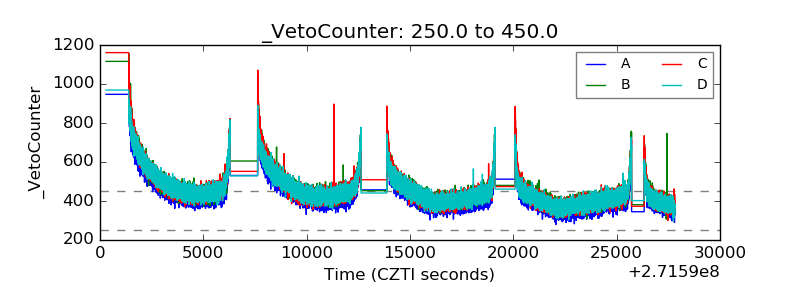 |