| Param | Original file | Final file |
|---|---|---|
| Filename | modeM0/AS1T02_085T01_9000002296_15506cztM0_level2.evt | modeM0/AS1T02_085T01_9000002296_15506cztM0_level2_quad_clean.evt |
| Size (bytes) | 598,351,680 | 82,100,160 |
| Size | 570.6 MB | 78.3 MB |
| Events in quadrant A | 3,793,507 | 499,303 |
| Events in quadrant B | 4,066,805 | 507,107 |
| Events in quadrant C | 4,180,763 | 488,492 |
| Events in quadrant D | 5,576,542 | 473,932 |
| Mode SS | |||
|---|---|---|---|
| Quadrant | BADHDUFLAG | Total packets | Discarded packets |
| A | 0 | 150 | 0 |
| B | 0 | 150 | 0 |
| C | 0 | 150 | 0 |
| D | 0 | 150 | 0 |
| Mode M9 | |||
|---|---|---|---|
| Quadrant | BADHDUFLAG | Total packets | Discarded packets |
| A | 0 | 6 | 0 |
| B | 0 | 6 | 0 |
| C | 0 | 6 | 0 |
| D | 0 | 7 | 0 |
| Mode M0 | |||
|---|---|---|---|
| Quadrant | BADHDUFLAG | Total packets | Discarded packets |
| A | 0 | 16106 | 3 |
| B | 0 | 16846 | 2 |
| C | 0 | 17016 | 2 |
| D | 0 | 21564 | 2 |
| Quadrant | Total seconds | Saturated seconds | Saturation percentage |
|---|---|---|---|
| A | 7434 | 109 | 1.466236% |
| B | 7434 | 168 | 2.259887% |
| C | 7434 | 124 | 1.668012% |
| D | 7434 | 339 | 4.560129% |
Noise dominated data is calculated using 1-second bins in cleaned event files. If a bin has >2000 counts, and if more than 50% of those come from <1% of pixels, then it is considered to be noise-dominated and hence unusable.
| Quadrant | # 1 sec bins | Bins with >0 counts | Bins with >2000 counts | High rate bins dominated by noise | Noise dominated (total time) | Noise dominated (detector-on time) | Marked lightcurve |
|---|---|---|---|---|---|---|---|
| A | 7700 | 7437 | 15 | 15 | 0.19% | 0.20% | 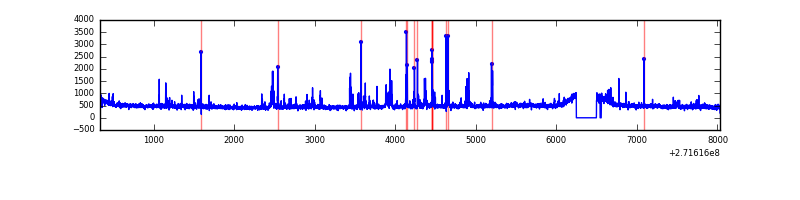 |
| B | 7700 | 7437 | 26 | 26 | 0.34% | 0.35% | 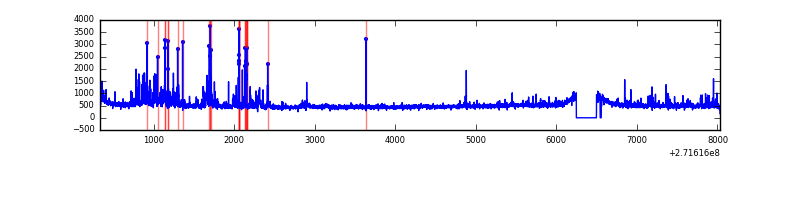 |
| C | 7700 | 7437 | 1 | 1 | 0.01% | 0.01% | 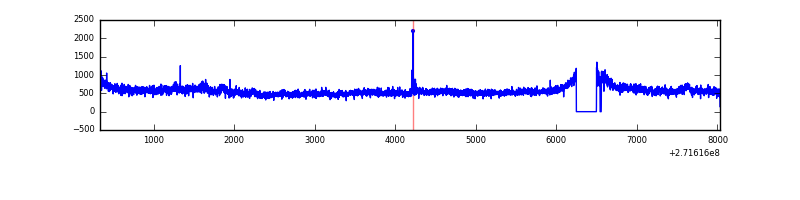 |
| D | 7700 | 7437 | 216 | 216 | 2.81% | 2.90% | 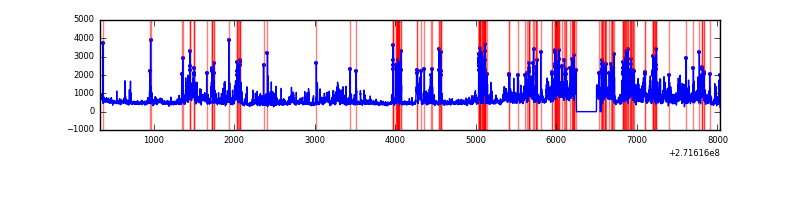 |
Top three noisy pixels from each quadrant. If the there are fewer than three noisy pixels in the level2.evt file, extra rows are filled as -1
| Pixel properties | Quadrant properties | ||||||
|---|---|---|---|---|---|---|---|
| Quadrant | DetID | PixID | Counts | Sigma | Mean | Median | Sigma |
| A | 14 | 238 | 217664 | 1183.67 | 900 | 879 | 183.1 |
| A | 14 | 237 | 29076 | 153.96 | 900 | 879 | 183.1 |
| A | 9 | 143 | 22306 | 116.99 | 900 | 879 | 183.1 |
| B | 4 | 142 | 301969 | 1768.34 | 895 | 870 | 170.3 |
| B | 4 | 190 | 79426 | 461.36 | 895 | 870 | 170.3 |
| B | 0 | 189 | 43983 | 253.2 | 895 | 870 | 170.3 |
| C | 3 | 233 | 682256 | 3423.72 | 856 | 859 | 199.0 |
| C | 14 | 238 | 131361 | 655.71 | 856 | 859 | 199.0 |
| C | 10 | 187 | 12394 | 57.96 | 856 | 859 | 199.0 |
| D | 1 | 52 | 1904814 | 8961.01 | 864 | 836 | 212.5 |
| D | 10 | 70 | 222872 | 1045.0 | 864 | 836 | 212.5 |
| D | 2 | 16 | 75529 | 351.54 | 864 | 836 | 212.5 |
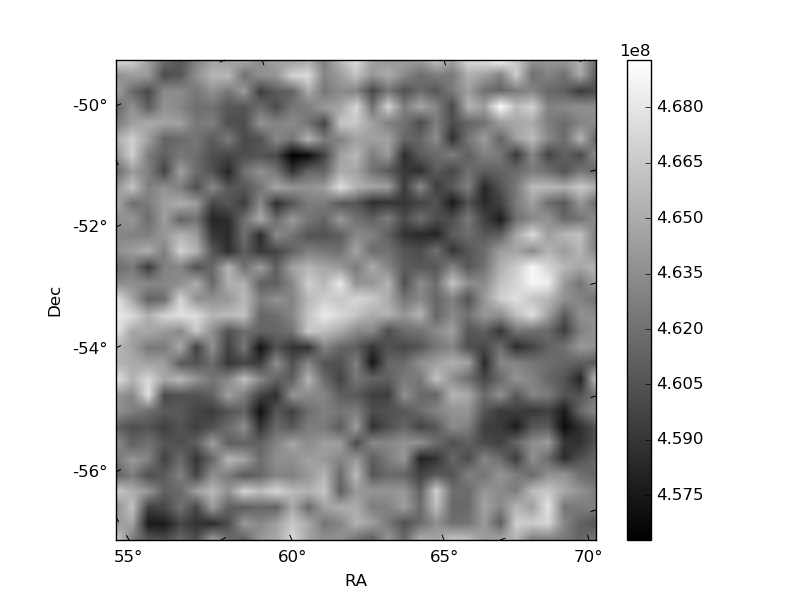
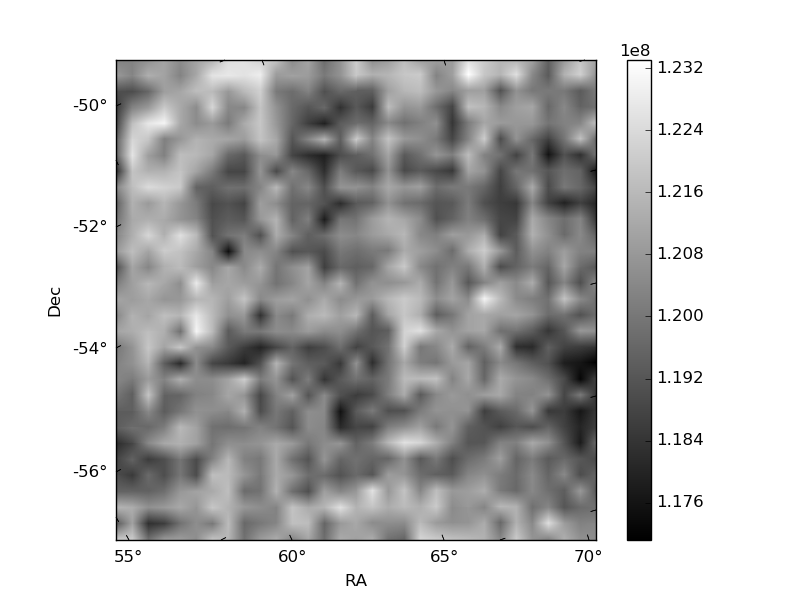
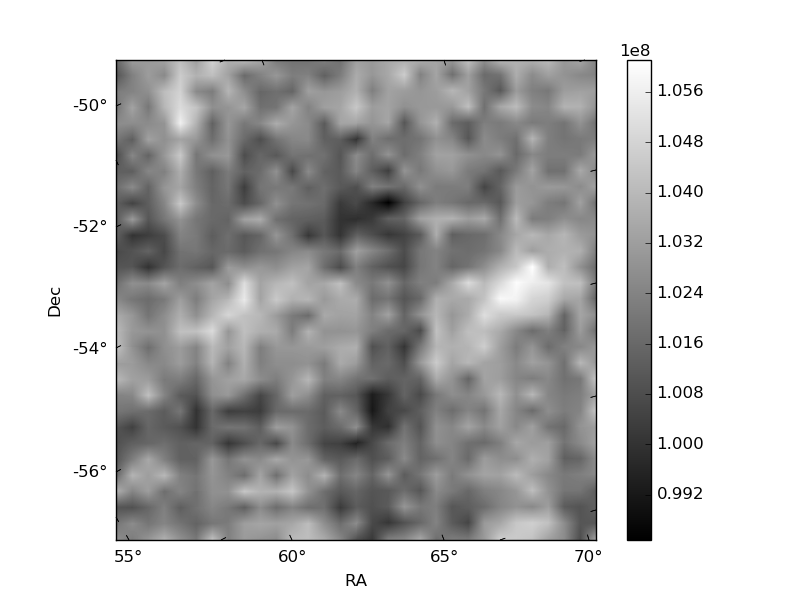
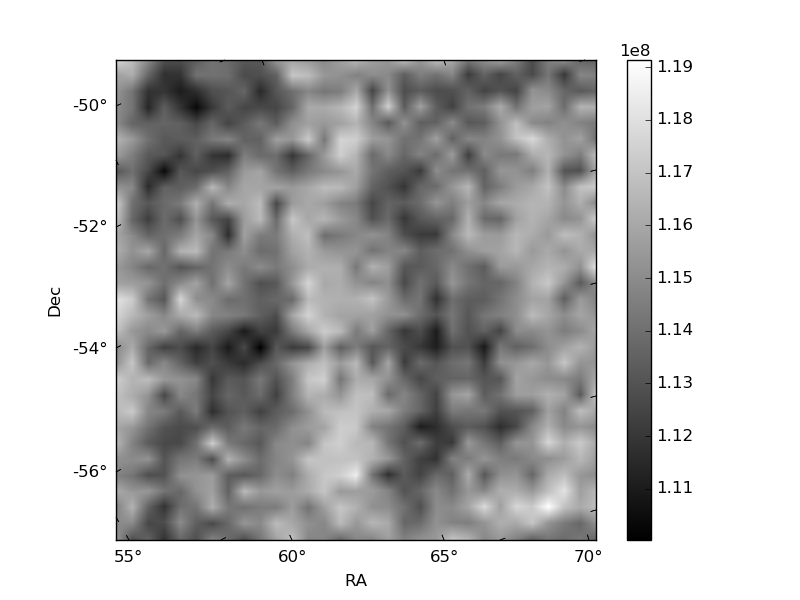
Histogram calculated using DETX and DETY for each event in the final _common_clean file
| Quadrant A | 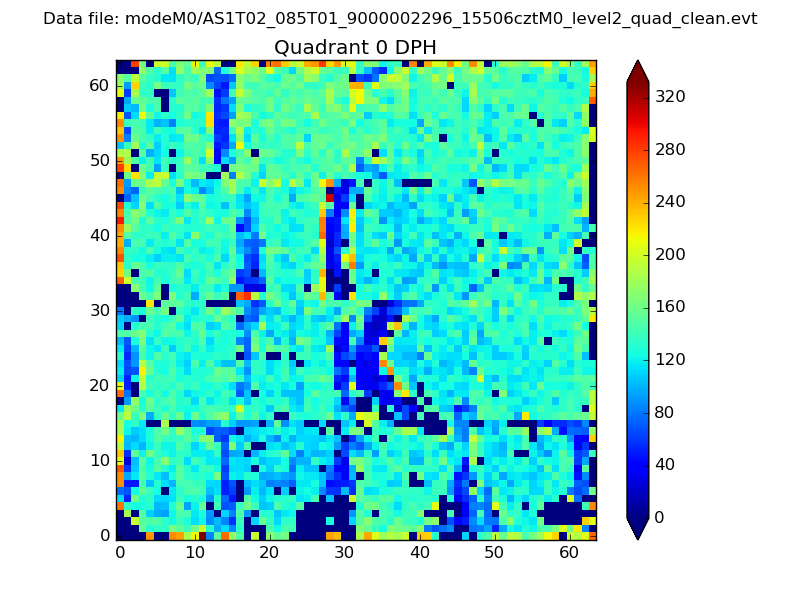 |
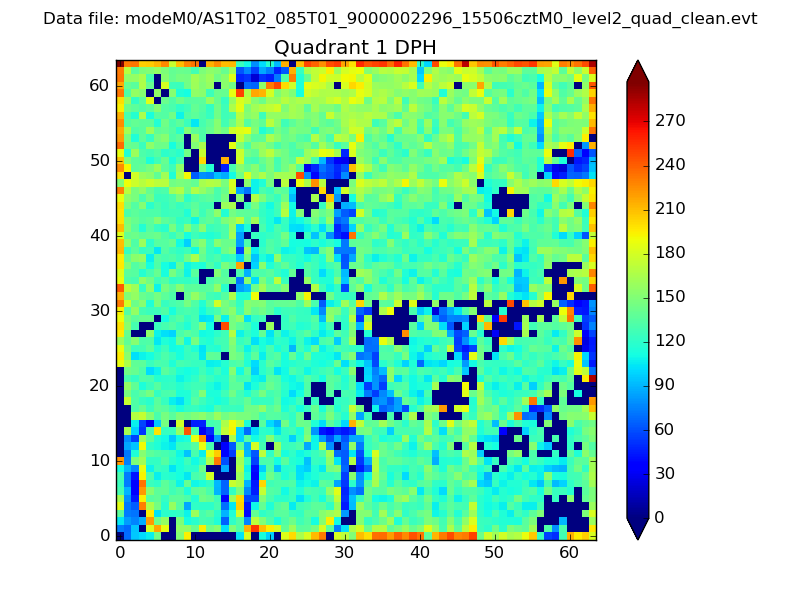 |
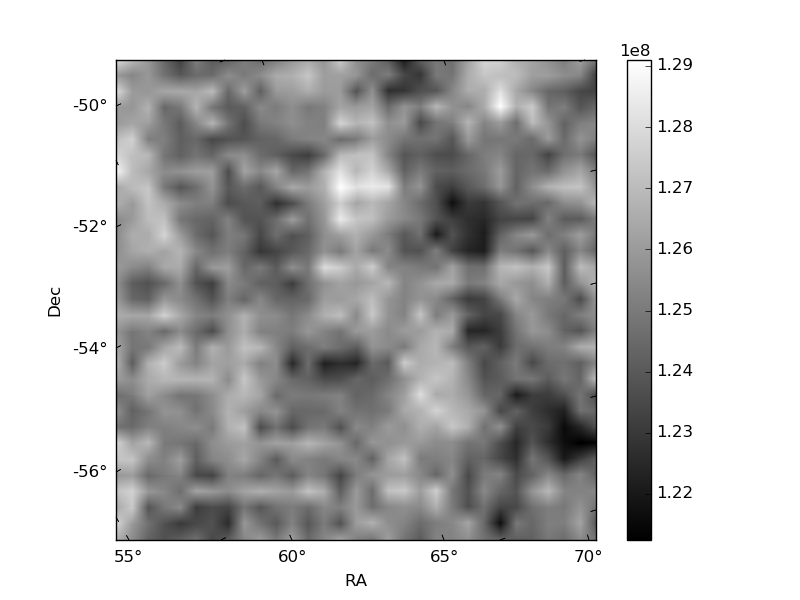
Quadrant B |
|---|---|---|---|
| Quadrant D | 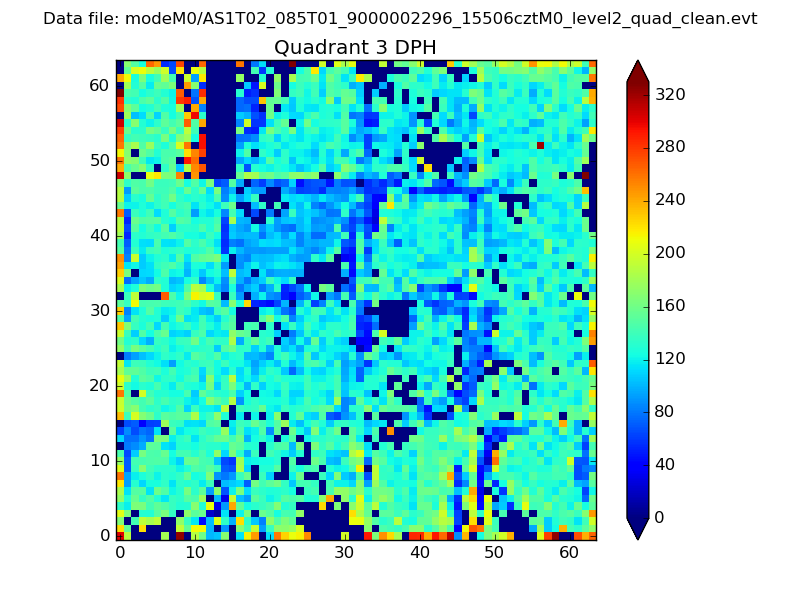 |
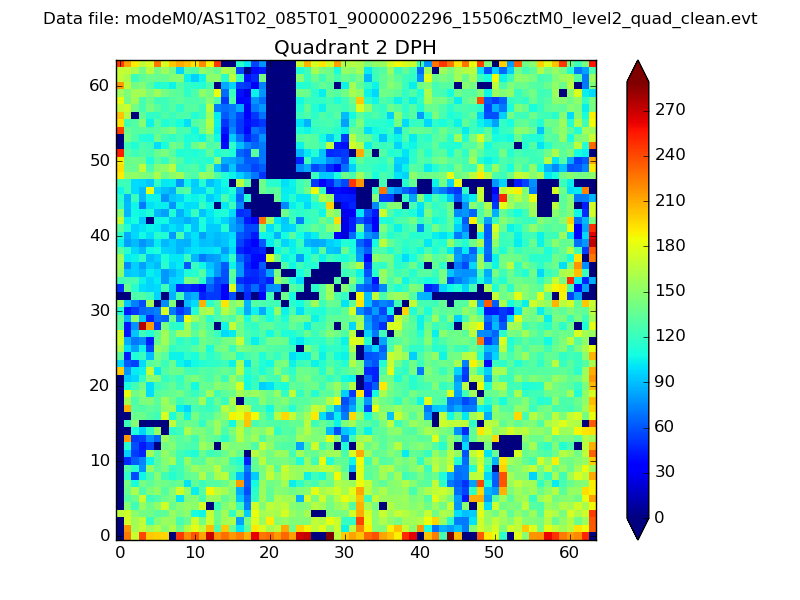 |
Quadrant C |
| Plot type | Count rate plots | Images |
|---|---|---|
| Comparison with Poisson distribution Blue bars denote a histogram of data divided into 1 sec bins. Red curve is a Poisson curve with rate = median count rate of data. |
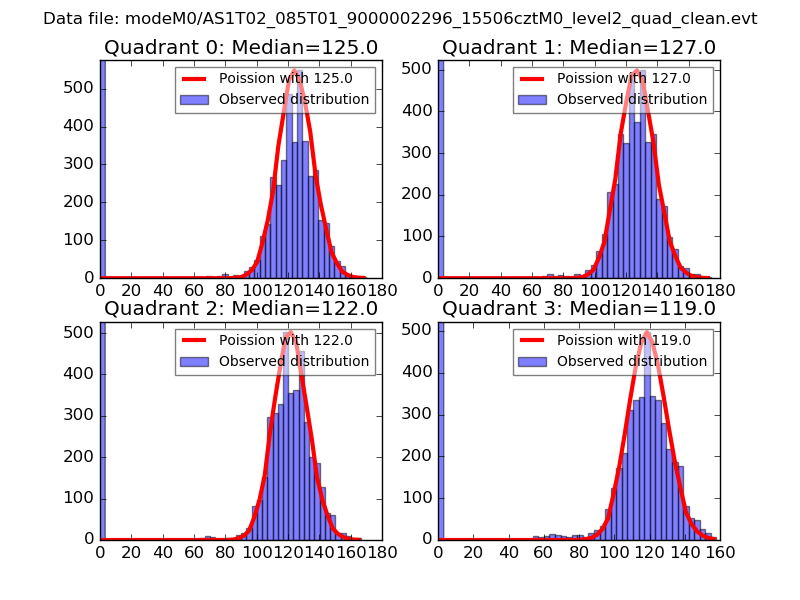 |
 |
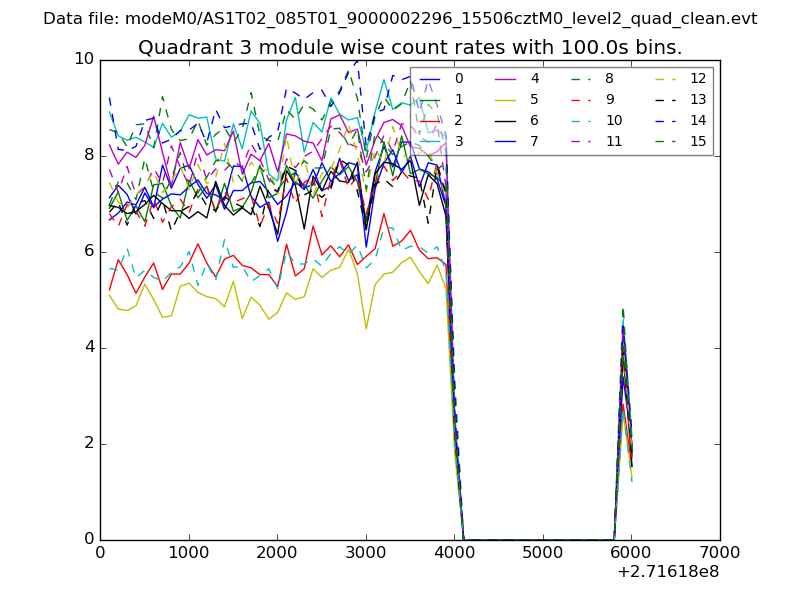
| Quadrant-wise count rates Data is divided into 100 sec bins |
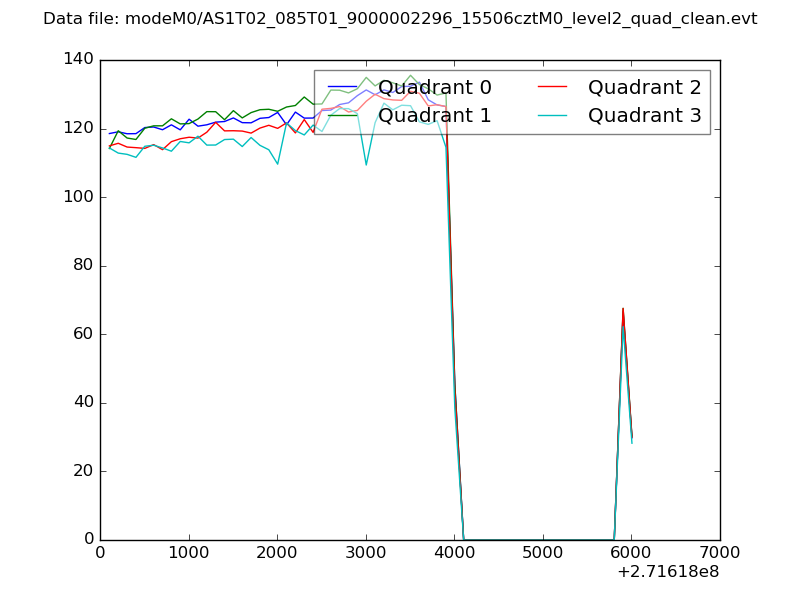 |
|
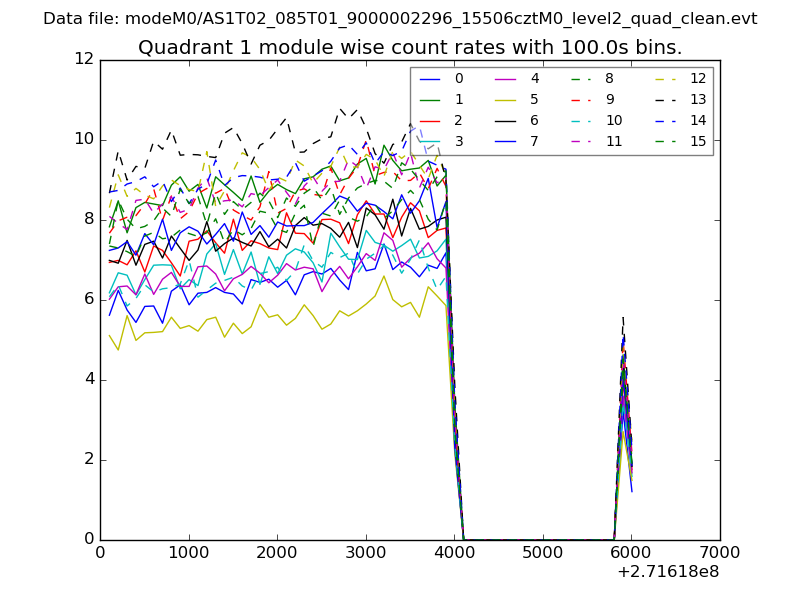
| Module-wise count rates for Quadrant A Data is divided into 100 sec bins |
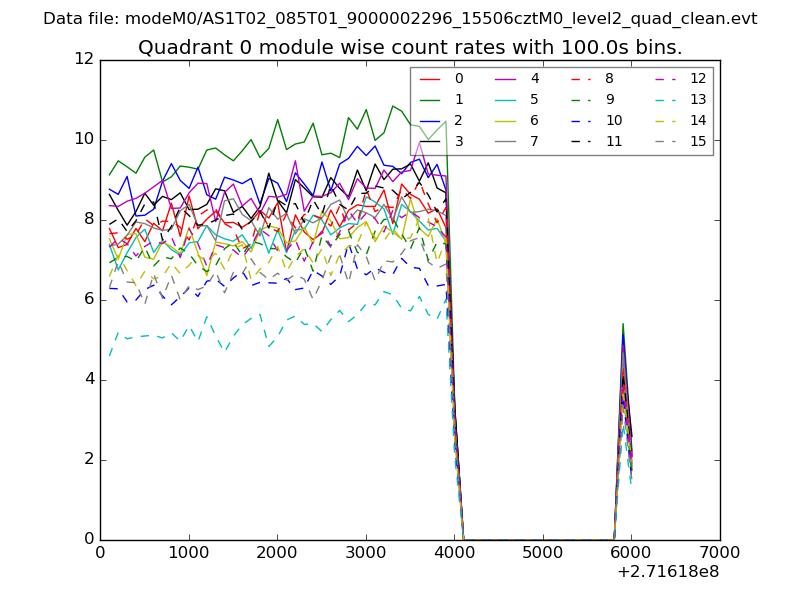 |
 |
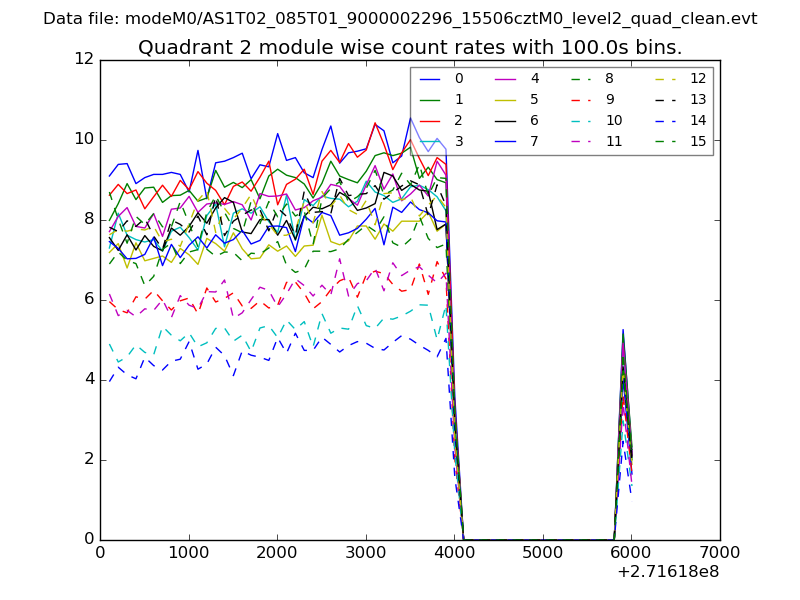
| Module-wise count rates for Quadrant B Data is divided into 100 sec bins |
 |
 |
| Module-wise count rates for Quadrant C Data is divided into 100 sec bins |
 |
 |
| Module-wise count rates for Quadrant D Data is divided into 100 sec bins |
 |
 |
| Parameter | Plot |
|---|---|
| CZT HV Monitor | 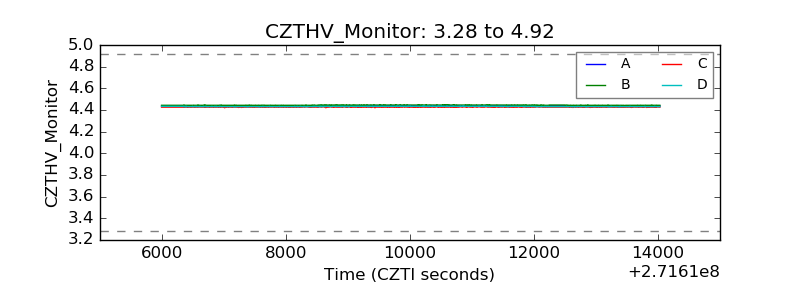 |
| D_VDD | 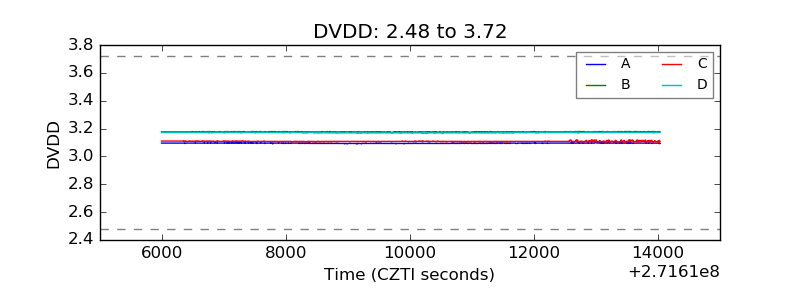 |
| Temperature 1 | 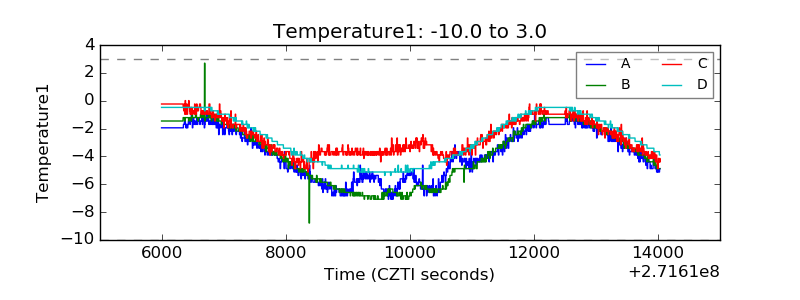 |
| Veto HV Monitor | 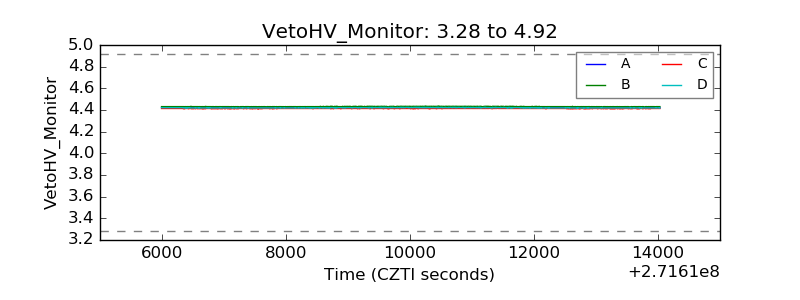 |
| Veto LLD | 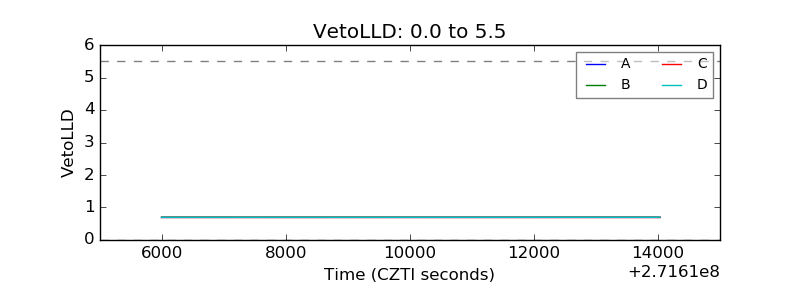 |
| Alpha Counter | 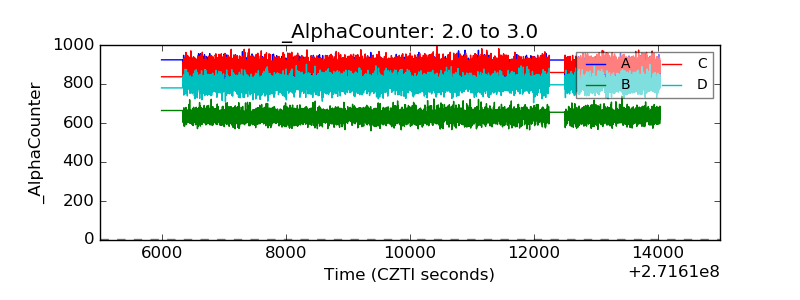 |
| _CPM_Rate | 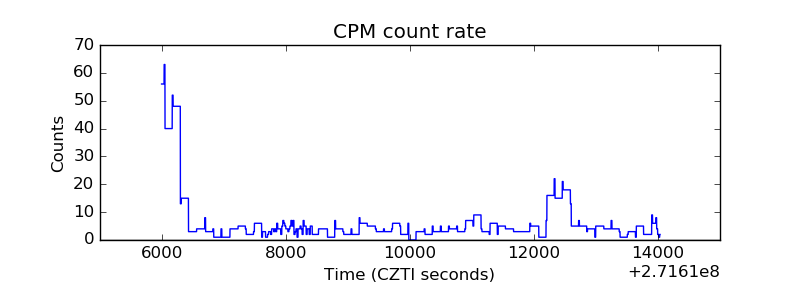 |
| CZT Counter | 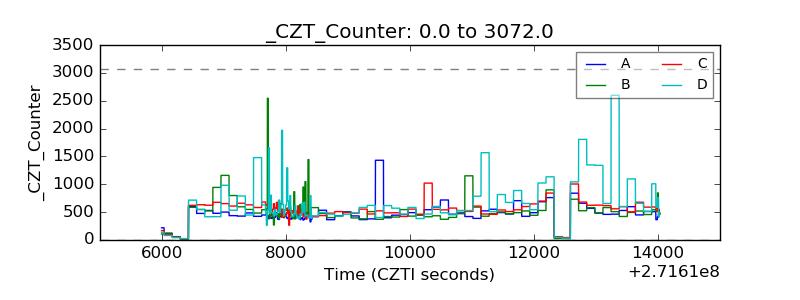 |
| +2.5 Volts monitor |  |
| +5 Volts monitor |  |
| _ROLL_ROT | 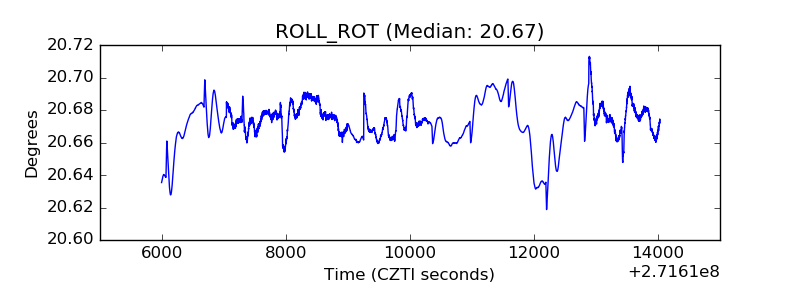 |
| _Roll_DEC | 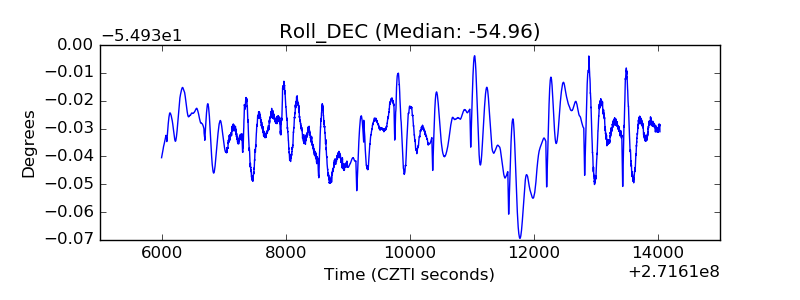 |
| _Roll_RA | 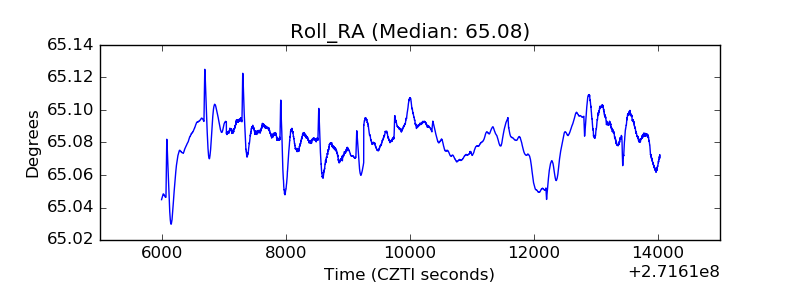 |
| Veto Counter | 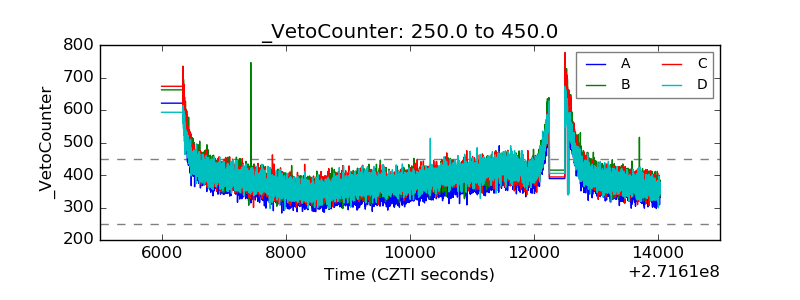 |