| Param | Original file | Final file |
|---|---|---|
| Filename | modeM0/AS1T02_085T01_9000002296_15510cztM0_level2.evt | modeM0/AS1T02_085T01_9000002296_15510cztM0_level2_quad_clean.evt |
| Size (bytes) | 905,253,120 | 147,798,720 |
| Size | 863.3 MB | 141.0 MB |
| Events in quadrant A | 6,330,741 | 937,356 |
| Events in quadrant B | 5,390,118 | 953,747 |
| Events in quadrant C | 5,427,232 | 924,524 |
| Events in quadrant D | 9,522,315 | 897,354 |
| Mode SS | |||
|---|---|---|---|
| Quadrant | BADHDUFLAG | Total packets | Discarded packets |
| A | 0 | 222 | 0 |
| B | 0 | 222 | 0 |
| C | 0 | 222 | 0 |
| D | 0 | 222 | 0 |
| Mode M9 | |||
|---|---|---|---|
| Quadrant | BADHDUFLAG | Total packets | Discarded packets |
| A | 0 | 5 | 0 |
| B | 0 | 5 | 0 |
| C | 0 | 5 | 0 |
| D | 0 | 5 | 0 |
| Mode M0 | |||
|---|---|---|---|
| Quadrant | BADHDUFLAG | Total packets | Discarded packets |
| A | 0 | 26377 | 2 |
| B | 0 | 23318 | 1 |
| C | 0 | 22949 | 1 |
| D | 0 | 35913 | 1 |
| Quadrant | Total seconds | Saturated seconds | Saturation percentage |
|---|---|---|---|
| A | 11030 | 383 | 3.472348% |
| B | 11030 | 55 | 0.498640% |
| C | 11030 | 72 | 0.652765% |
| D | 11030 | 837 | 7.588395% |
Noise dominated data is calculated using 1-second bins in cleaned event files. If a bin has >2000 counts, and if more than 50% of those come from <1% of pixels, then it is considered to be noise-dominated and hence unusable.
| Quadrant | # 1 sec bins | Bins with >0 counts | Bins with >2000 counts | High rate bins dominated by noise | Noise dominated (total time) | Noise dominated (detector-on time) | Marked lightcurve |
|---|---|---|---|---|---|---|---|
| A | 11496 | 11032 | 188 | 188 | 1.64% | 1.70% | 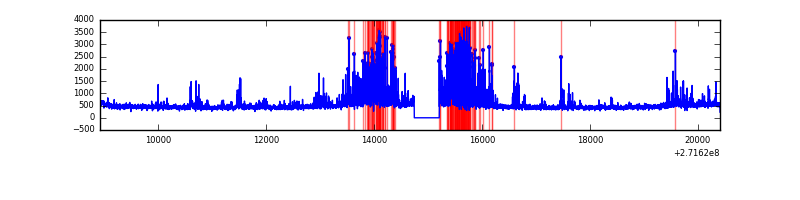 |
| B | 11496 | 11032 | 9 | 9 | 0.08% | 0.08% | 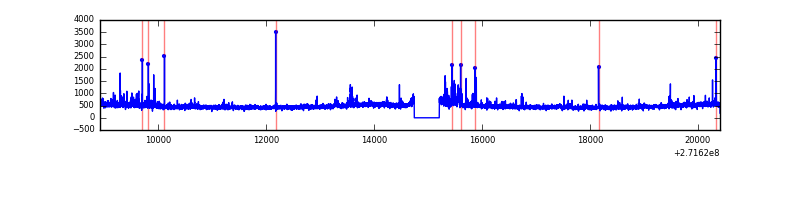 |
| C | 11496 | 11032 | 1 | 1 | 0.01% | 0.01% | 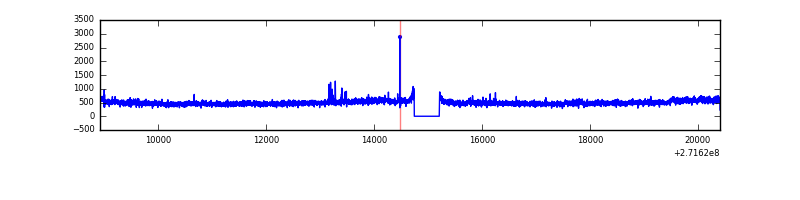 |
| D | 11496 | 11032 | 709 | 709 | 6.17% | 6.43% | 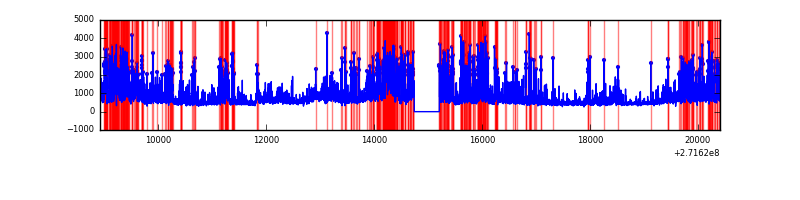 |
Top three noisy pixels from each quadrant. If the there are fewer than three noisy pixels in the level2.evt file, extra rows are filled as -1
| Pixel properties | Quadrant properties | ||||||
|---|---|---|---|---|---|---|---|
| Quadrant | DetID | PixID | Counts | Sigma | Mean | Median | Sigma |
| A | 14 | 238 | 900241 | 3502.39 | 1270 | 1239 | 256.7 |
| A | 14 | 237 | 489163 | 1900.88 | 1270 | 1239 | 256.7 |
| A | 0 | 253 | 32964 | 123.6 | 1270 | 1239 | 256.7 |
| B | 0 | 189 | 71490 | 289.95 | 1281 | 1247 | 242.3 |
| B | 4 | 142 | 67333 | 272.79 | 1281 | 1247 | 242.3 |
| B | 0 | 230 | 48305 | 194.25 | 1281 | 1247 | 242.3 |
| C | 3 | 233 | 338041 | 1169.02 | 1236 | 1242 | 288.1 |
| C | 14 | 238 | 189802 | 654.49 | 1236 | 1242 | 288.1 |
| C | 7 | 247 | 52547 | 178.08 | 1236 | 1242 | 288.1 |
| D | 1 | 52 | 4120149 | 13908.07 | 1223 | 1183 | 296.2 |
| D | 5 | 222 | 556185 | 1874.01 | 1223 | 1183 | 296.2 |
| D | 5 | 51 | 80975 | 269.42 | 1223 | 1183 | 296.2 |
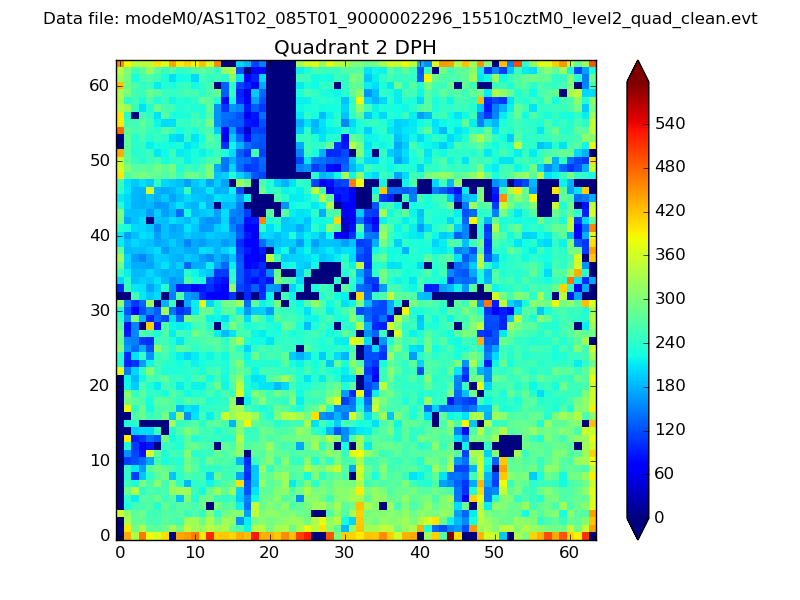
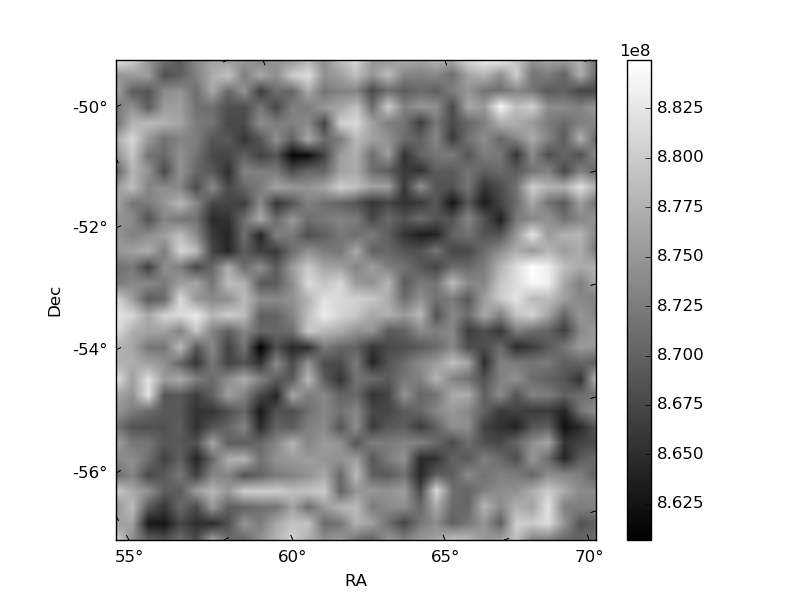
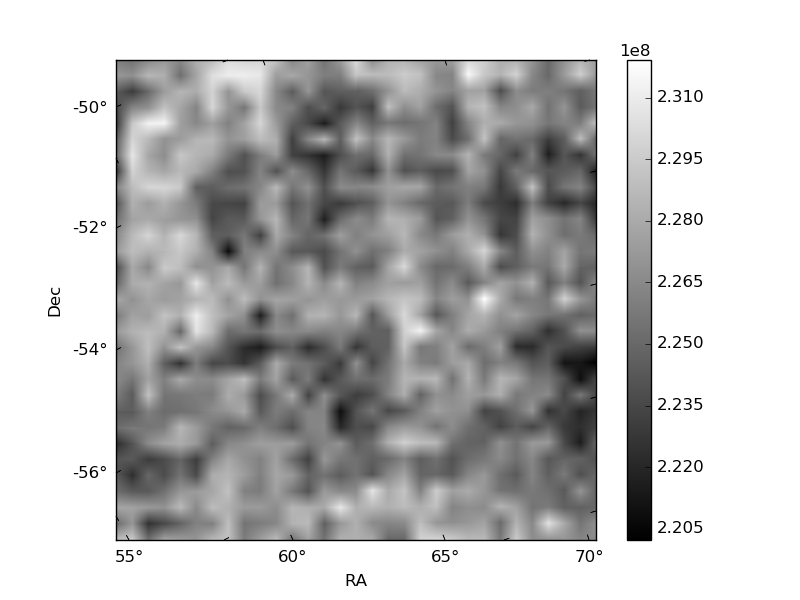
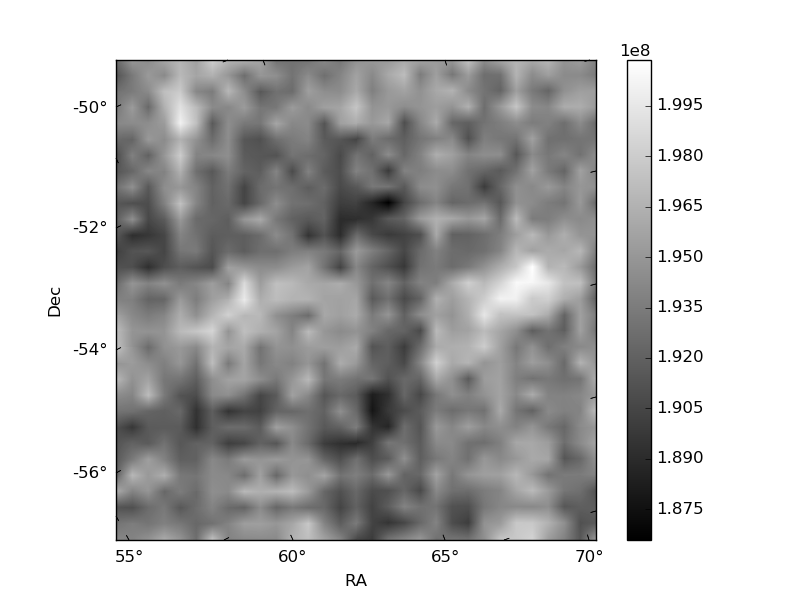
Histogram calculated using DETX and DETY for each event in the final _common_clean file
| Quadrant A | 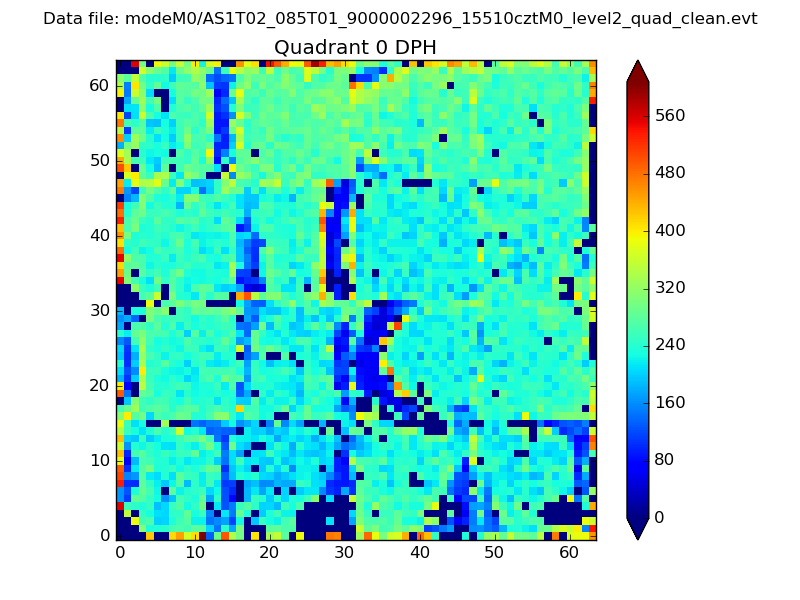 |
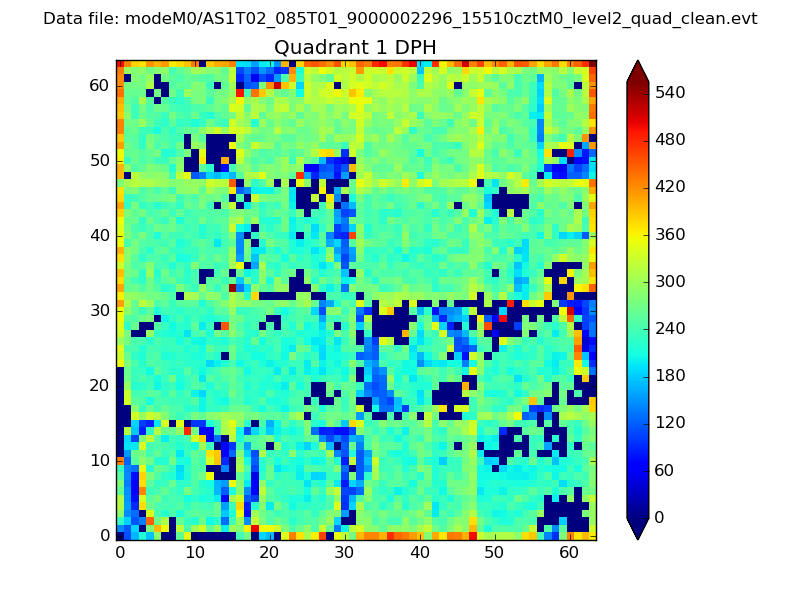 |
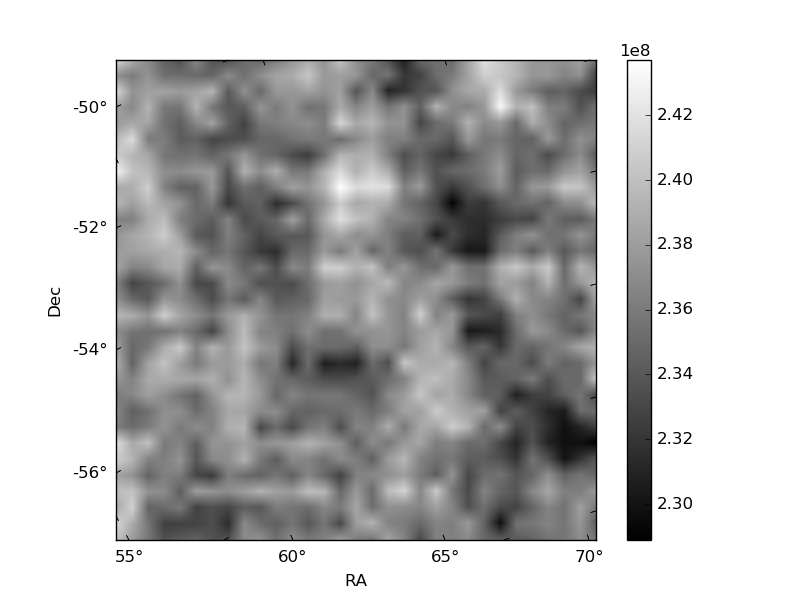
Quadrant B |
|---|---|---|---|
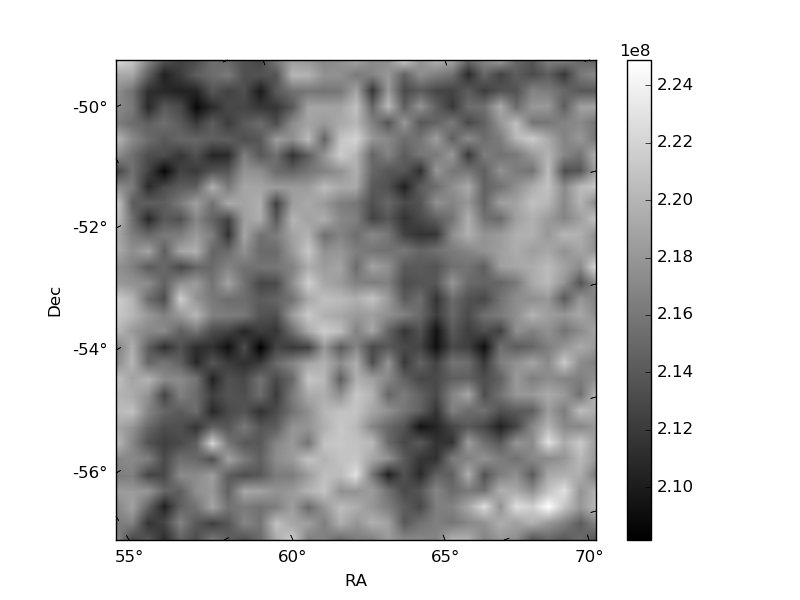
| Quadrant D | 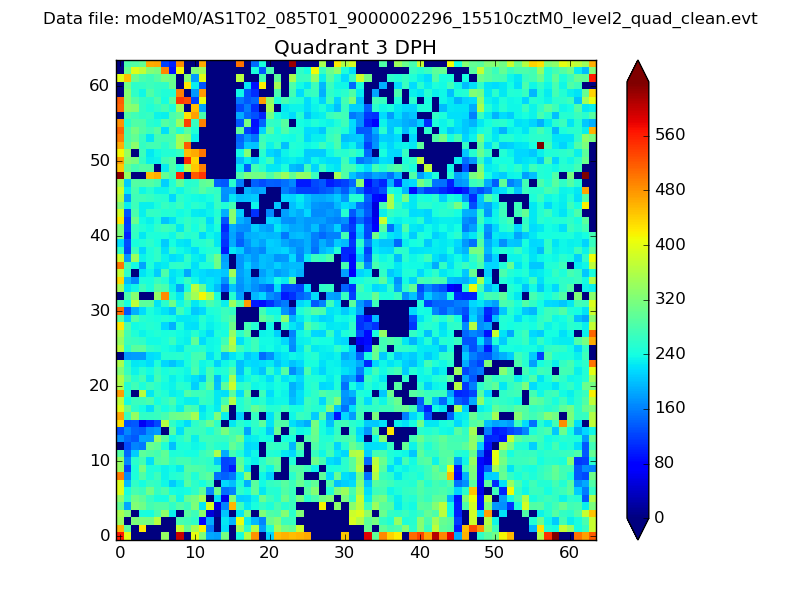 |
 |
Quadrant C |
| Plot type | Count rate plots | Images |
|---|---|---|
| Comparison with Poisson distribution Blue bars denote a histogram of data divided into 1 sec bins. Red curve is a Poisson curve with rate = median count rate of data. |
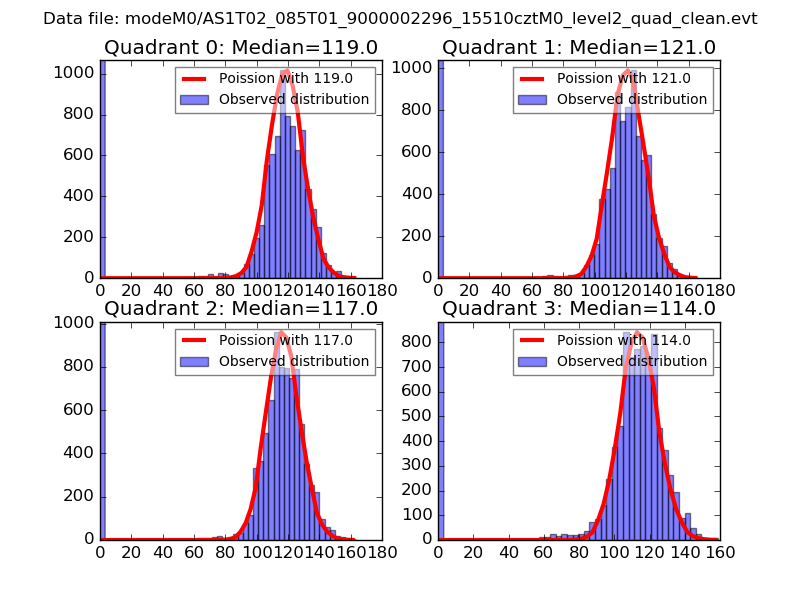 |
 |
| Quadrant-wise count rates Data is divided into 100 sec bins |
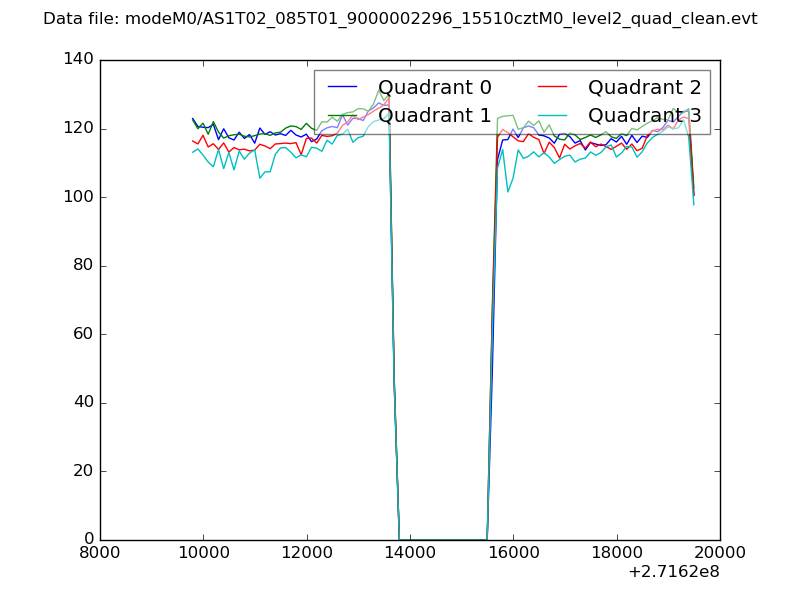 |
|
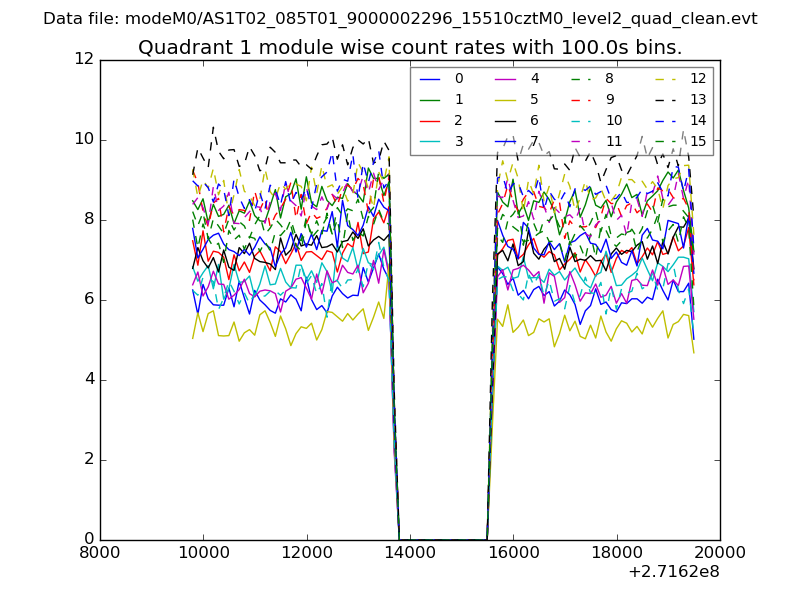
| Module-wise count rates for Quadrant A Data is divided into 100 sec bins |
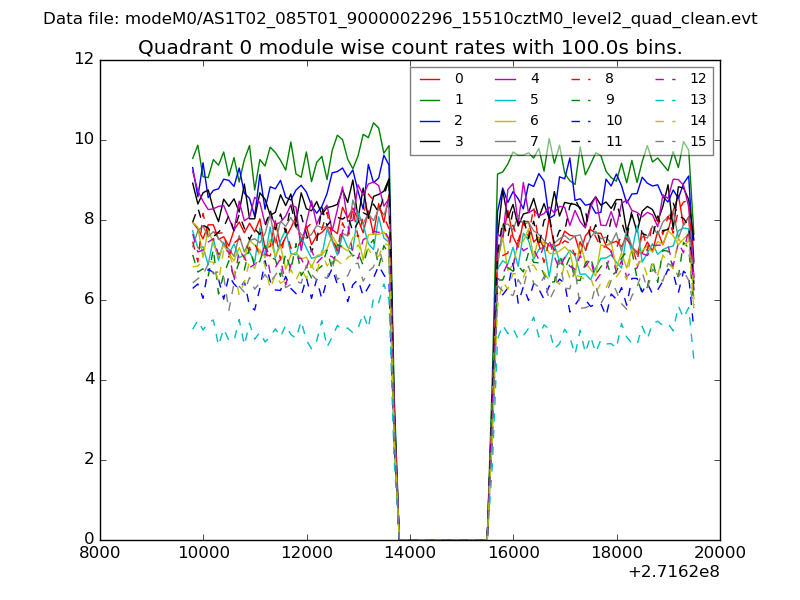 |
 |
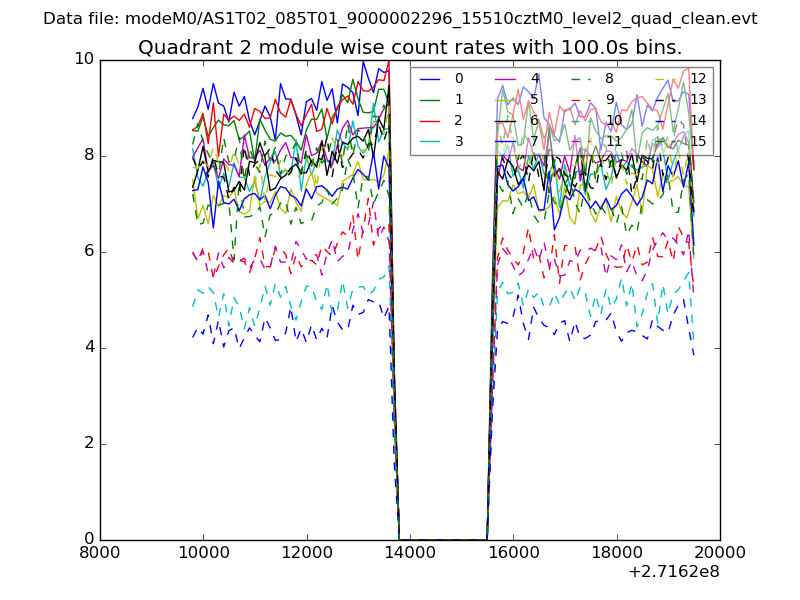
| Module-wise count rates for Quadrant B Data is divided into 100 sec bins |
 |
 |
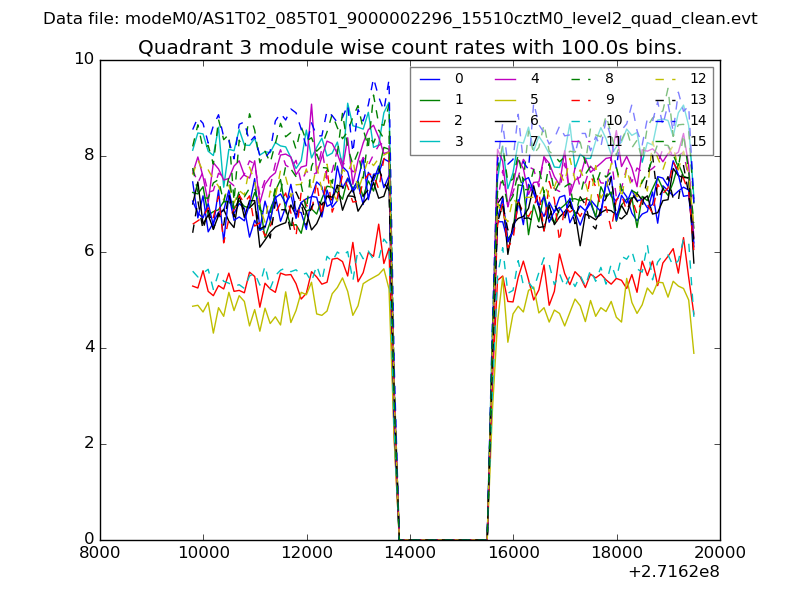
| Module-wise count rates for Quadrant C Data is divided into 100 sec bins |
 |
 |
| Module-wise count rates for Quadrant D Data is divided into 100 sec bins |
 |
 |
| Parameter | Plot |
|---|---|
| CZT HV Monitor | 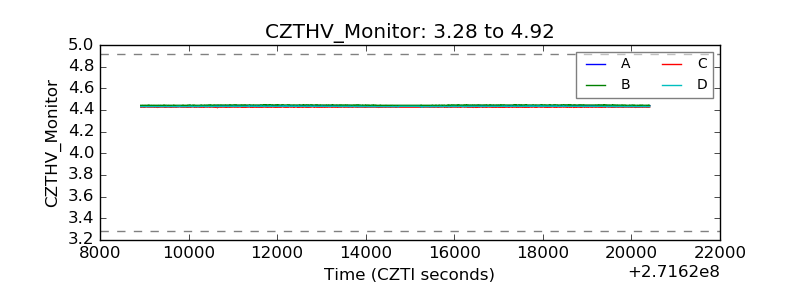 |
| D_VDD | 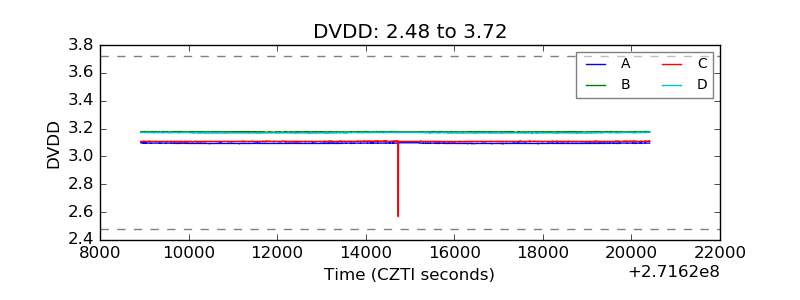 |
| Temperature 1 | 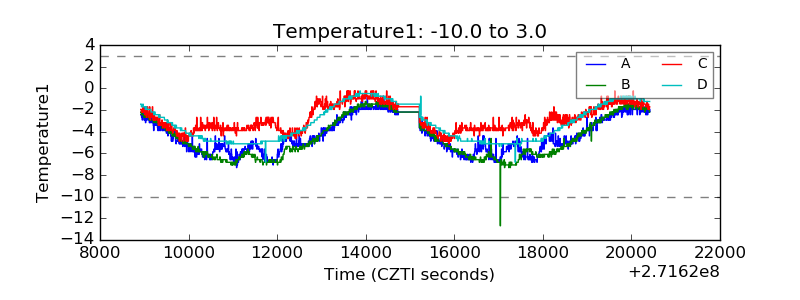 |
| Veto HV Monitor | 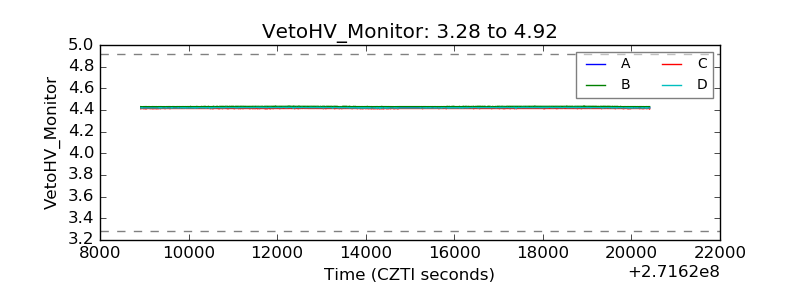 |
| Veto LLD | 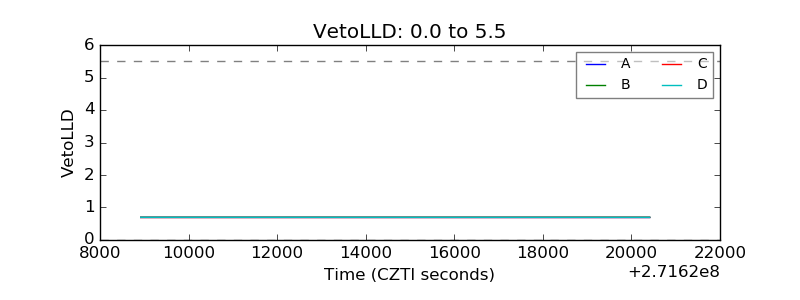 |
| Alpha Counter | 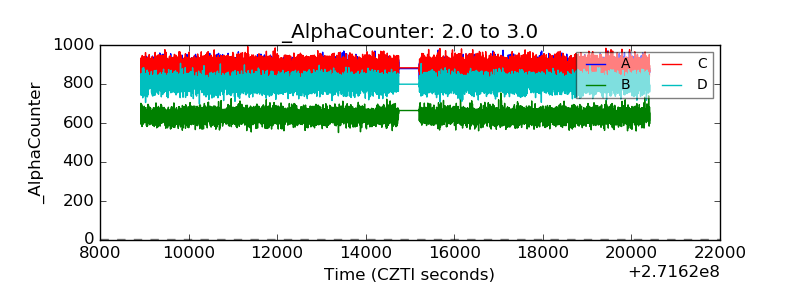 |
| _CPM_Rate | 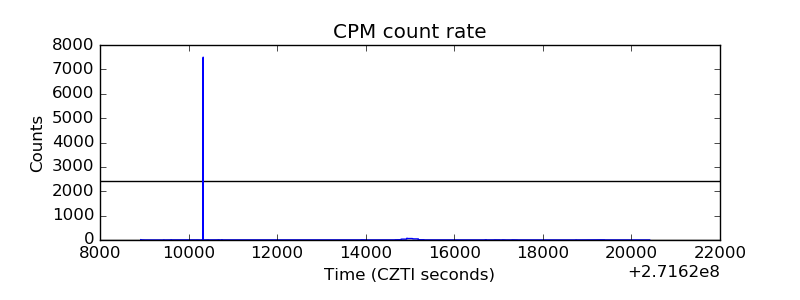 |
| CZT Counter | 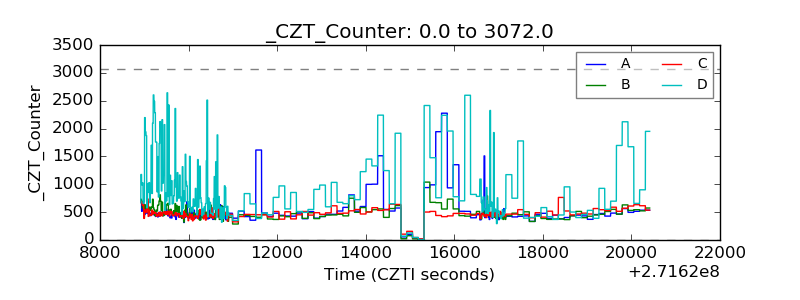 |
| +2.5 Volts monitor | 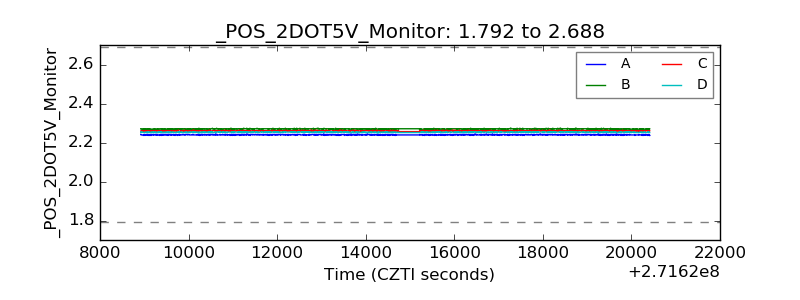 |
| +5 Volts monitor | 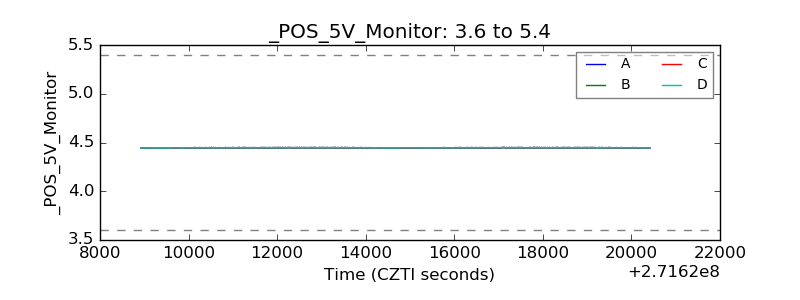 |
| _ROLL_ROT | 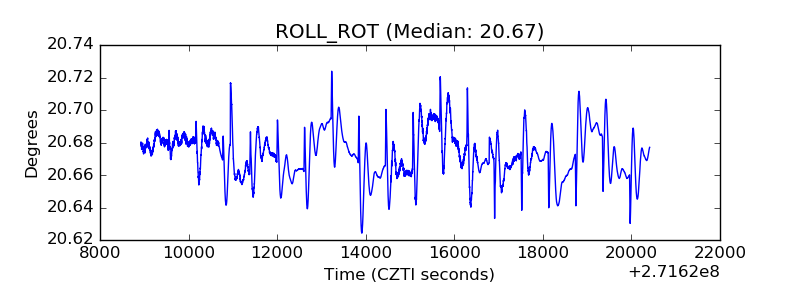 |
| _Roll_DEC | 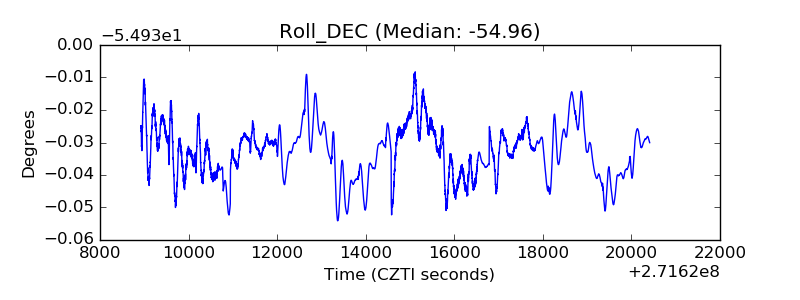 |
| _Roll_RA | 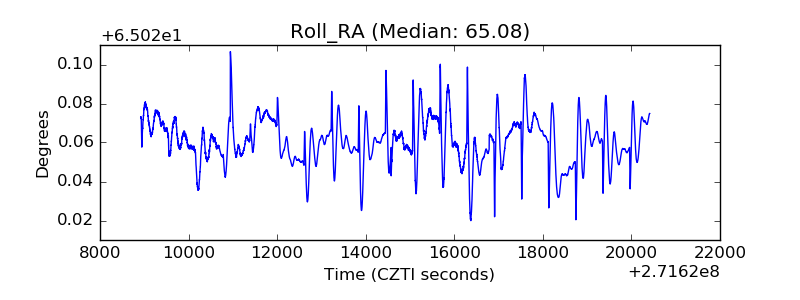 |
| Veto Counter | 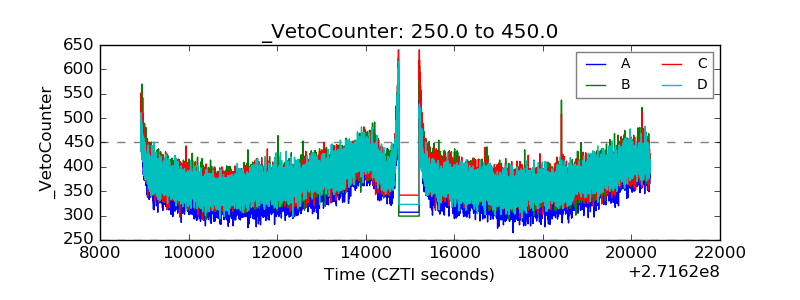 |