| Param | Original file | Final file |
|---|---|---|
| Filename | modeM0/AS1T02_085T01_9000002296_15511cztM0_level2.evt | modeM0/AS1T02_085T01_9000002296_15511cztM0_level2_quad_clean.evt |
| Size (bytes) | 1,104,393,600 | 171,167,040 |
| Size | 1.0 GB | 163.2 MB |
| Events in quadrant A | 8,189,821 | 1,052,976 |
| Events in quadrant B | 6,732,015 | 1,097,828 |
| Events in quadrant C | 7,327,153 | 1,065,638 |
| Events in quadrant D | 10,280,822 | 1,029,464 |
| Mode SS | |||
|---|---|---|---|
| Quadrant | BADHDUFLAG | Total packets | Discarded packets |
| A | 0 | 276 | 0 |
| B | 0 | 276 | 0 |
| C | 0 | 276 | 0 |
| D | 0 | 276 | 0 |
| Mode M9 | |||
|---|---|---|---|
| Quadrant | BADHDUFLAG | Total packets | Discarded packets |
| A | 0 | 25 | 0 |
| B | 0 | 25 | 0 |
| C | 0 | 25 | 0 |
| D | 0 | 25 | 0 |
| Mode M0 | |||
|---|---|---|---|
| Quadrant | BADHDUFLAG | Total packets | Discarded packets |
| A | 0 | 33183 | 4 |
| B | 0 | 28657 | 3 |
| C | 0 | 30108 | 3 |
| D | 0 | 39906 | 3 |
| Quadrant | Total seconds | Saturated seconds | Saturation percentage |
|---|---|---|---|
| A | 13585 | 512 | 3.768863% |
| B | 13585 | 94 | 0.691940% |
| C | 13585 | 141 | 1.037909% |
| D | 13585 | 622 | 4.578579% |
Noise dominated data is calculated using 1-second bins in cleaned event files. If a bin has >2000 counts, and if more than 50% of those come from <1% of pixels, then it is considered to be noise-dominated and hence unusable.
| Quadrant | # 1 sec bins | Bins with >0 counts | Bins with >2000 counts | High rate bins dominated by noise | Noise dominated (total time) | Noise dominated (detector-on time) | Marked lightcurve |
|---|---|---|---|---|---|---|---|
| A | 16027 | 13590 | 286 | 286 | 1.78% | 2.10% | 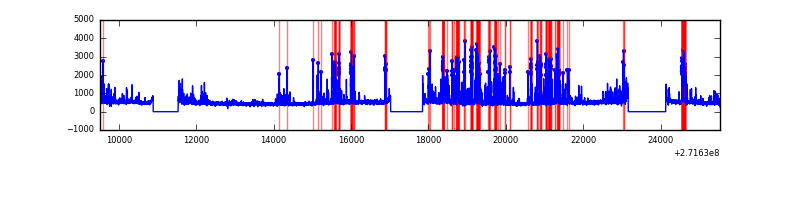 |
| B | 16027 | 13590 | 16 | 16 | 0.10% | 0.12% | 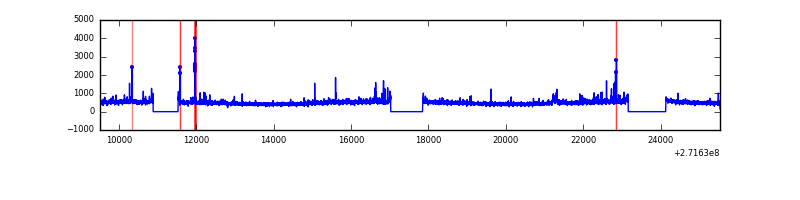 |
| C | 16027 | 13589 | 0 | 0 | 0.00% | 0.00% | 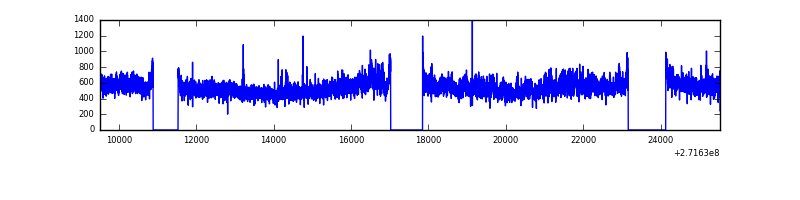 |
| D | 16027 | 13590 | 466 | 466 | 2.91% | 3.43% | 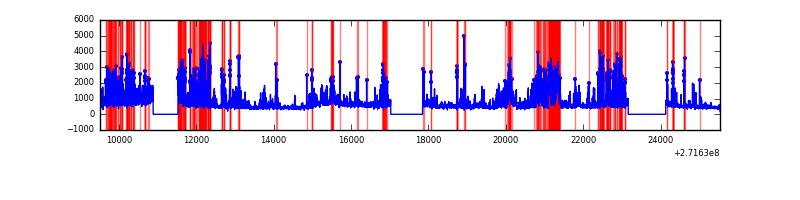 |
Top three noisy pixels from each quadrant. If the there are fewer than three noisy pixels in the level2.evt file, extra rows are filled as -1
| Pixel properties | Quadrant properties | ||||||
|---|---|---|---|---|---|---|---|
| Quadrant | DetID | PixID | Counts | Sigma | Mean | Median | Sigma |
| A | 14 | 238 | 1314991 | 4065.93 | 1605 | 1569 | 323.0 |
| A | 14 | 237 | 630663 | 1947.47 | 1605 | 1569 | 323.0 |
| A | 0 | 253 | 47525 | 142.27 | 1605 | 1569 | 323.0 |
| B | 0 | 189 | 72877 | 230.09 | 1627 | 1583 | 309.9 |
| B | 0 | 230 | 65075 | 204.91 | 1627 | 1583 | 309.9 |
| B | 4 | 190 | 63129 | 198.63 | 1627 | 1583 | 309.9 |
| C | 3 | 233 | 871358 | 2377.72 | 1570 | 1578 | 365.8 |
| C | 14 | 238 | 239751 | 651.1 | 1570 | 1578 | 365.8 |
| C | 7 | 247 | 45398 | 119.79 | 1570 | 1578 | 365.8 |
| D | 1 | 52 | 2508932 | 6538.0 | 1579 | 1534 | 383.5 |
| D | 5 | 222 | 1487920 | 3875.73 | 1579 | 1534 | 383.5 |
| D | 5 | 51 | 95936 | 246.15 | 1579 | 1534 | 383.5 |
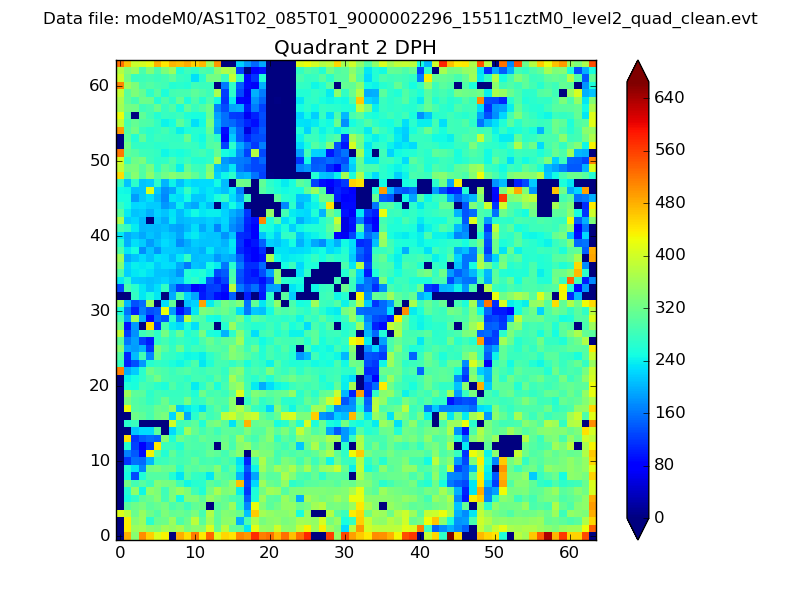
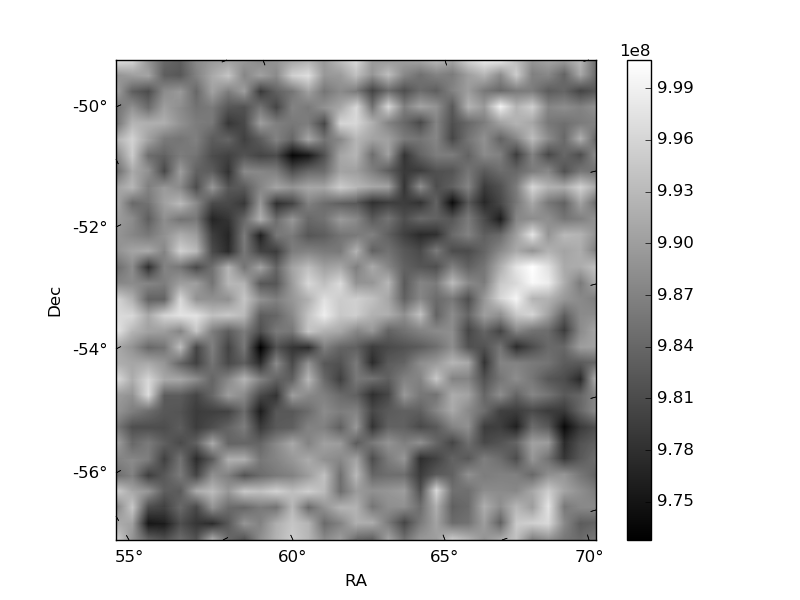
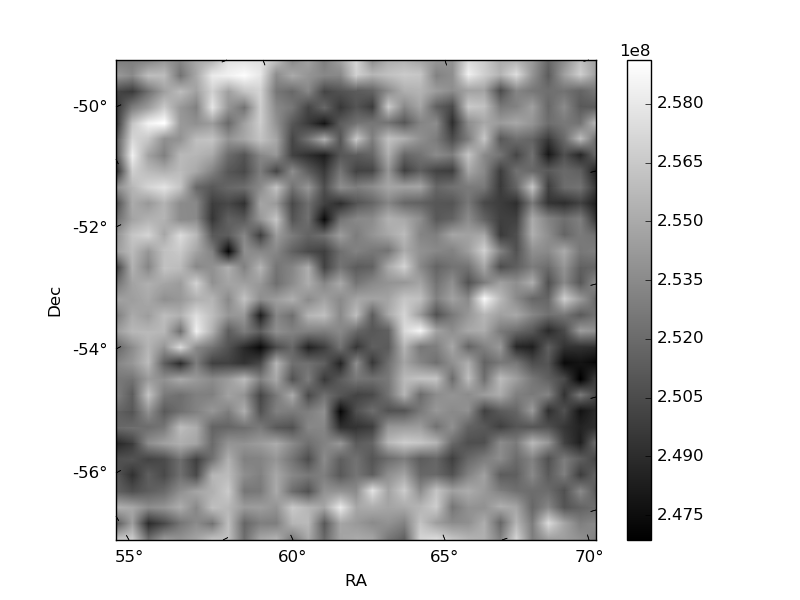
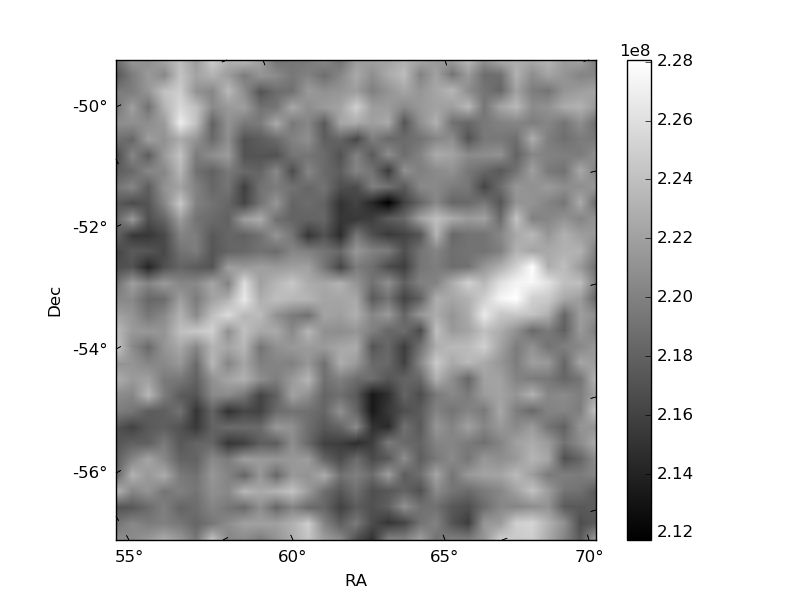
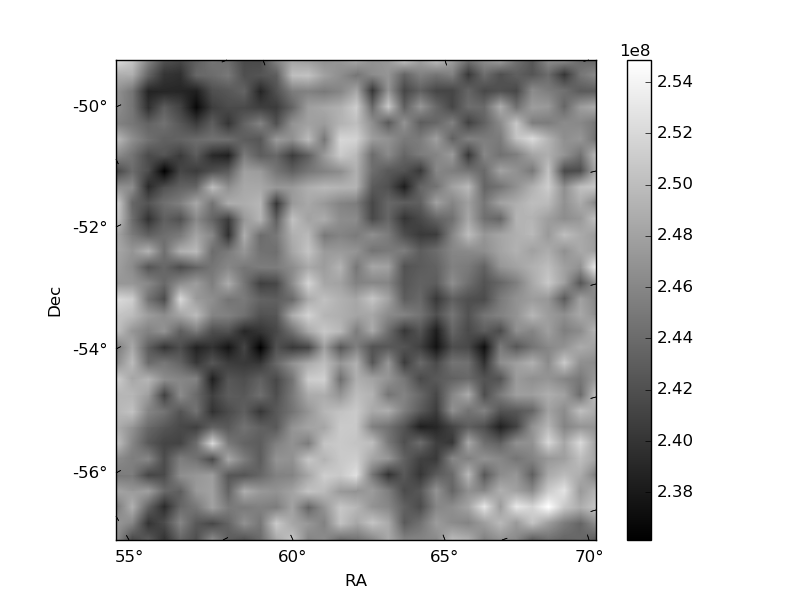
Histogram calculated using DETX and DETY for each event in the final _common_clean file
| Quadrant A | 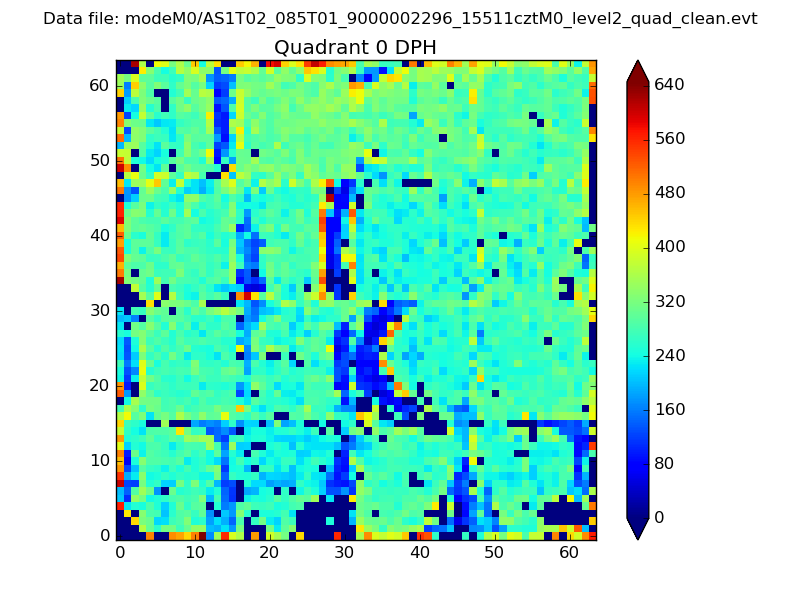 |
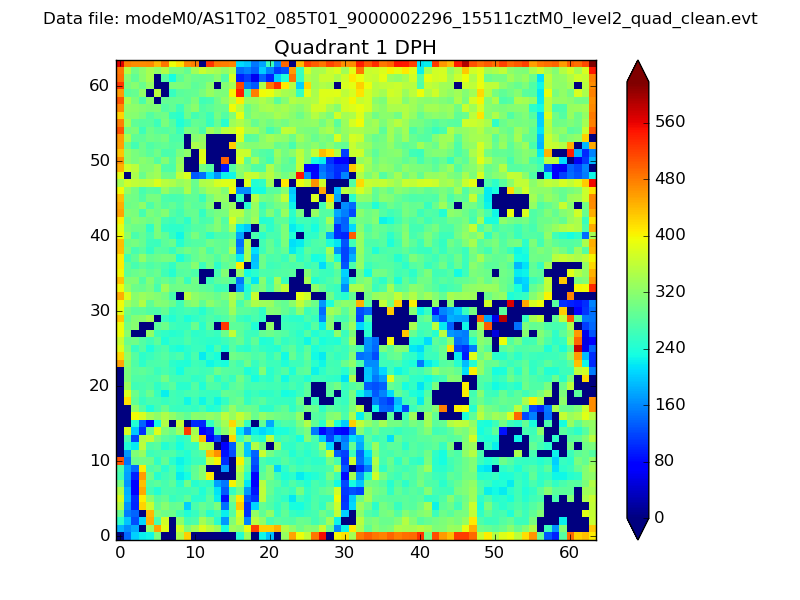 |
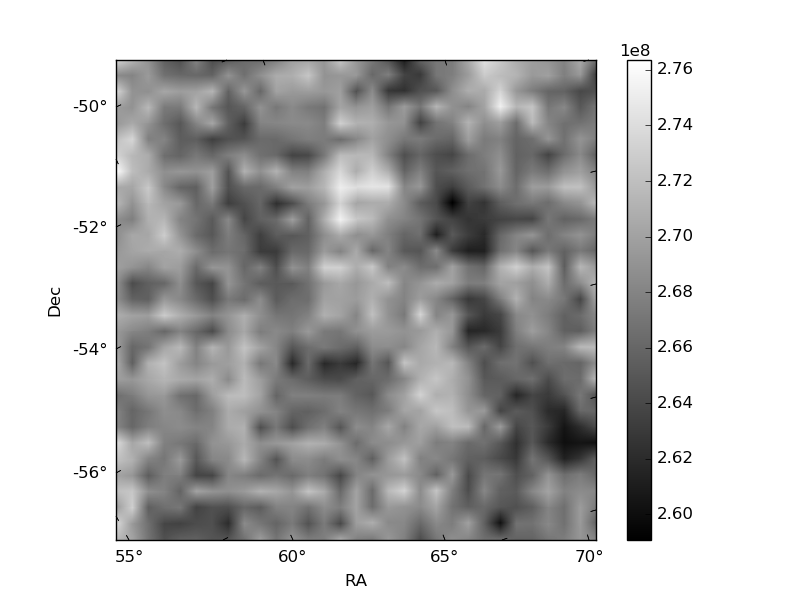
Quadrant B |
|---|---|---|---|
| Quadrant D | 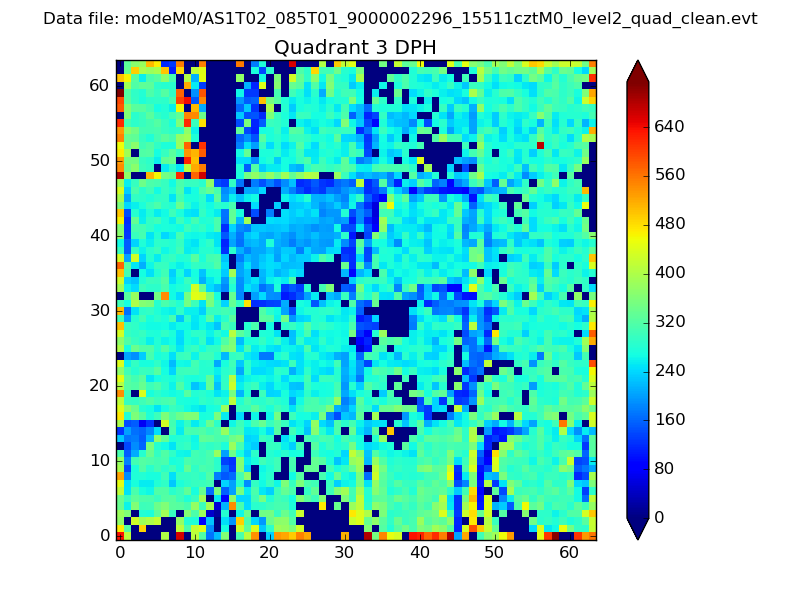 |
 |
Quadrant C |
| Plot type | Count rate plots | Images |
|---|---|---|
| Comparison with Poisson distribution Blue bars denote a histogram of data divided into 1 sec bins. Red curve is a Poisson curve with rate = median count rate of data. |
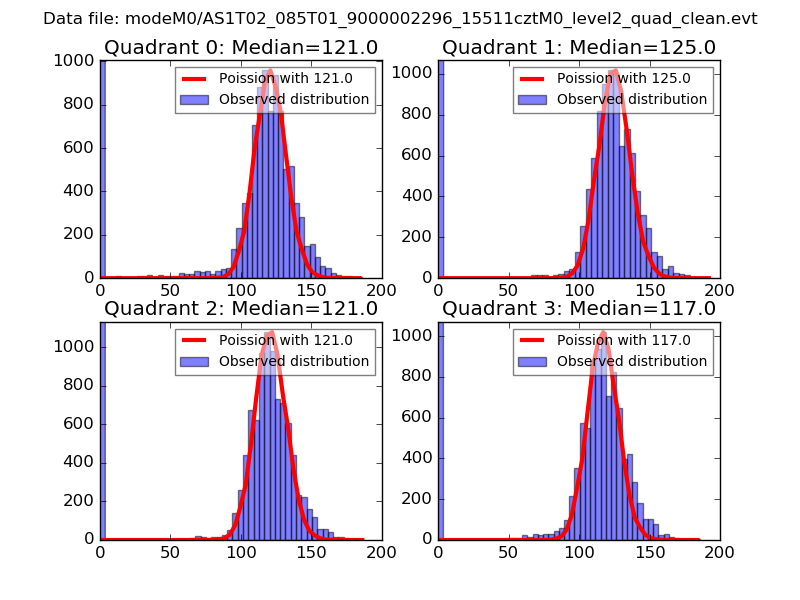 |
 |
| Quadrant-wise count rates Data is divided into 100 sec bins |
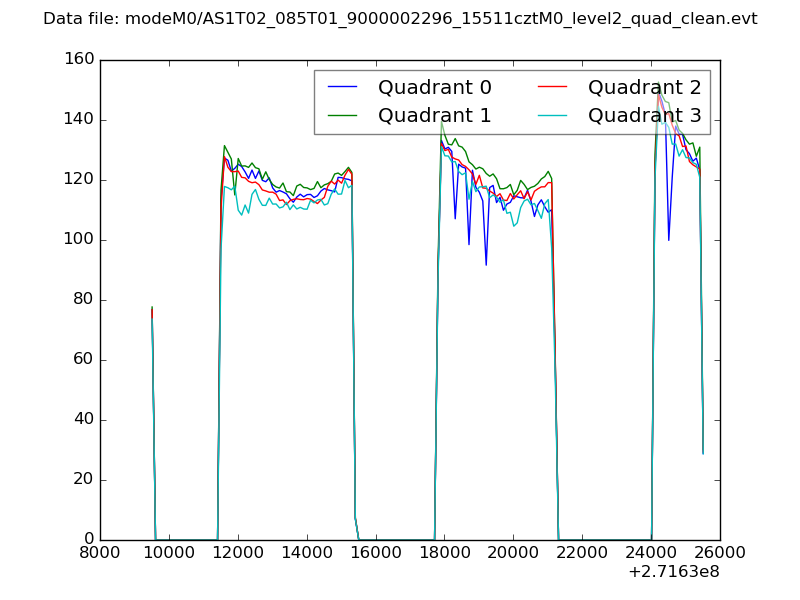 |
|
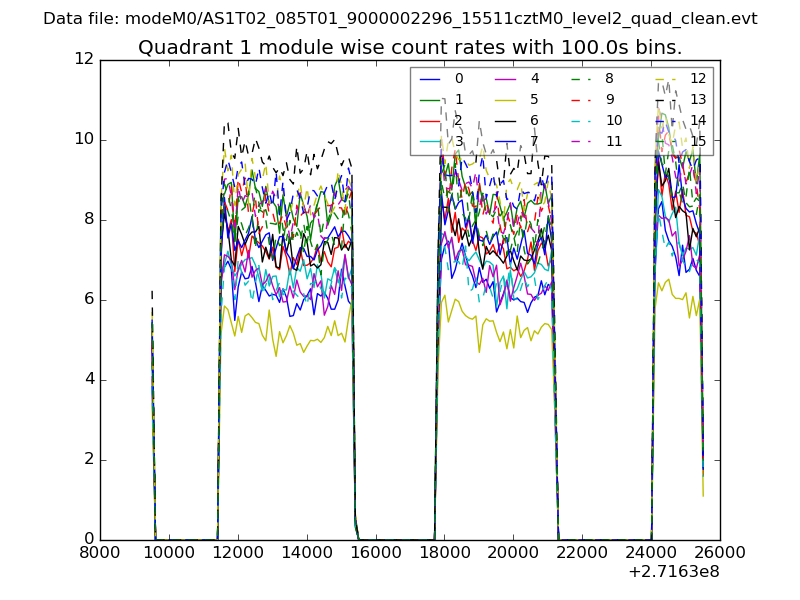
| Module-wise count rates for Quadrant A Data is divided into 100 sec bins |
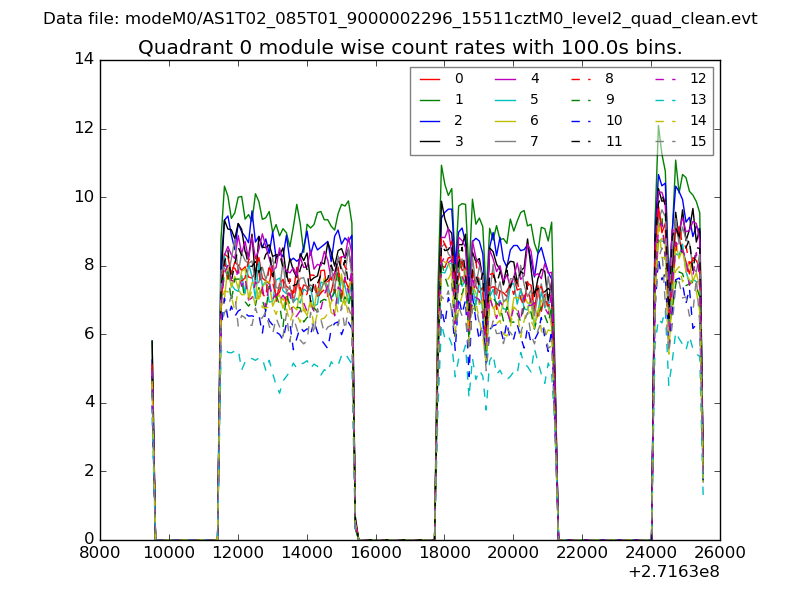 |
 |
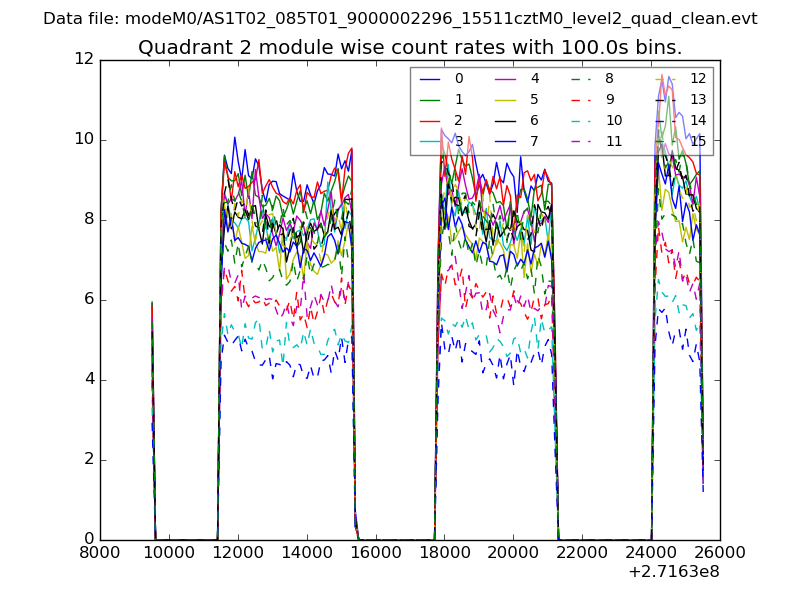
| Module-wise count rates for Quadrant B Data is divided into 100 sec bins |
 |
 |
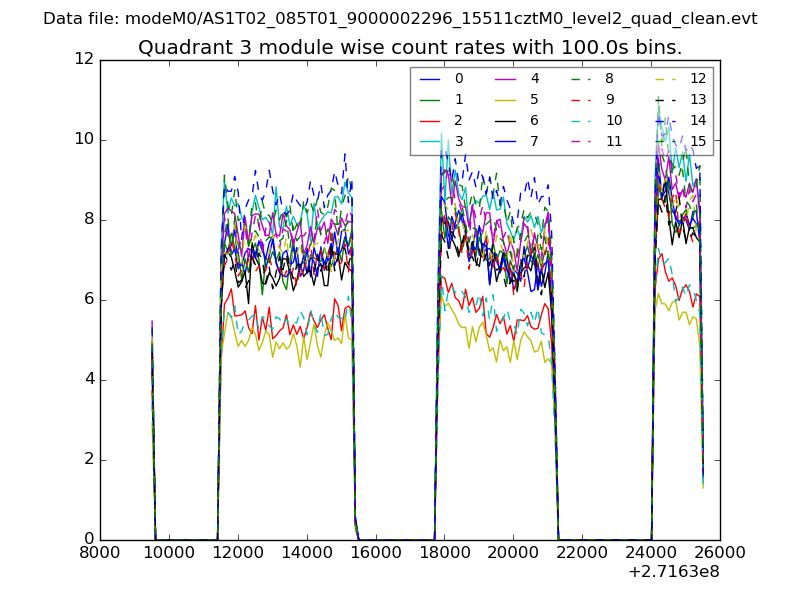
| Module-wise count rates for Quadrant C Data is divided into 100 sec bins |
 |
 |
| Module-wise count rates for Quadrant D Data is divided into 100 sec bins |
 |
 |
| Parameter | Plot |
|---|---|
| CZT HV Monitor | 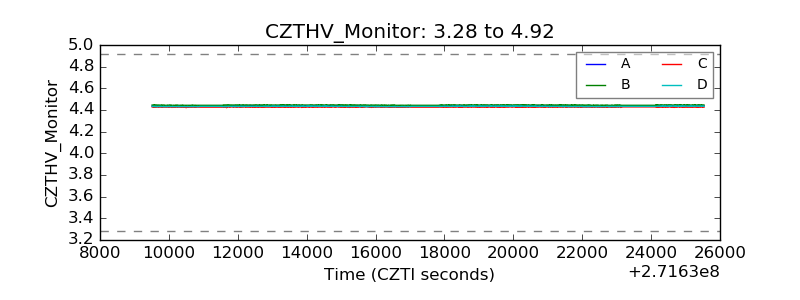 |
| D_VDD |  |
| Temperature 1 | 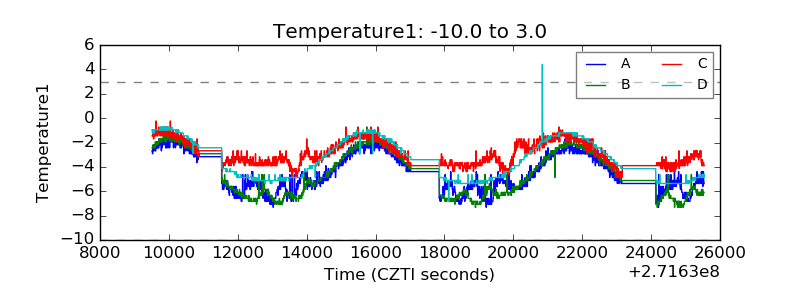 |
| Veto HV Monitor | 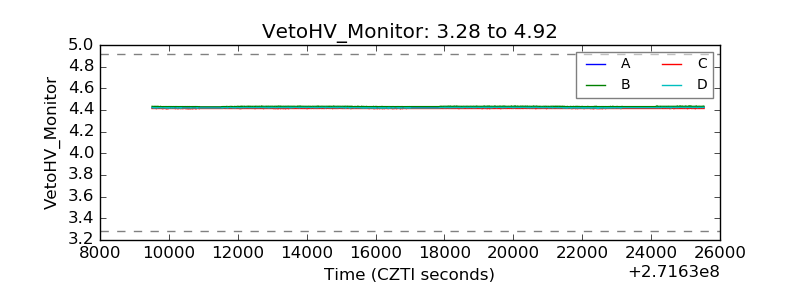 |
| Veto LLD | 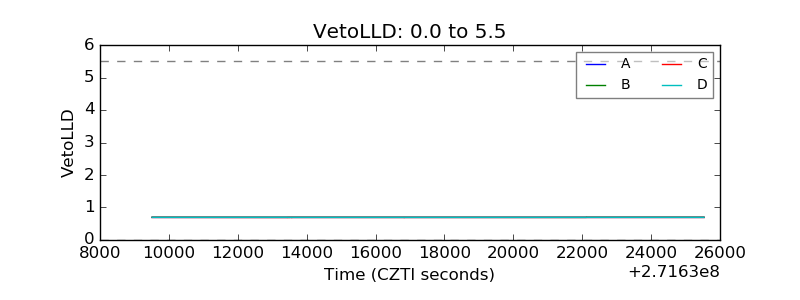 |
| Alpha Counter | 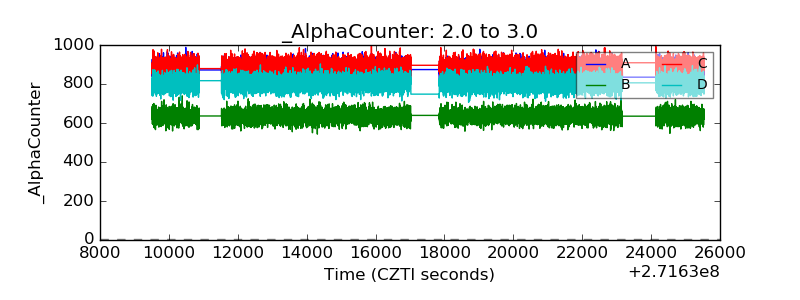 |
| _CPM_Rate | 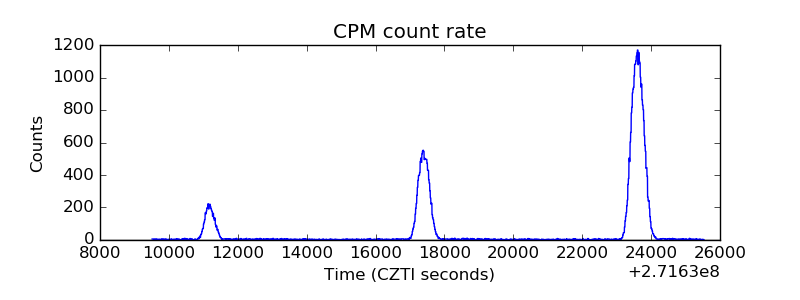 |
| CZT Counter | 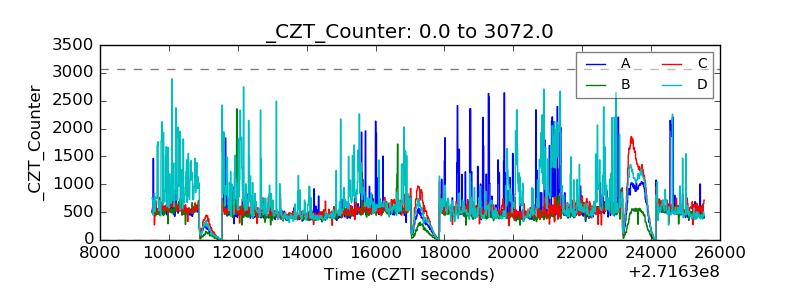 |
| +2.5 Volts monitor |  |
| +5 Volts monitor |  |
| _ROLL_ROT | 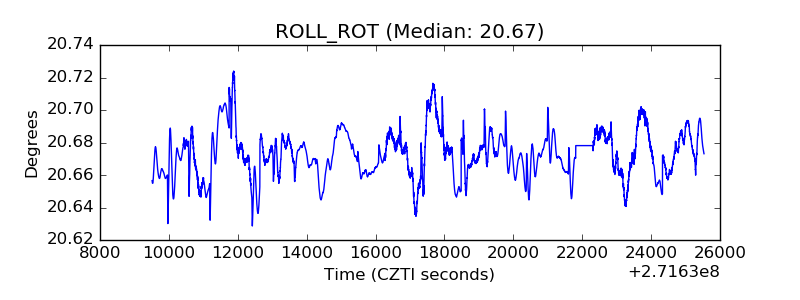 |
| _Roll_DEC | 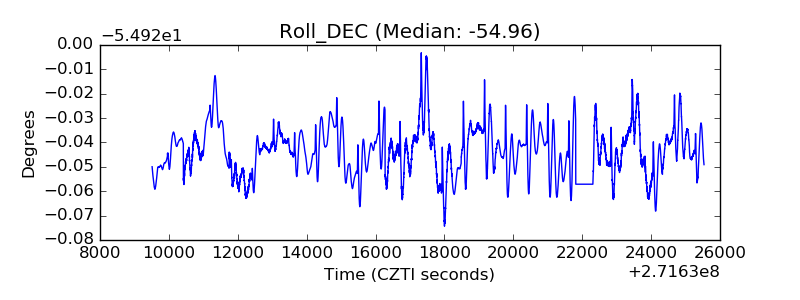 |
| _Roll_RA | 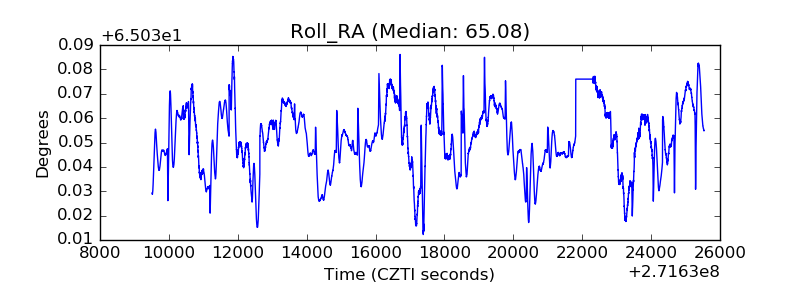 |
| Veto Counter | 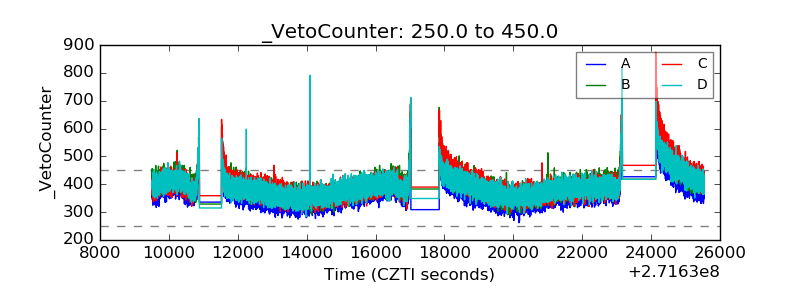 |