| Param | Original file | Final file |
|---|---|---|
| Filename | modeM0/AS1T02_085T01_9000002296_15514cztM0_level2.evt | modeM0/AS1T02_085T01_9000002296_15514cztM0_level2_quad_clean.evt |
| Size (bytes) | 848,352,960 | 163,350,720 |
| Size | 809.1 MB | 155.8 MB |
| Events in quadrant A | 6,760,634 | 1,039,979 |
| Events in quadrant B | 5,695,987 | 1,066,184 |
| Events in quadrant C | 6,302,812 | 1,040,599 |
| Events in quadrant D | 6,165,431 | 1,015,572 |
| Mode SS | |||
|---|---|---|---|
| Quadrant | BADHDUFLAG | Total packets | Discarded packets |
| A | 0 | 232 | 0 |
| B | 0 | 232 | 0 |
| C | 0 | 232 | 0 |
| D | 0 | 232 | 0 |
| Mode M9 | |||
|---|---|---|---|
| Quadrant | BADHDUFLAG | Total packets | Discarded packets |
| A | 0 | 23 | 0 |
| B | 0 | 23 | 0 |
| C | 0 | 23 | 0 |
| D | 0 | 23 | 0 |
| Mode M0 | |||
|---|---|---|---|
| Quadrant | BADHDUFLAG | Total packets | Discarded packets |
| A | 0 | 27374 | 3 |
| B | 0 | 24014 | 2 |
| C | 0 | 25805 | 2 |
| D | 0 | 25826 | 2 |
| Quadrant | Total seconds | Saturated seconds | Saturation percentage |
|---|---|---|---|
| A | 11343 | 428 | 3.773252% |
| B | 11343 | 86 | 0.758177% |
| C | 11343 | 131 | 1.154897% |
| D | 11343 | 188 | 1.657410% |
Noise dominated data is calculated using 1-second bins in cleaned event files. If a bin has >2000 counts, and if more than 50% of those come from <1% of pixels, then it is considered to be noise-dominated and hence unusable.
| Quadrant | # 1 sec bins | Bins with >0 counts | Bins with >2000 counts | High rate bins dominated by noise | Noise dominated (total time) | Noise dominated (detector-on time) | Marked lightcurve |
|---|---|---|---|---|---|---|---|
| A | 13669 | 11346 | 234 | 234 | 1.71% | 2.06% | 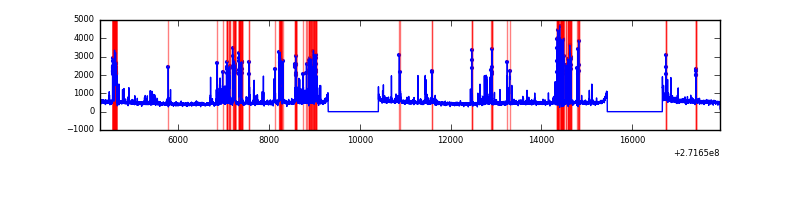 |
| B | 13669 | 11346 | 9 | 9 | 0.07% | 0.08% | 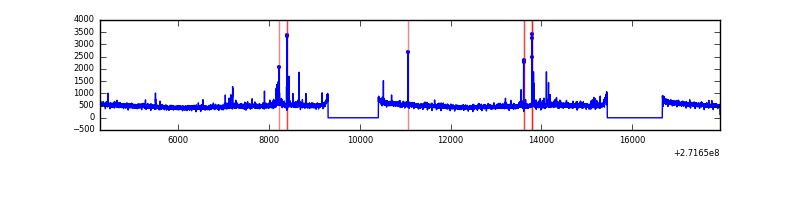 |
| C | 13669 | 11346 | 0 | 0 | 0.00% | 0.00% | 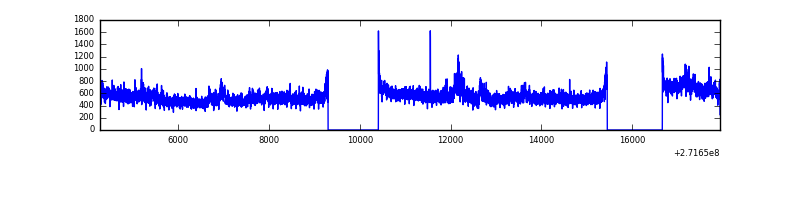 |
| D | 13669 | 11345 | 111 | 111 | 0.81% | 0.98% | 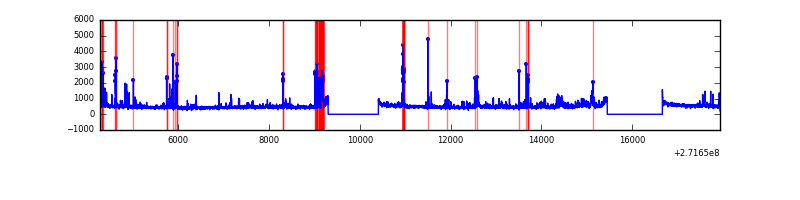 |
Top three noisy pixels from each quadrant. If the there are fewer than three noisy pixels in the level2.evt file, extra rows are filled as -1
| Pixel properties | Quadrant properties | ||||||
|---|---|---|---|---|---|---|---|
| Quadrant | DetID | PixID | Counts | Sigma | Mean | Median | Sigma |
| A | 14 | 238 | 963297 | 3465.67 | 1387 | 1358 | 277.6 |
| A | 0 | 253 | 218374 | 781.86 | 1387 | 1358 | 277.6 |
| A | 14 | 237 | 193473 | 692.15 | 1387 | 1358 | 277.6 |
| B | 0 | 189 | 66628 | 246.53 | 1402 | 1362 | 264.7 |
| B | 0 | 197 | 51349 | 188.81 | 1402 | 1362 | 264.7 |
| B | 0 | 229 | 34528 | 125.28 | 1402 | 1362 | 264.7 |
| C | 3 | 233 | 739452 | 2342.58 | 1367 | 1378 | 315.1 |
| C | 14 | 238 | 210280 | 663.04 | 1367 | 1378 | 315.1 |
| C | 13 | 61 | 9623 | 26.17 | 1367 | 1378 | 315.1 |
| D | 1 | 52 | 319280 | 943.13 | 1391 | 1353 | 337.1 |
| D | 5 | 222 | 295027 | 871.18 | 1391 | 1353 | 337.1 |
| D | 12 | 221 | 88839 | 259.53 | 1391 | 1353 | 337.1 |
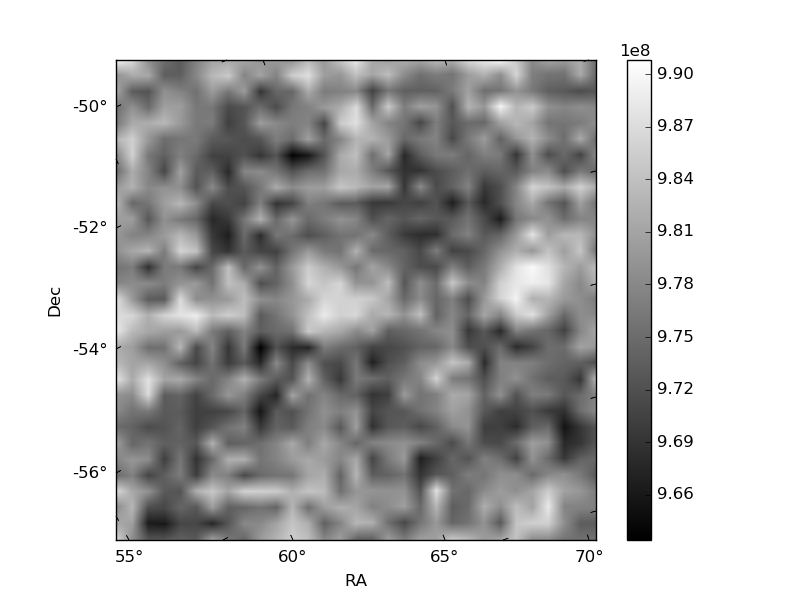
Histogram calculated using DETX and DETY for each event in the final _common_clean file
| Quadrant A | 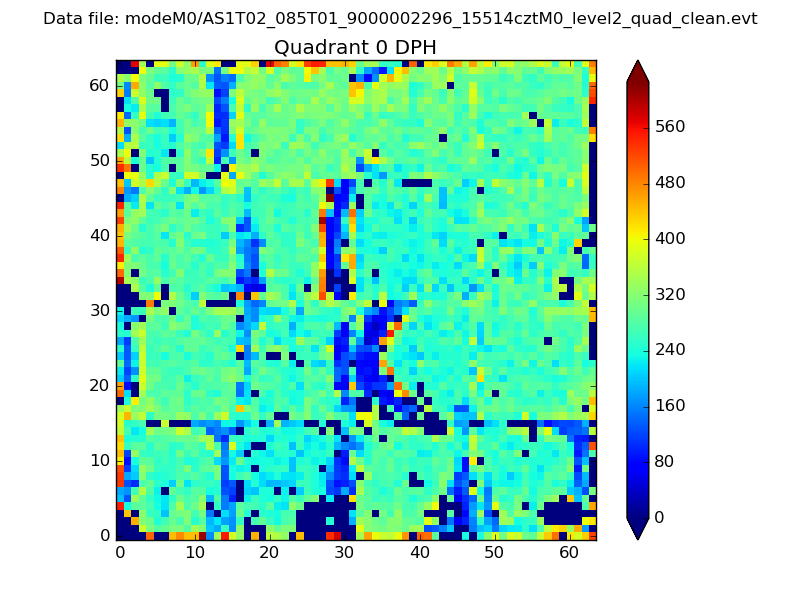 |
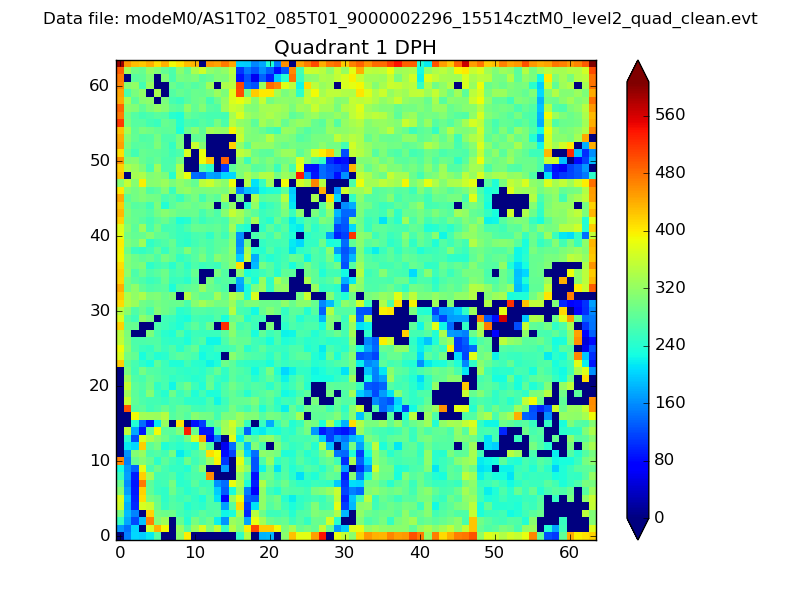 |
Quadrant B |
|---|---|---|---|
| Quadrant D | 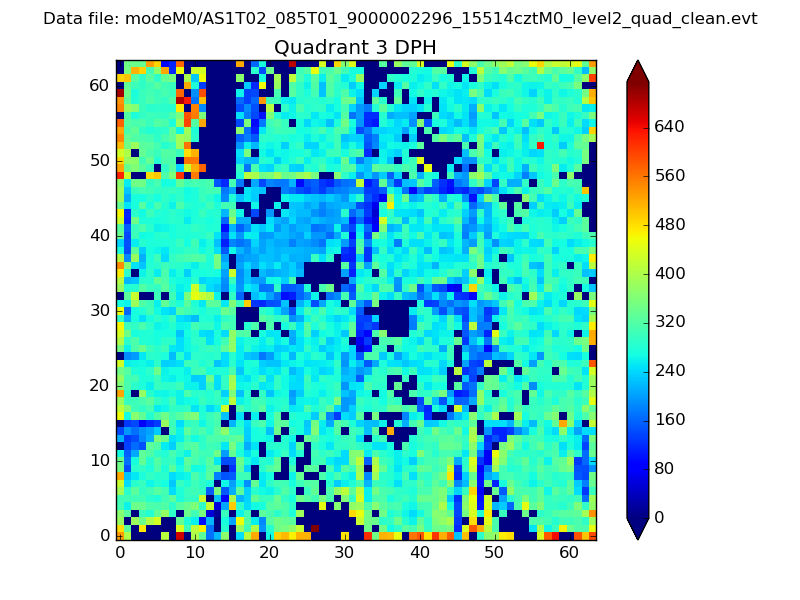 |
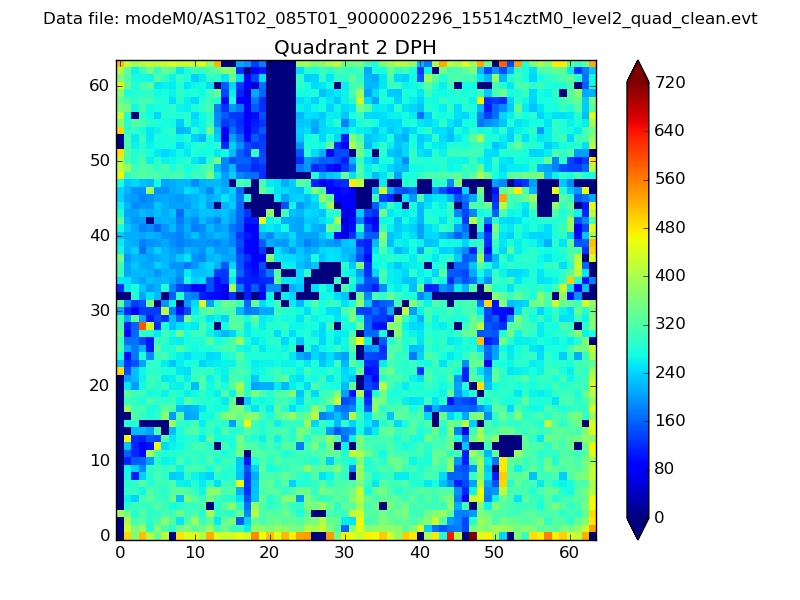 |
Quadrant C |
| Plot type | Count rate plots | Images |
|---|---|---|
| Comparison with Poisson distribution Blue bars denote a histogram of data divided into 1 sec bins. Red curve is a Poisson curve with rate = median count rate of data. |
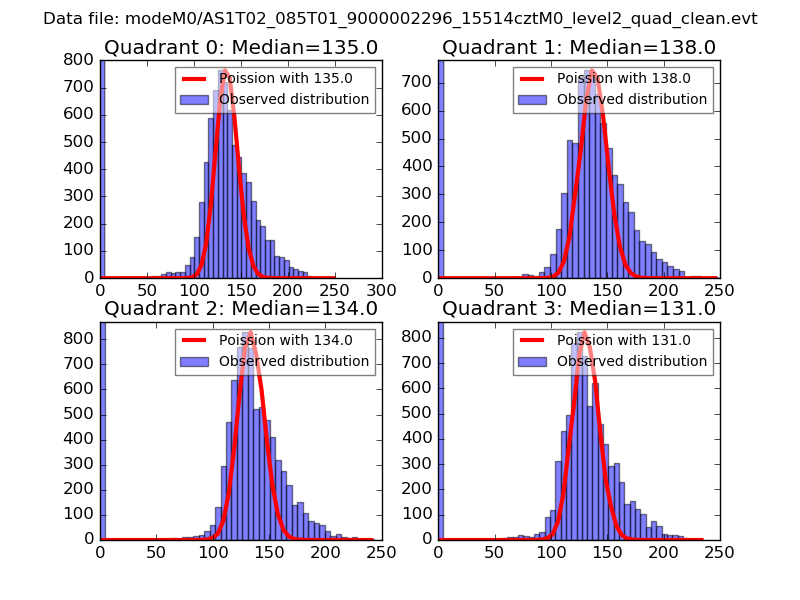 |
 |
| Quadrant-wise count rates Data is divided into 100 sec bins |
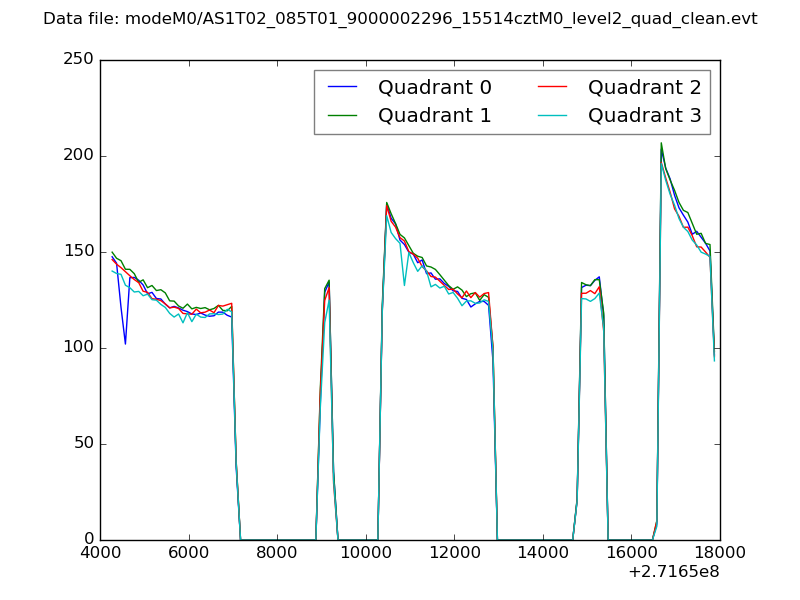 |
|
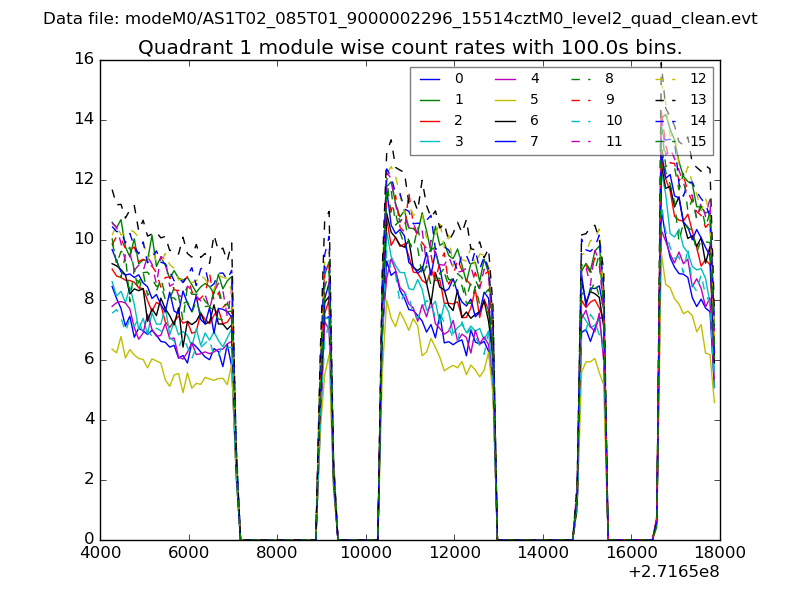
| Module-wise count rates for Quadrant A Data is divided into 100 sec bins |
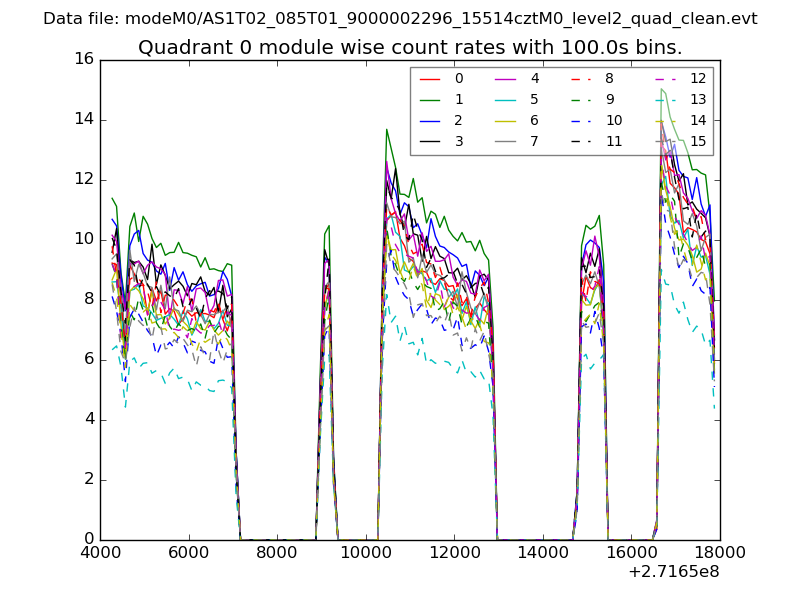 |
 |
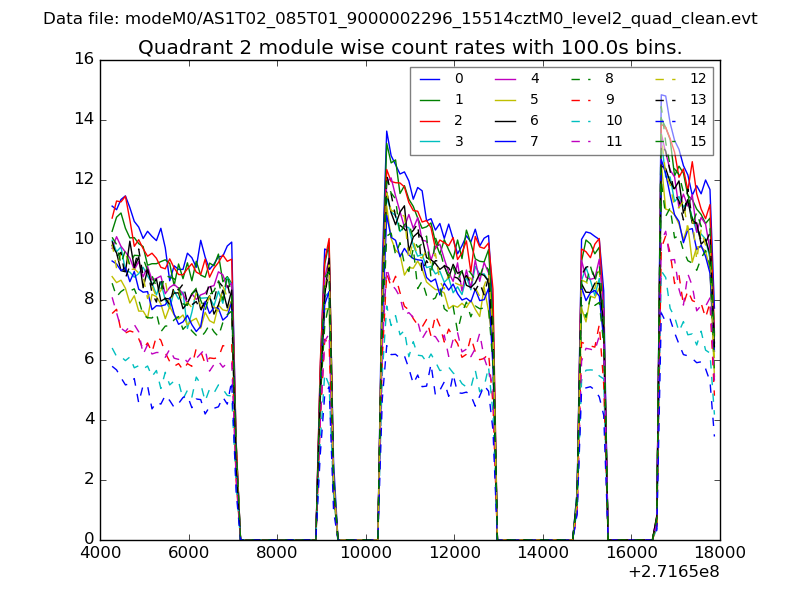
| Module-wise count rates for Quadrant B Data is divided into 100 sec bins |
 |
 |
| Module-wise count rates for Quadrant C Data is divided into 100 sec bins |
 |
 |
| Module-wise count rates for Quadrant D Data is divided into 100 sec bins |
 |
 |
| Parameter | Plot |
|---|---|
| CZT HV Monitor | 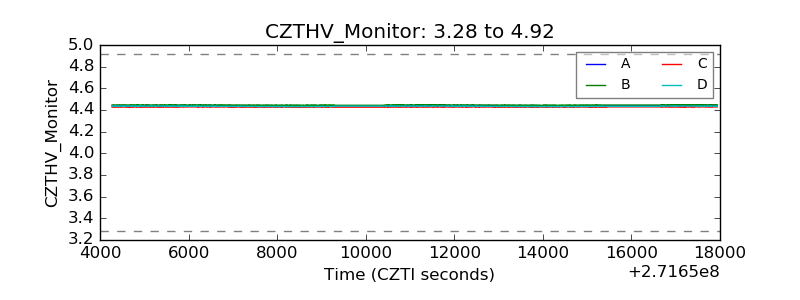 |
| D_VDD | 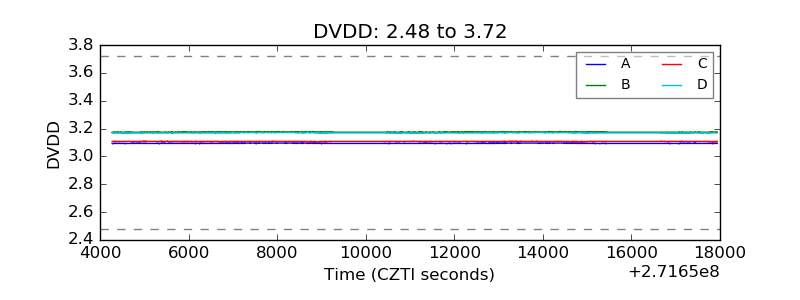 |
| Temperature 1 |  |
| Veto HV Monitor | 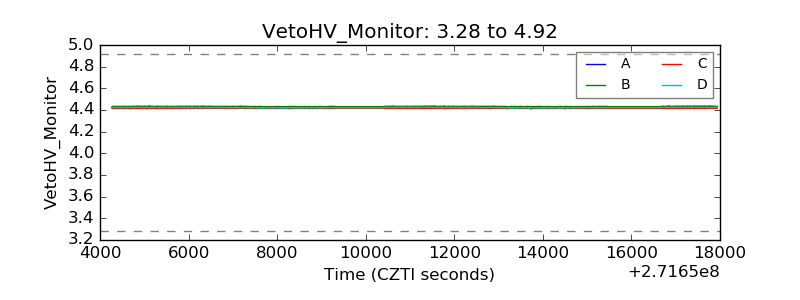 |
| Veto LLD | 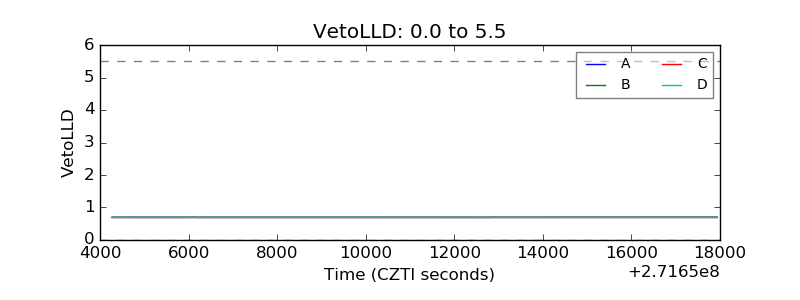 |
| Alpha Counter | 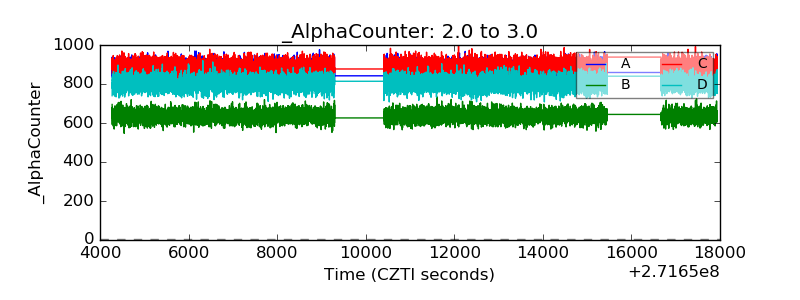 |
| _CPM_Rate | 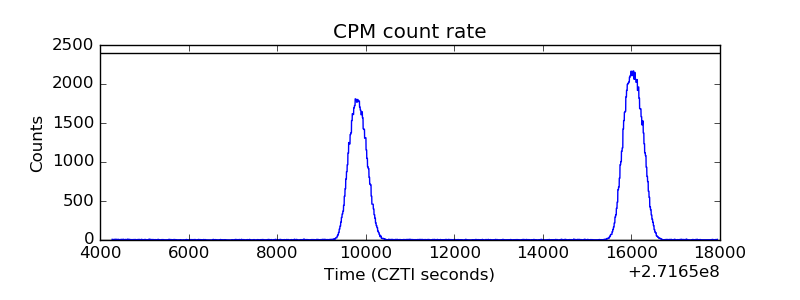 |
| CZT Counter | 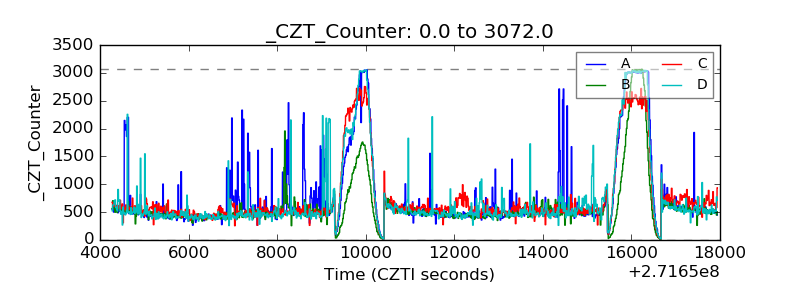 |
| +2.5 Volts monitor |  |
| +5 Volts monitor |  |
| _ROLL_ROT | 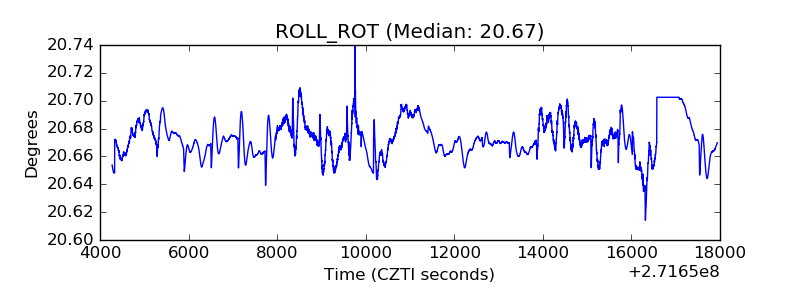 |
| _Roll_DEC |  |
| _Roll_RA | 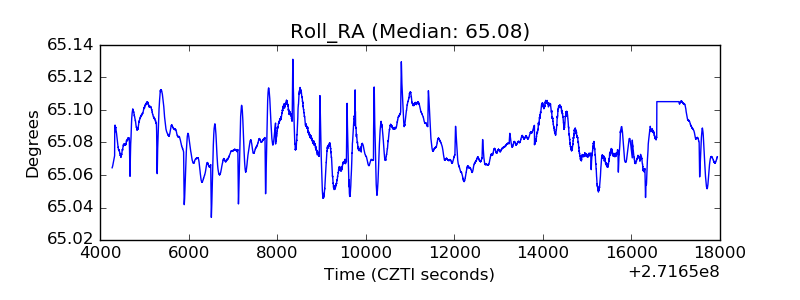 |
| Veto Counter | 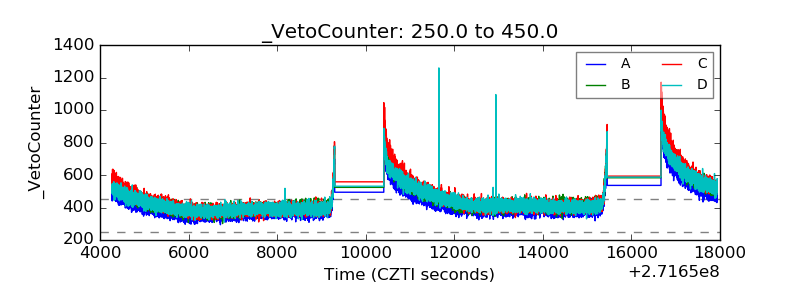 |