| Param | Original file | Final file |
|---|---|---|
| Filename | modeM0/AS1T02_085T01_9000002296_15518cztM0_level2.evt | modeM0/AS1T02_085T01_9000002296_15518cztM0_level2_quad_clean.evt |
| Size (bytes) | 676,474,560 | 78,197,760 |
| Size | 645.1 MB | 74.6 MB |
| Events in quadrant A | 3,968,564 | 506,099 |
| Events in quadrant B | 3,394,580 | 516,249 |
| Events in quadrant C | 3,360,329 | 492,821 |
| Events in quadrant D | 9,318,643 | 394,193 |
| Mode SS | |||
|---|---|---|---|
| Quadrant | BADHDUFLAG | Total packets | Discarded packets |
| A | 0 | 134 | 0 |
| B | 0 | 134 | 0 |
| C | 0 | 134 | 0 |
| D | 0 | 134 | 0 |
| Mode M9 | |||
|---|---|---|---|
| Quadrant | BADHDUFLAG | Total packets | Discarded packets |
| A | 0 | 11 | 0 |
| B | 0 | 11 | 0 |
| C | 0 | 11 | 0 |
| D | 0 | 11 | 0 |
| Mode M0 | |||
|---|---|---|---|
| Quadrant | BADHDUFLAG | Total packets | Discarded packets |
| A | 0 | 15824 | 2 |
| B | 0 | 13944 | 1 |
| C | 0 | 13904 | 1 |
| D | 0 | 32100 | 1 |
| Quadrant | Total seconds | Saturated seconds | Saturation percentage |
|---|---|---|---|
| A | 6563 | 322 | 4.906293% |
| B | 6563 | 117 | 1.782721% |
| C | 6563 | 129 | 1.965565% |
| D | 6563 | 2525 | 38.473259% |
Noise dominated data is calculated using 1-second bins in cleaned event files. If a bin has >2000 counts, and if more than 50% of those come from <1% of pixels, then it is considered to be noise-dominated and hence unusable.
| Quadrant | # 1 sec bins | Bins with >0 counts | Bins with >2000 counts | High rate bins dominated by noise | Noise dominated (total time) | Noise dominated (detector-on time) | Marked lightcurve |
|---|---|---|---|---|---|---|---|
| A | 7684 | 6564 | 140 | 140 | 1.82% | 2.13% | 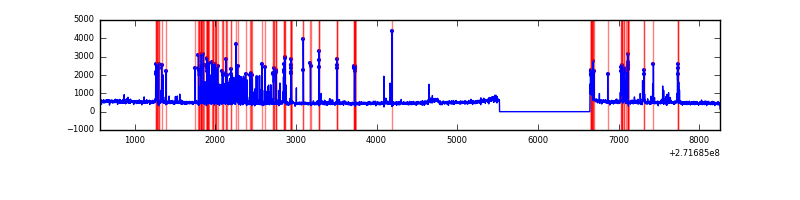 |
| B | 7684 | 6564 | 4 | 4 | 0.05% | 0.06% | 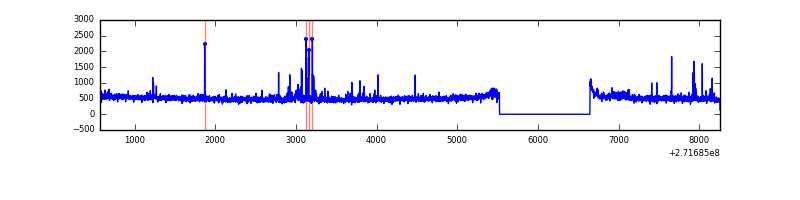 |
| C | 7684 | 6564 | 0 | 0 | 0.00% | 0.00% | 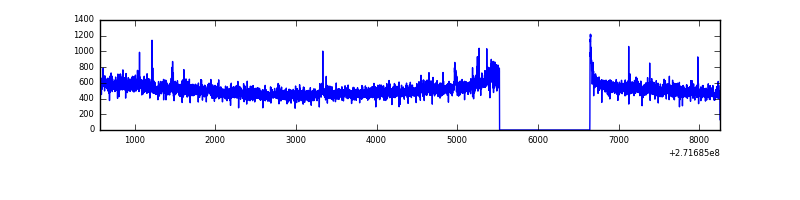 |
| D | 7684 | 6564 | 2162 | 2162 | 28.14% | 32.94% | 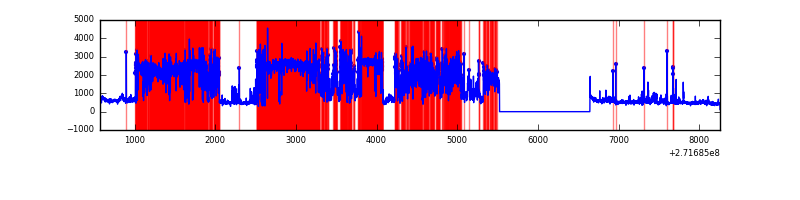 |
Top three noisy pixels from each quadrant. If the there are fewer than three noisy pixels in the level2.evt file, extra rows are filled as -1
| Pixel properties | Quadrant properties | ||||||
|---|---|---|---|---|---|---|---|
| Quadrant | DetID | PixID | Counts | Sigma | Mean | Median | Sigma |
| A | 0 | 253 | 498324 | 3004.44 | 826 | 809 | 165.6 |
| A | 14 | 238 | 236855 | 1425.45 | 826 | 809 | 165.6 |
| A | 14 | 237 | 55356 | 329.4 | 826 | 809 | 165.6 |
| B | 0 | 189 | 58934 | 379.95 | 824 | 806 | 153.0 |
| B | 12 | 111 | 17098 | 106.49 | 824 | 806 | 153.0 |
| B | 0 | 219 | 16478 | 102.44 | 824 | 806 | 153.0 |
| C | 3 | 233 | 129482 | 706.93 | 791 | 796 | 182.0 |
| C | 14 | 238 | 123613 | 674.69 | 791 | 796 | 182.0 |
| C | 0 | 207 | 15997 | 83.5 | 791 | 796 | 182.0 |
| D | 12 | 221 | 6540735 | 42607.17 | 636 | 617 | 153.5 |
| D | 1 | 52 | 141162 | 915.61 | 636 | 617 | 153.5 |
| D | 5 | 222 | 83029 | 536.89 | 636 | 617 | 153.5 |
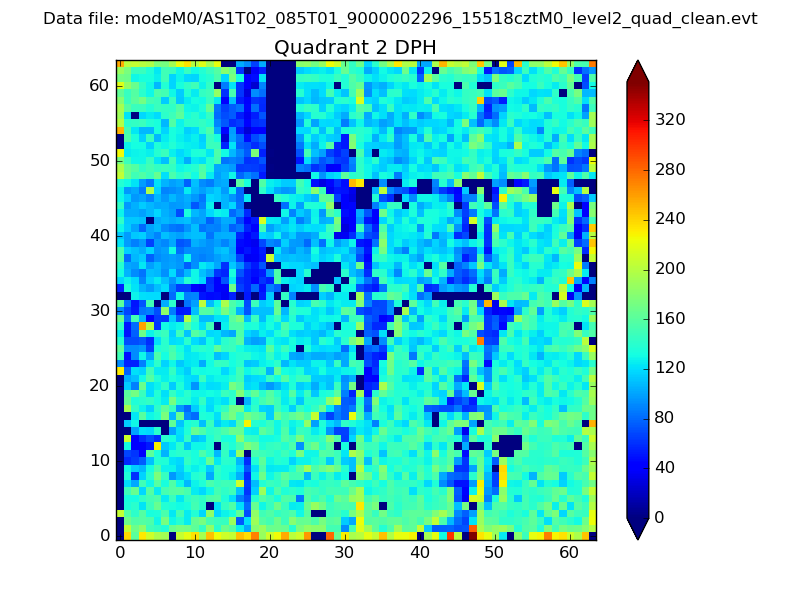
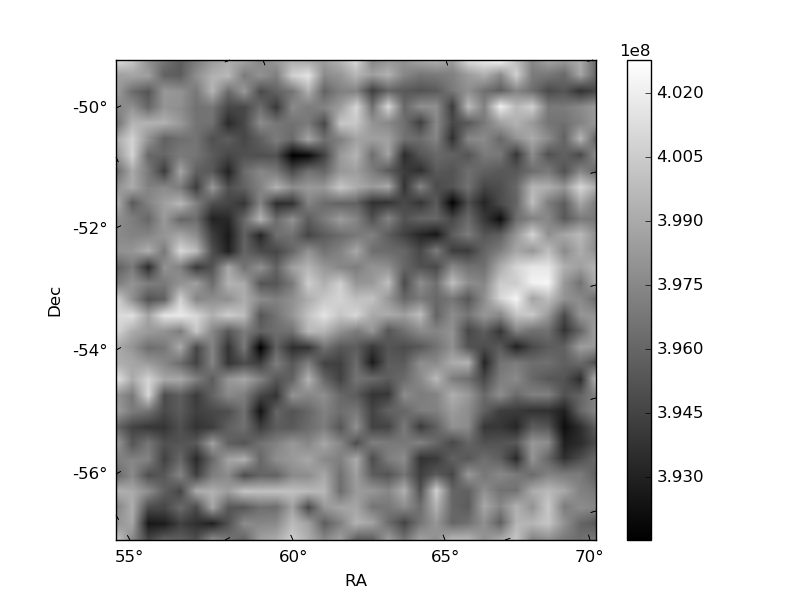
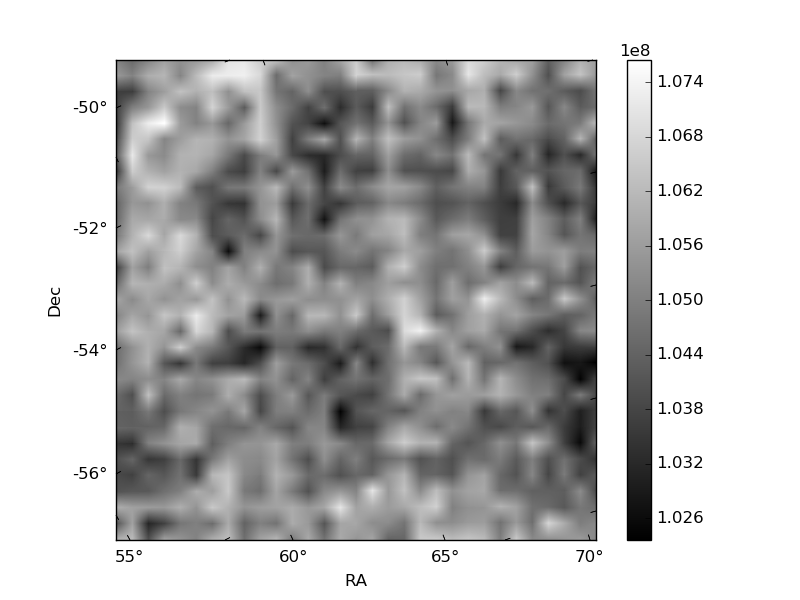
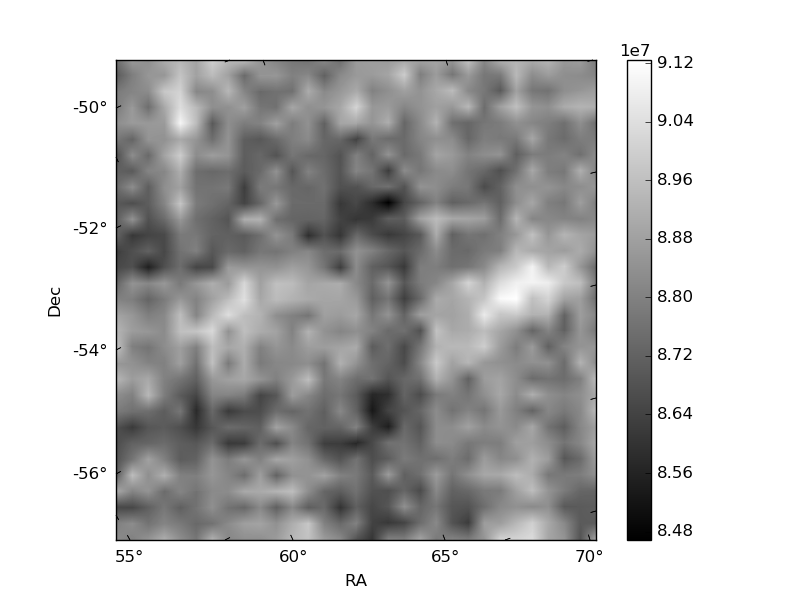
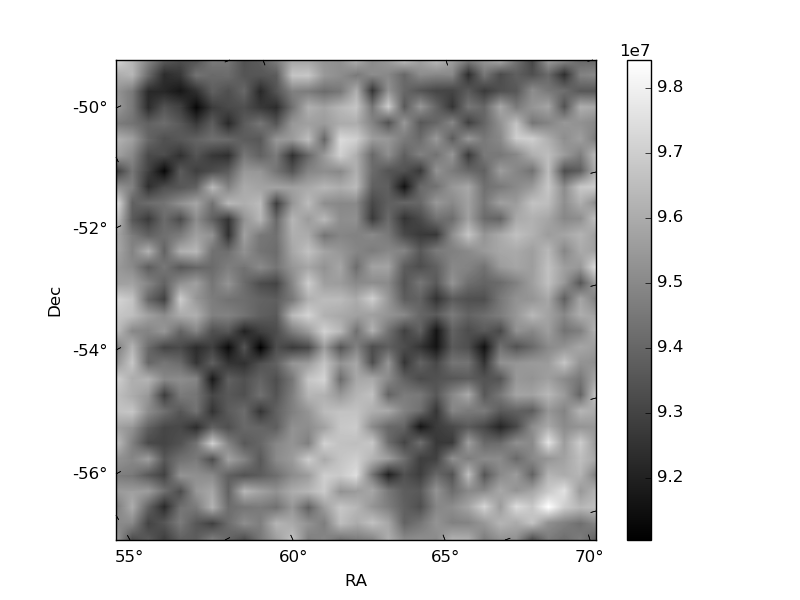
Histogram calculated using DETX and DETY for each event in the final _common_clean file
| Quadrant A | 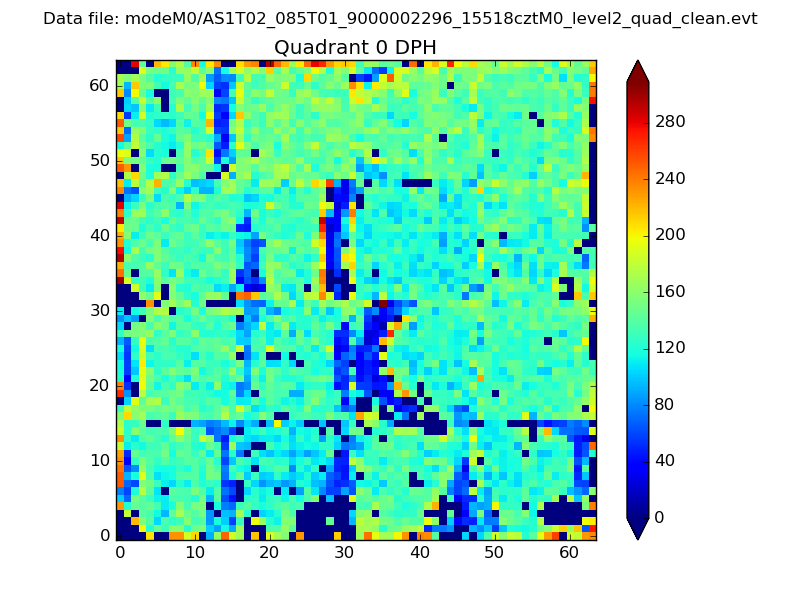 |
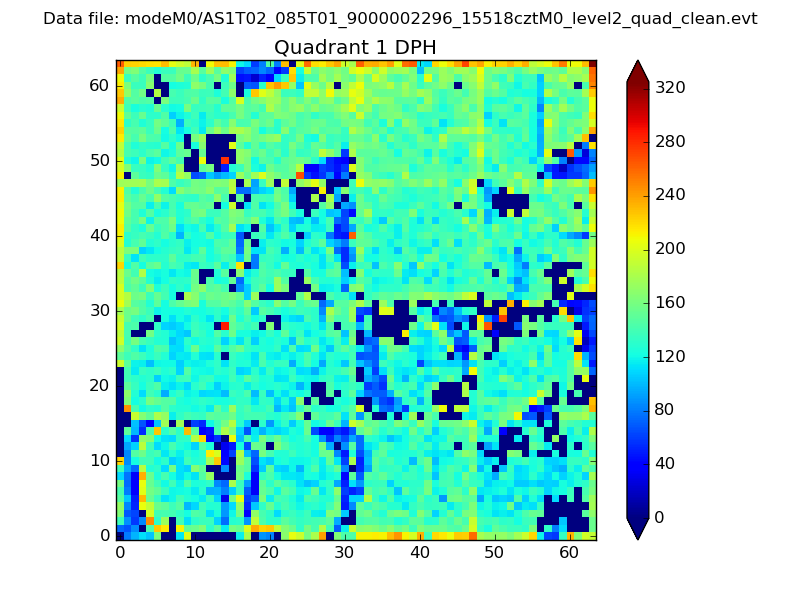 |
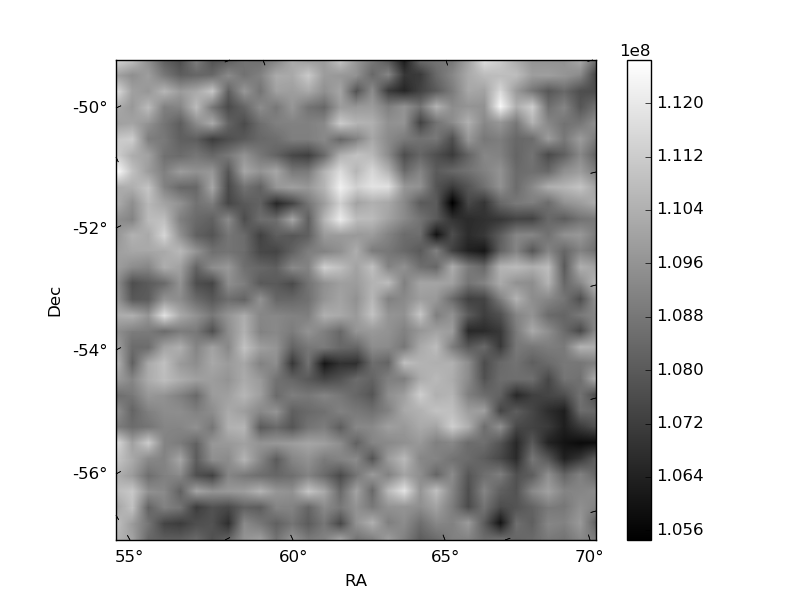
Quadrant B |
|---|---|---|---|
| Quadrant D | 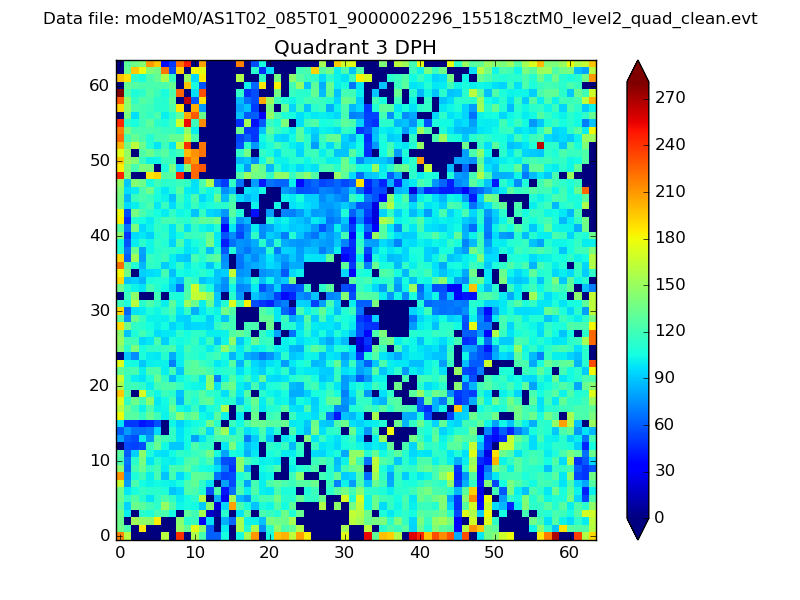 |
 |
Quadrant C |
| Plot type | Count rate plots | Images |
|---|---|---|
| Comparison with Poisson distribution Blue bars denote a histogram of data divided into 1 sec bins. Red curve is a Poisson curve with rate = median count rate of data. |
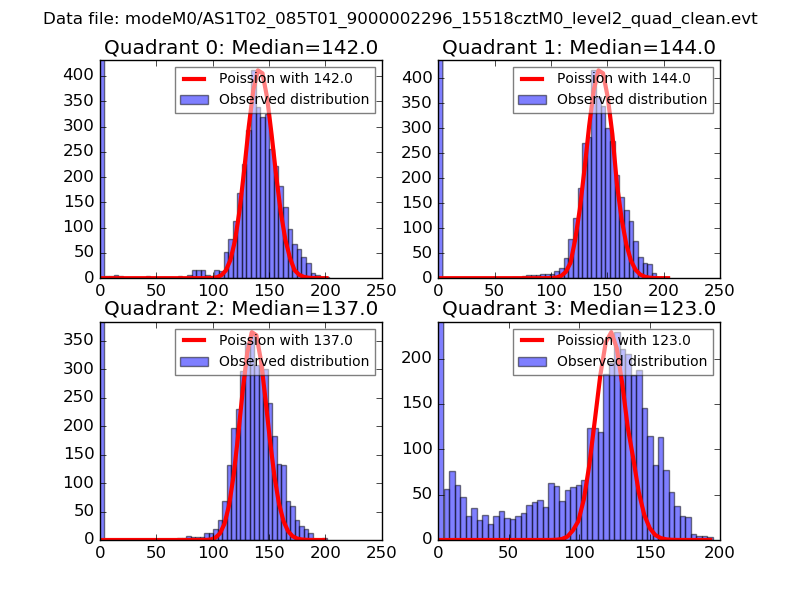 |
 |
| Quadrant-wise count rates Data is divided into 100 sec bins |
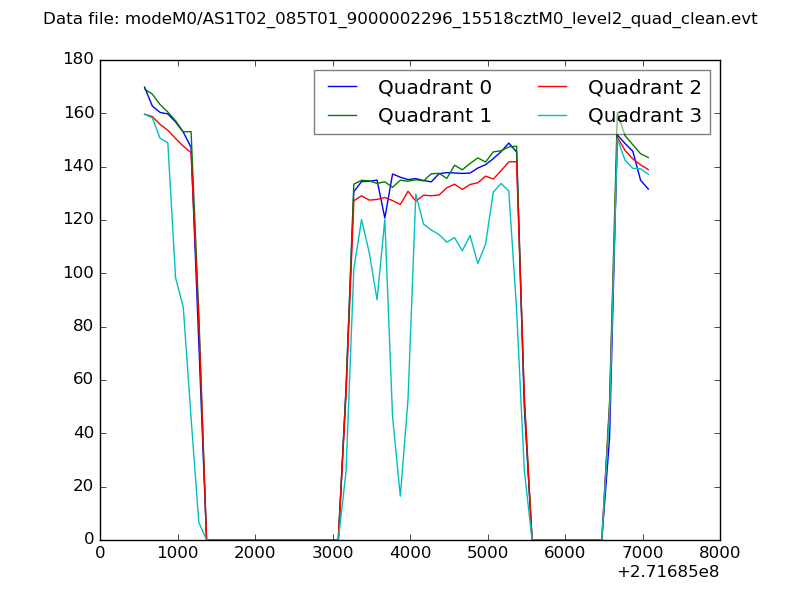 |
|
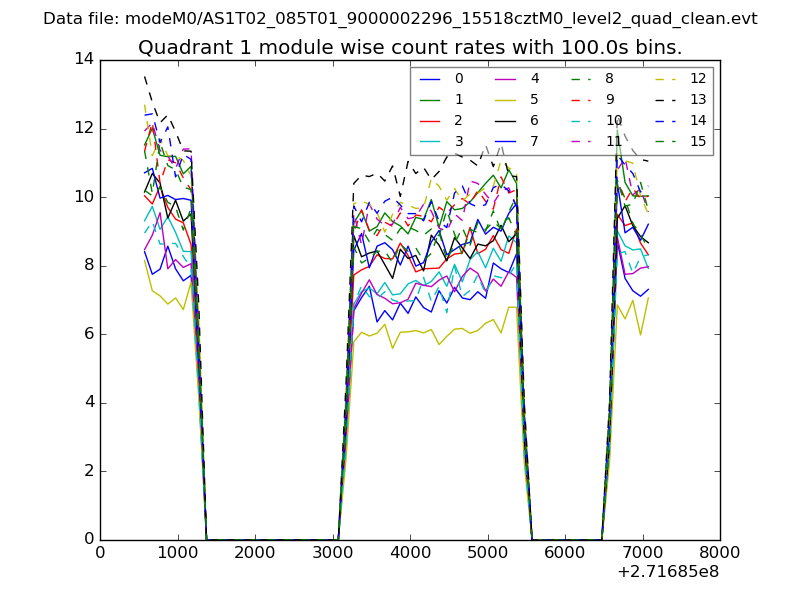
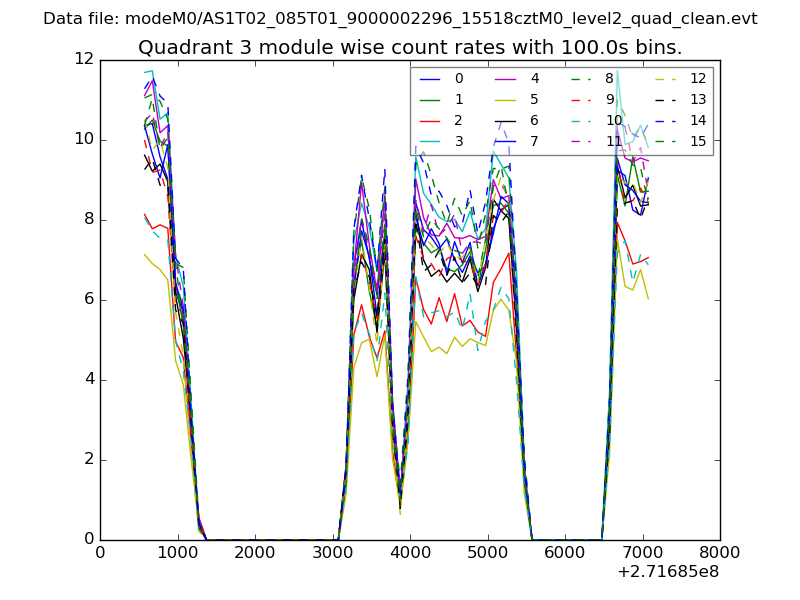
| Module-wise count rates for Quadrant A Data is divided into 100 sec bins |
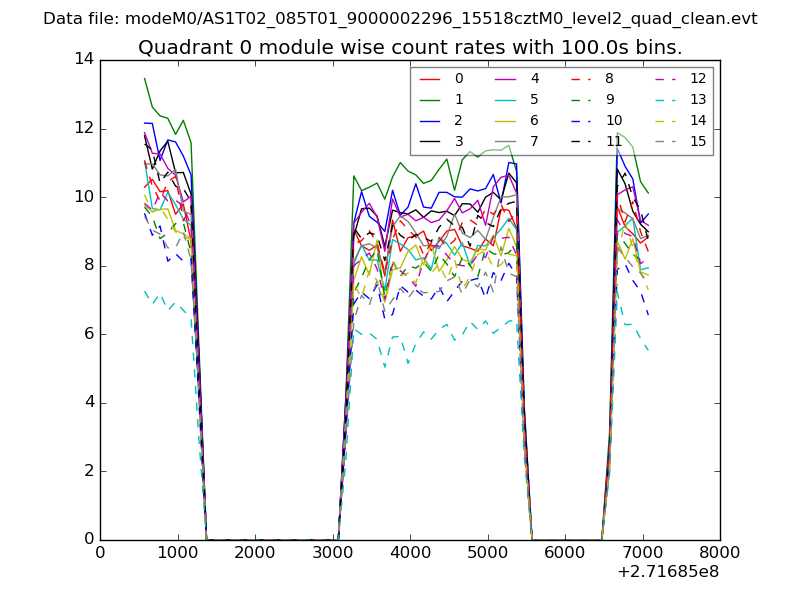 |
 |
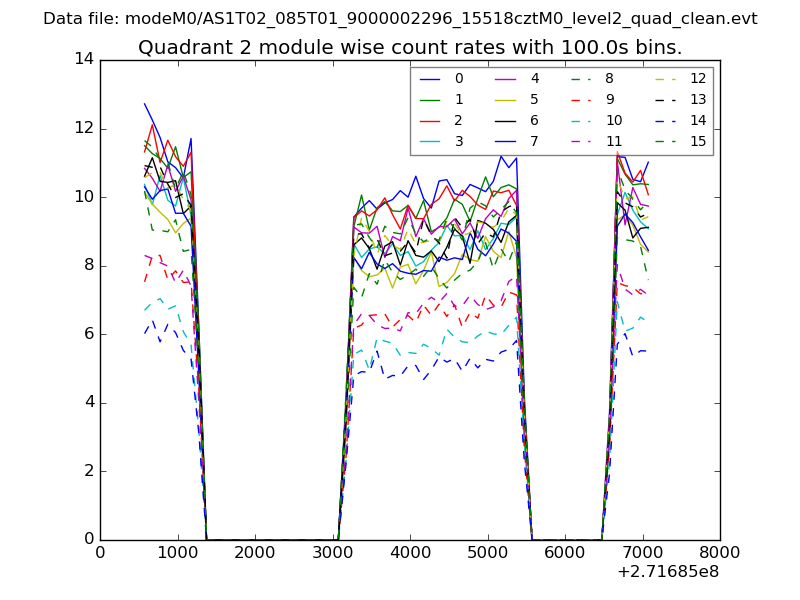
| Module-wise count rates for Quadrant B Data is divided into 100 sec bins |
 |
 |
| Module-wise count rates for Quadrant C Data is divided into 100 sec bins |
 |
 |
| Module-wise count rates for Quadrant D Data is divided into 100 sec bins |
 |
 |
| Parameter | Plot |
|---|---|
| CZT HV Monitor | 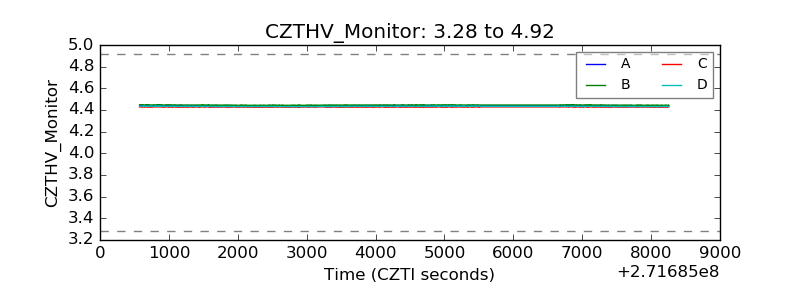 |
| D_VDD | 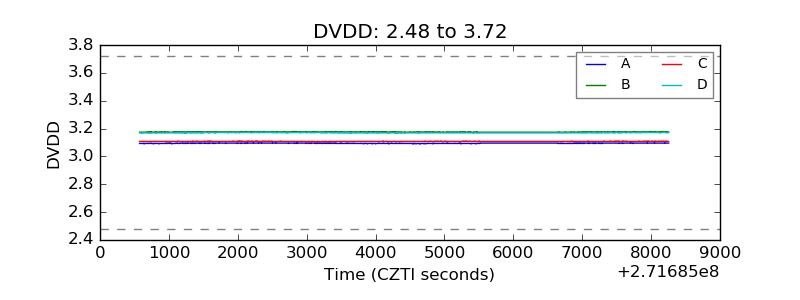 |
| Temperature 1 | 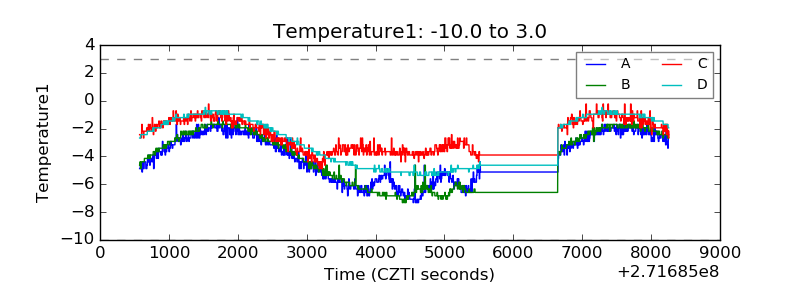 |
| Veto HV Monitor | 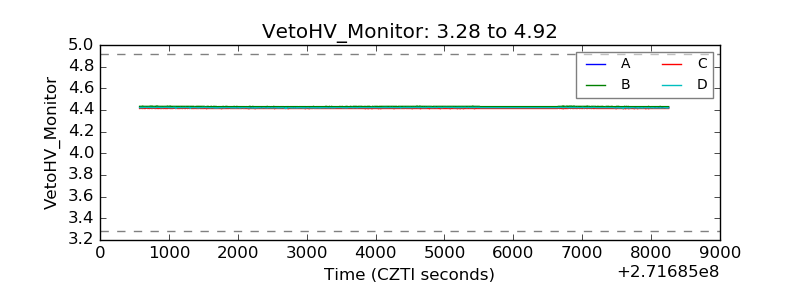 |
| Veto LLD | 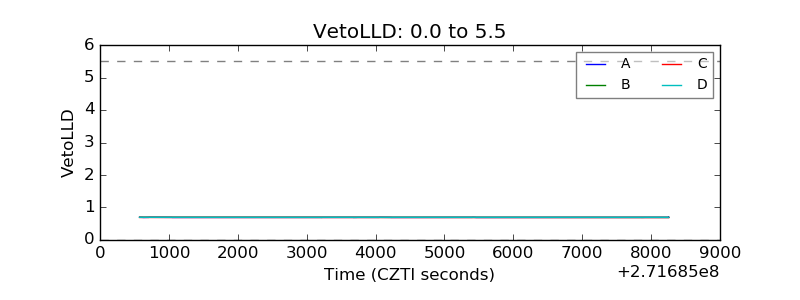 |
| Alpha Counter | 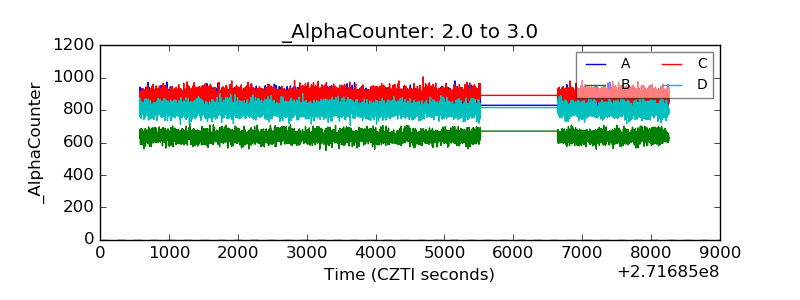 |
| _CPM_Rate | 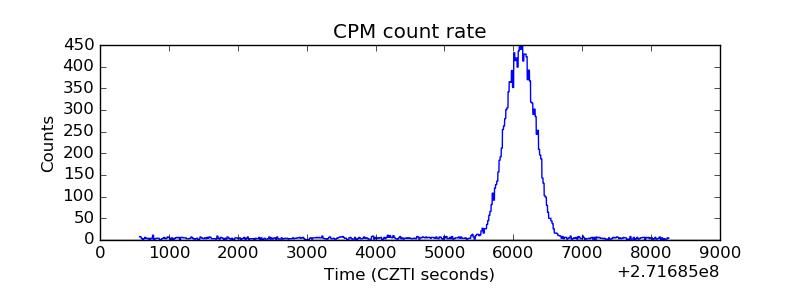 |
| CZT Counter | 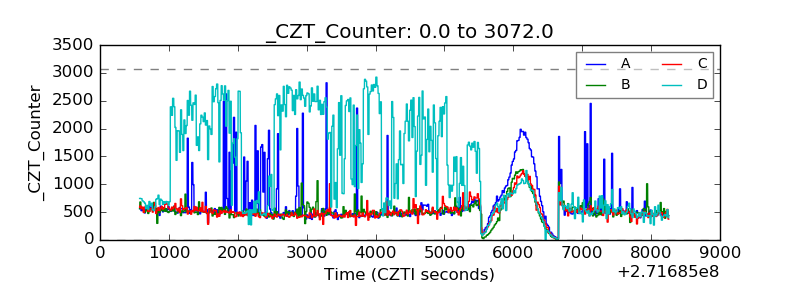 |
| +2.5 Volts monitor |  |
| +5 Volts monitor |  |
| _ROLL_ROT | 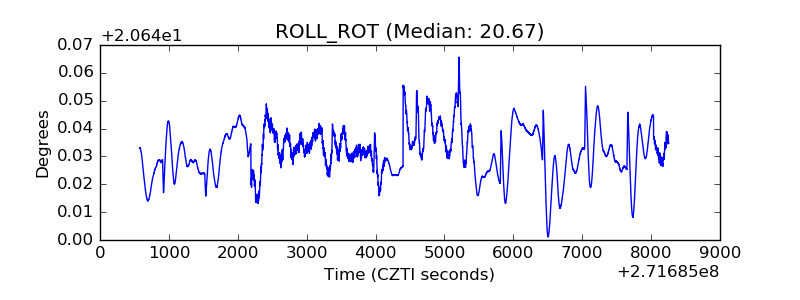 |
| _Roll_DEC | 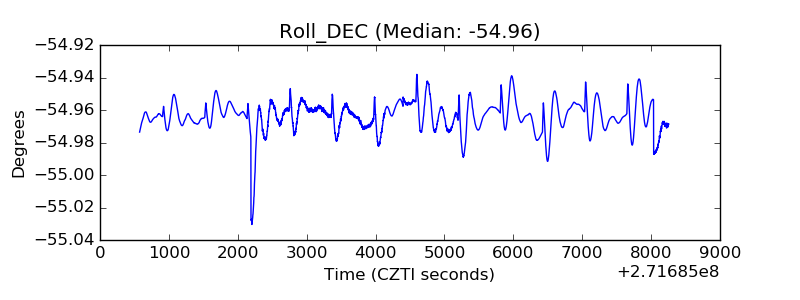 |
| _Roll_RA | 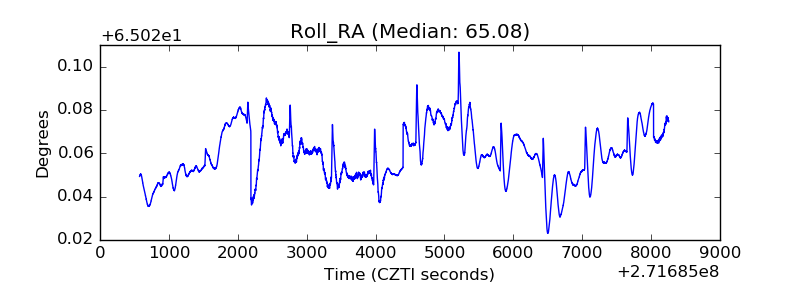 |
| Veto Counter | 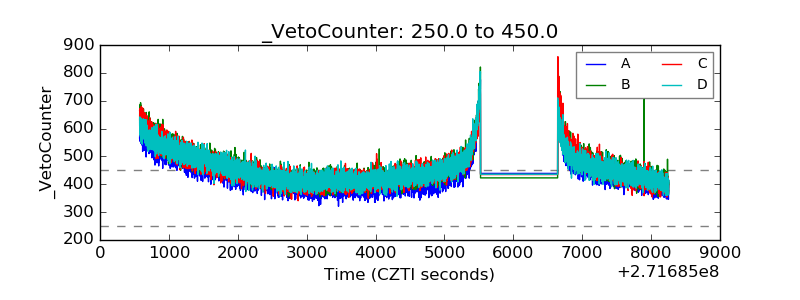 |