| Param | Original file | Final file |
|---|---|---|
| Filename | modeM0/AS1T02_085T01_9000002296_15520cztM0_level2.evt | modeM0/AS1T02_085T01_9000002296_15520cztM0_level2_quad_clean.evt |
| Size (bytes) | 547,346,880 | 82,451,520 |
| Size | 522.0 MB | 78.6 MB |
| Events in quadrant A | 4,137,908 | 500,801 |
| Events in quadrant B | 3,716,964 | 508,384 |
| Events in quadrant C | 3,860,762 | 493,395 |
| Events in quadrant D | 4,366,781 | 487,059 |
| Mode SS | |||
|---|---|---|---|
| Quadrant | BADHDUFLAG | Total packets | Discarded packets |
| A | 0 | 148 | 0 |
| B | 0 | 148 | 0 |
| C | 0 | 148 | 0 |
| D | 0 | 148 | 0 |
| Mode M9 | |||
|---|---|---|---|
| Quadrant | BADHDUFLAG | Total packets | Discarded packets |
| A | 0 | 6 | 0 |
| B | 0 | 6 | 0 |
| C | 0 | 6 | 0 |
| D | 0 | 7 | 0 |
| Mode M0 | |||
|---|---|---|---|
| Quadrant | BADHDUFLAG | Total packets | Discarded packets |
| A | 0 | 17037 | 3 |
| B | 0 | 15707 | 2 |
| C | 0 | 15827 | 2 |
| D | 0 | 17798 | 2 |
| Quadrant | Total seconds | Saturated seconds | Saturation percentage |
|---|---|---|---|
| A | 7279 | 234 | 3.214727% |
| B | 7279 | 166 | 2.280533% |
| C | 7279 | 172 | 2.362962% |
| D | 7279 | 180 | 2.472867% |
Noise dominated data is calculated using 1-second bins in cleaned event files. If a bin has >2000 counts, and if more than 50% of those come from <1% of pixels, then it is considered to be noise-dominated and hence unusable.
| Quadrant | # 1 sec bins | Bins with >0 counts | Bins with >2000 counts | High rate bins dominated by noise | Noise dominated (total time) | Noise dominated (detector-on time) | Marked lightcurve |
|---|---|---|---|---|---|---|---|
| A | 7650 | 7281 | 36 | 36 | 0.47% | 0.49% | 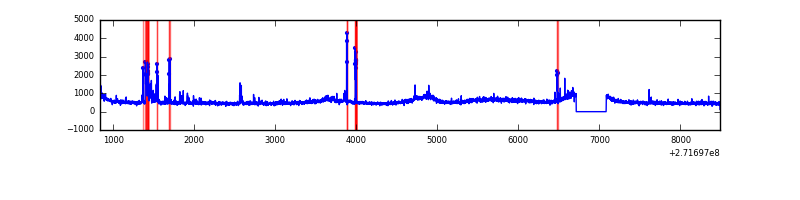 |
| B | 7650 | 7280 | 6 | 6 | 0.08% | 0.08% | 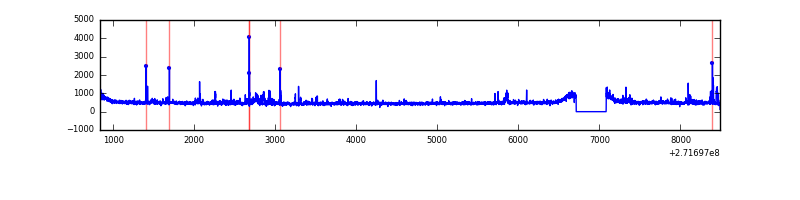 |
| C | 7650 | 7281 | 0 | 0 | 0.00% | 0.00% | 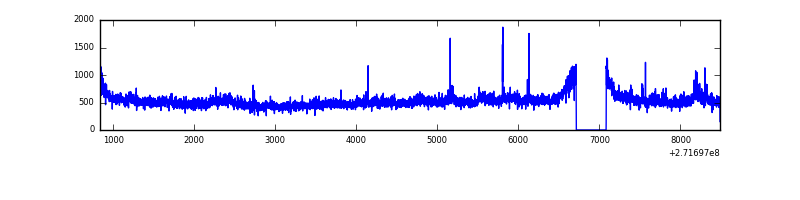 |
| D | 7650 | 7280 | 48 | 48 | 0.63% | 0.66% |  |
Top three noisy pixels from each quadrant. If the there are fewer than three noisy pixels in the level2.evt file, extra rows are filled as -1
| Pixel properties | Quadrant properties | ||||||
|---|---|---|---|---|---|---|---|
| Quadrant | DetID | PixID | Counts | Sigma | Mean | Median | Sigma |
| A | 0 | 253 | 501883 | 2797.97 | 885 | 866 | 179.1 |
| A | 14 | 238 | 142493 | 790.93 | 885 | 866 | 179.1 |
| A | 14 | 237 | 78384 | 432.91 | 885 | 866 | 179.1 |
| B | 0 | 189 | 53133 | 310.96 | 884 | 860 | 168.1 |
| B | 4 | 216 | 39186 | 227.99 | 884 | 860 | 168.1 |
| B | 4 | 142 | 38592 | 224.46 | 884 | 860 | 168.1 |
| C | 3 | 233 | 393010 | 1997.1 | 849 | 854 | 196.4 |
| C | 14 | 238 | 130284 | 659.14 | 849 | 854 | 196.4 |
| C | 0 | 207 | 17463 | 84.58 | 849 | 854 | 196.4 |
| D | 5 | 222 | 916149 | 4325.71 | 865 | 839 | 211.6 |
| D | 7 | 38 | 78412 | 366.61 | 865 | 839 | 211.6 |
| D | 2 | 234 | 31505 | 144.93 | 865 | 839 | 211.6 |
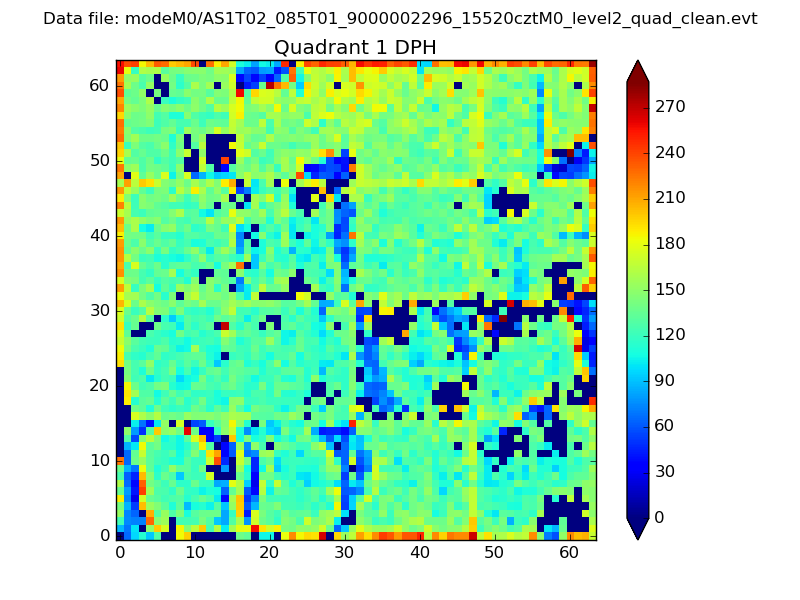
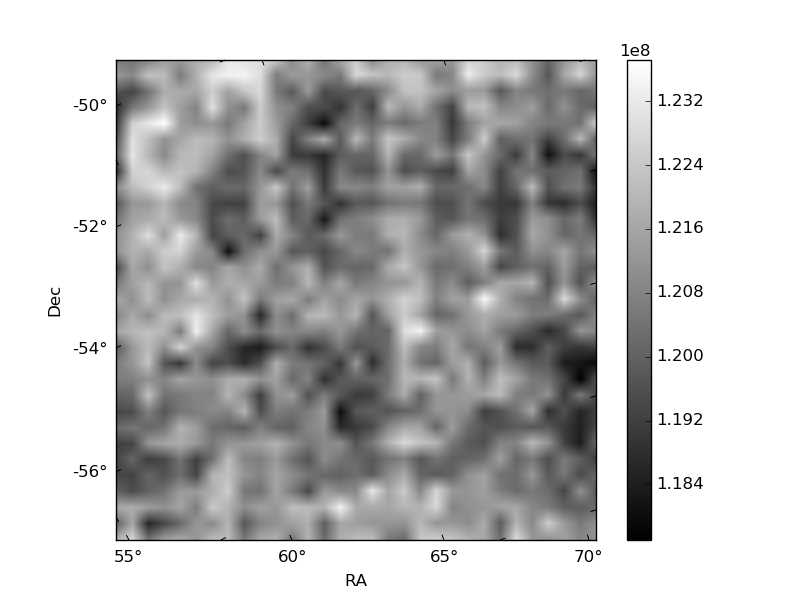
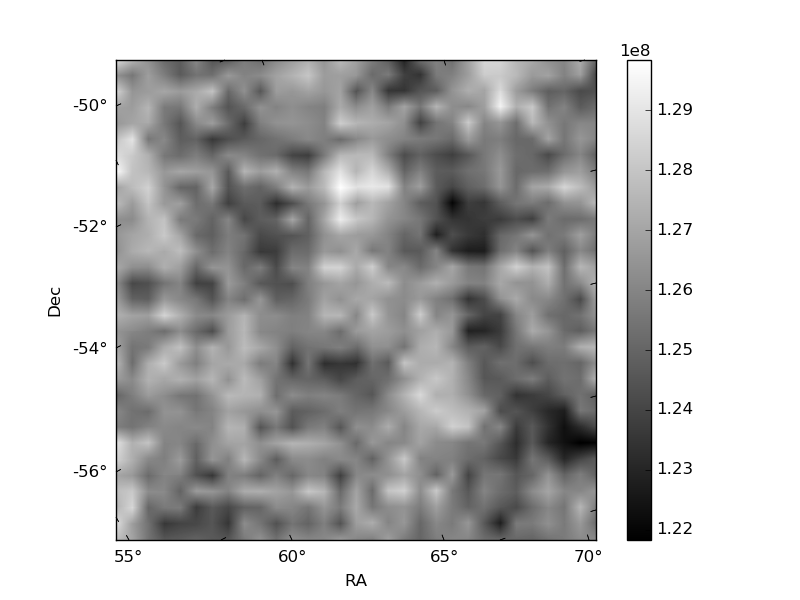
Histogram calculated using DETX and DETY for each event in the final _common_clean file
| Quadrant A |  |
 |
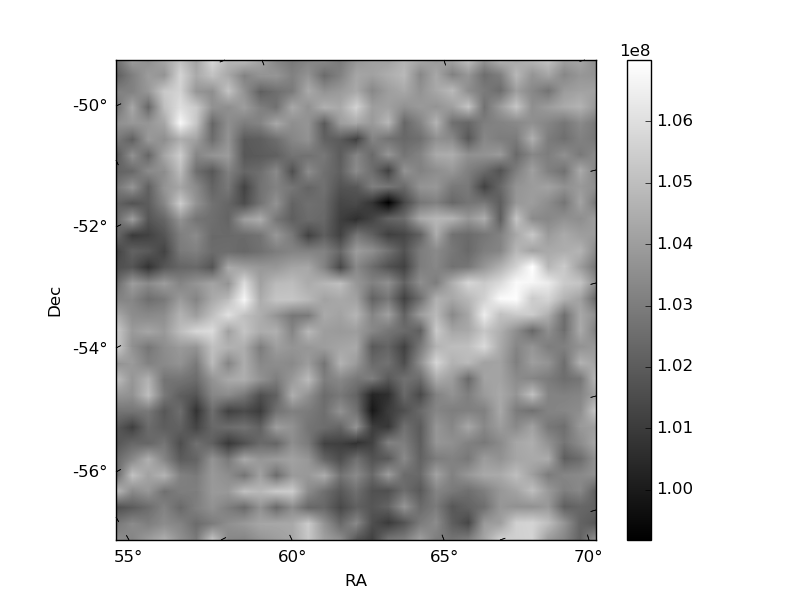
Quadrant B |
|---|---|---|---|
| Quadrant D |  |
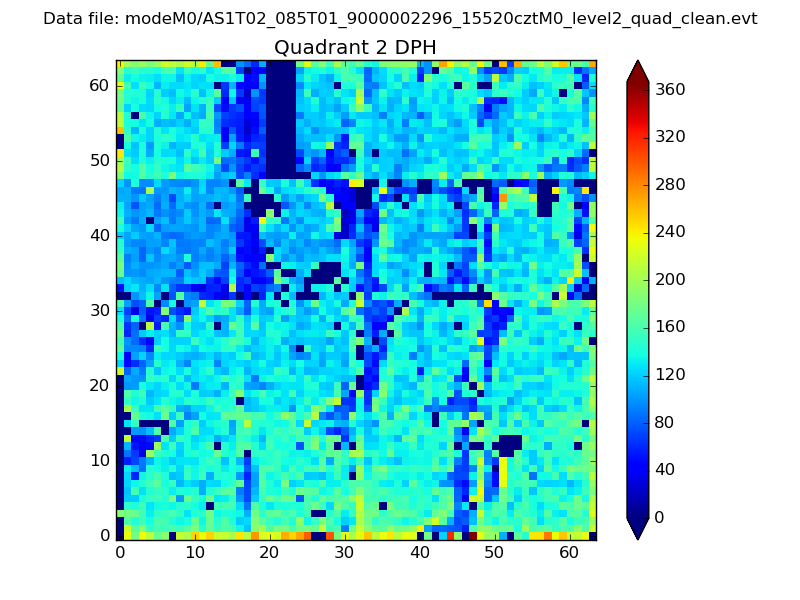 |
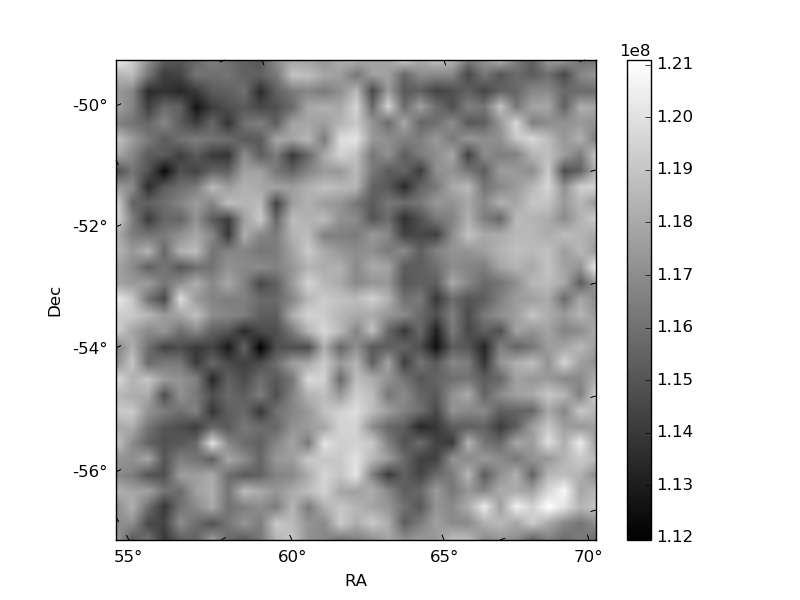
Quadrant C |
| Plot type | Count rate plots | Images |
|---|---|---|
| Comparison with Poisson distribution Blue bars denote a histogram of data divided into 1 sec bins. Red curve is a Poisson curve with rate = median count rate of data. |
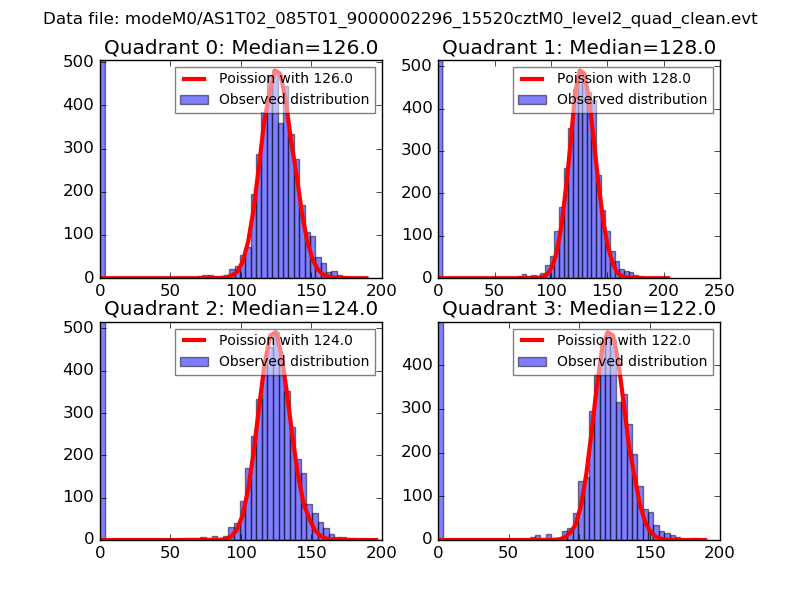 |
 |
| Quadrant-wise count rates Data is divided into 100 sec bins |
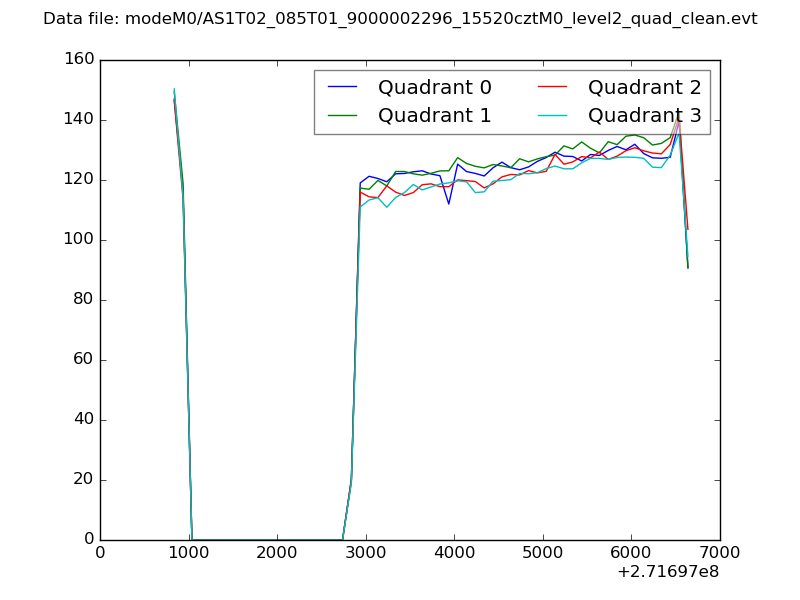 |
|
| Module-wise count rates for Quadrant A Data is divided into 100 sec bins |
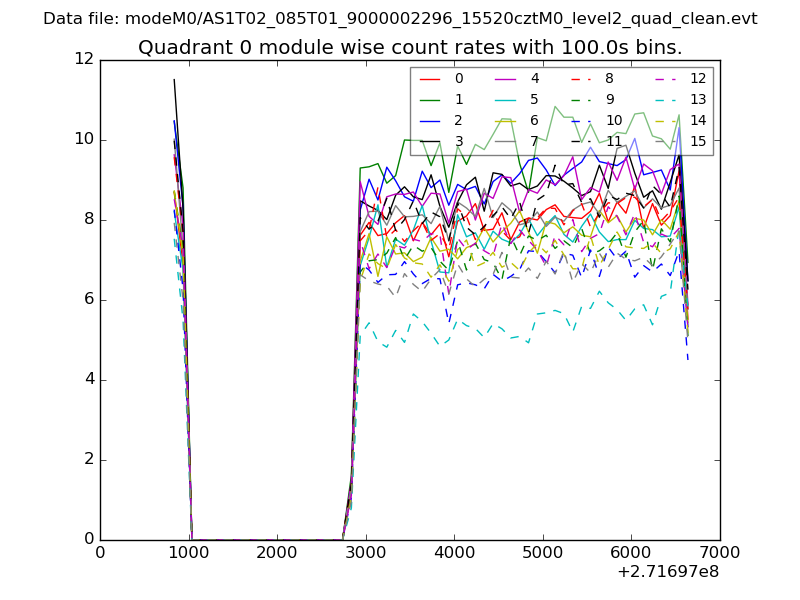 |
 |
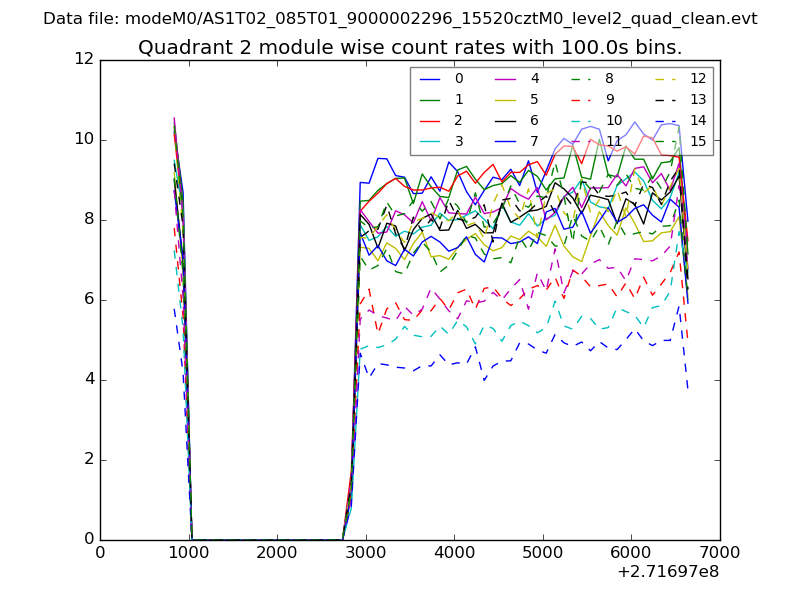
| Module-wise count rates for Quadrant B Data is divided into 100 sec bins |
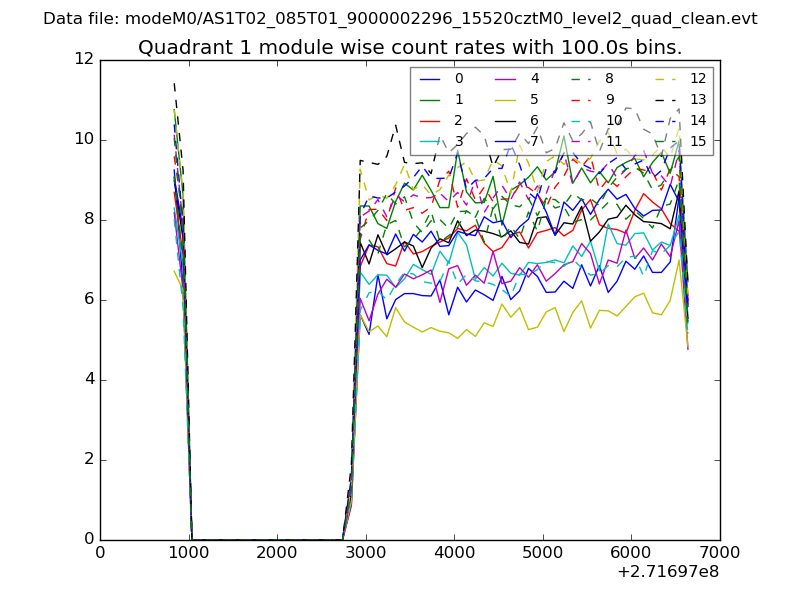 |
 |
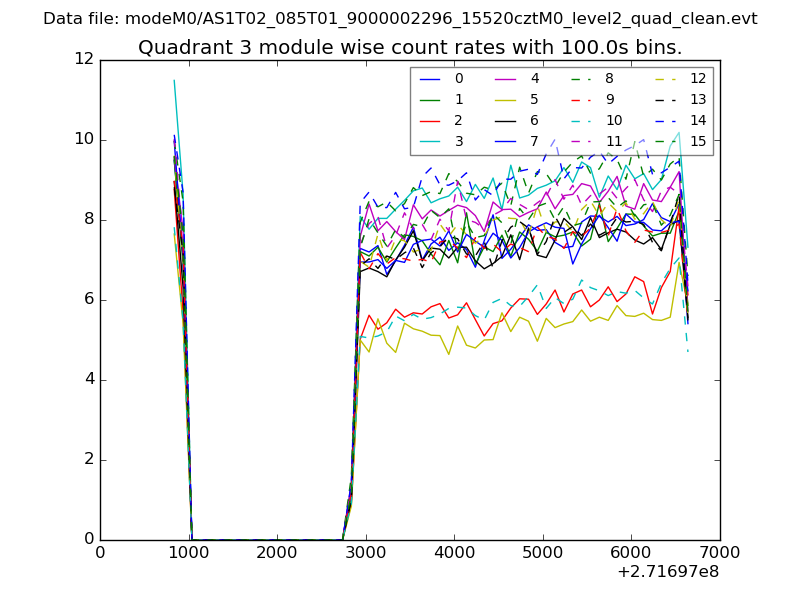
| Module-wise count rates for Quadrant C Data is divided into 100 sec bins |
 |
 |
| Module-wise count rates for Quadrant D Data is divided into 100 sec bins |
 |
 |
| Parameter | Plot |
|---|---|
| CZT HV Monitor | 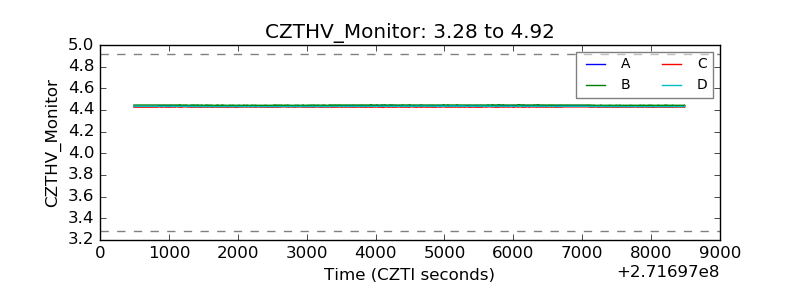 |
| D_VDD | 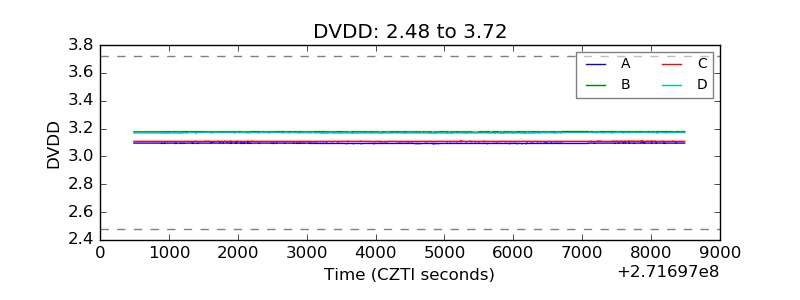 |
| Temperature 1 | 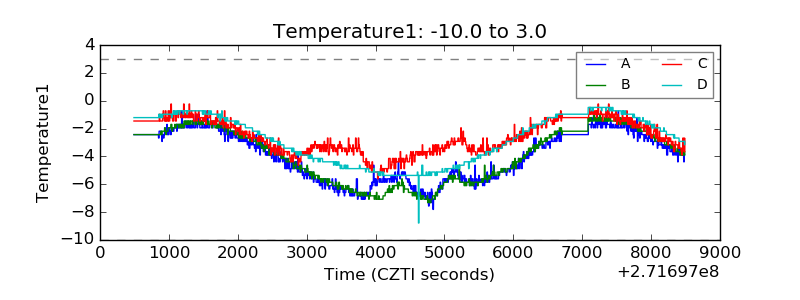 |
| Veto HV Monitor | 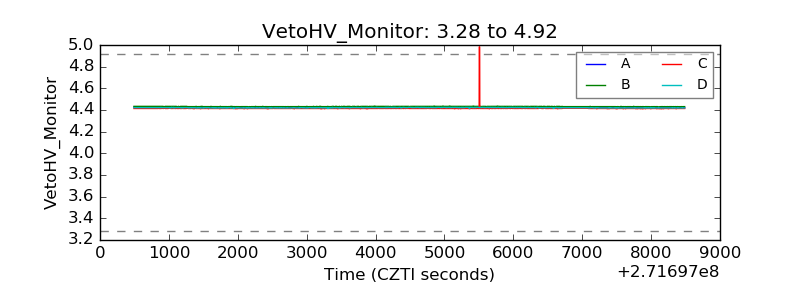 |
| Veto LLD | 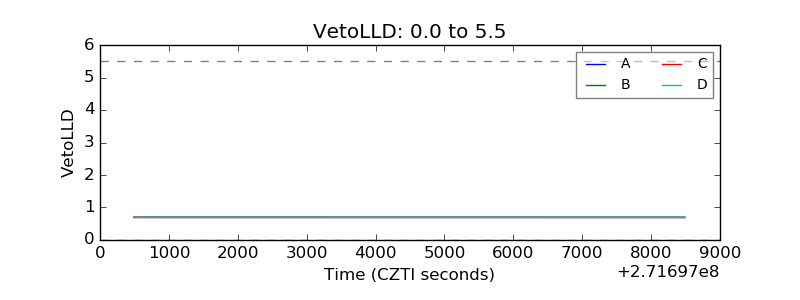 |
| Alpha Counter | 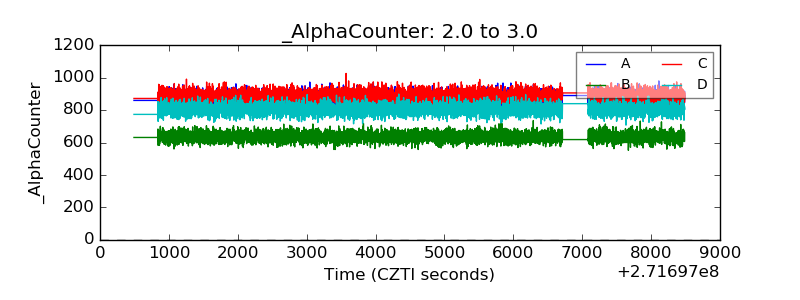 |
| _CPM_Rate | 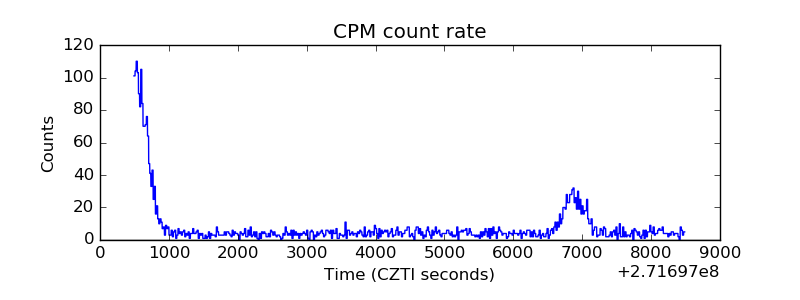 |
| CZT Counter | 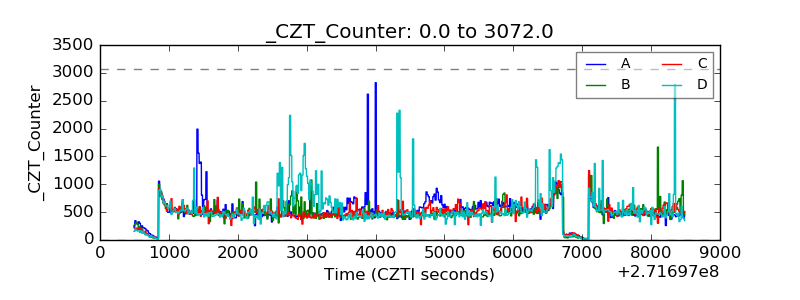 |
| +2.5 Volts monitor |  |
| +5 Volts monitor | 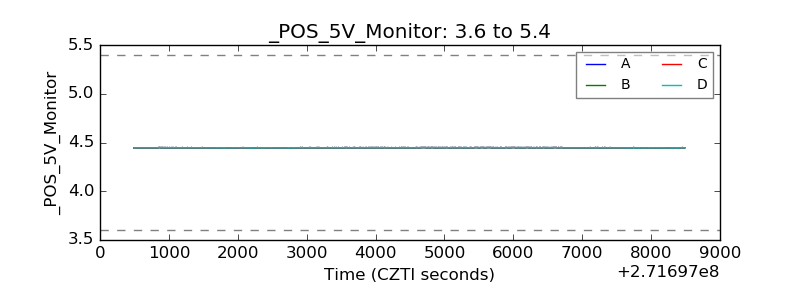 |
| _ROLL_ROT | 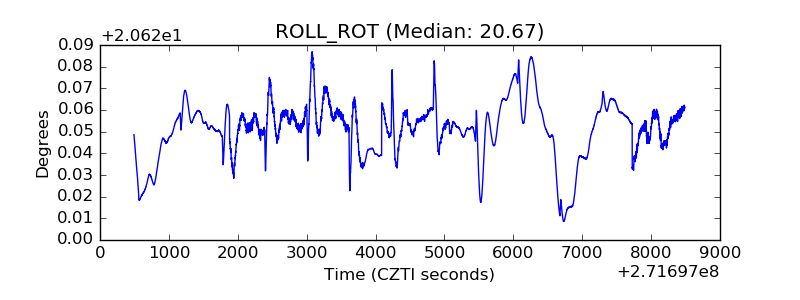 |
| _Roll_DEC | 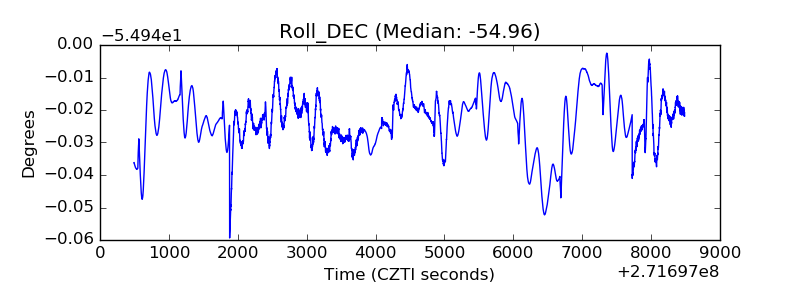 |
| _Roll_RA | 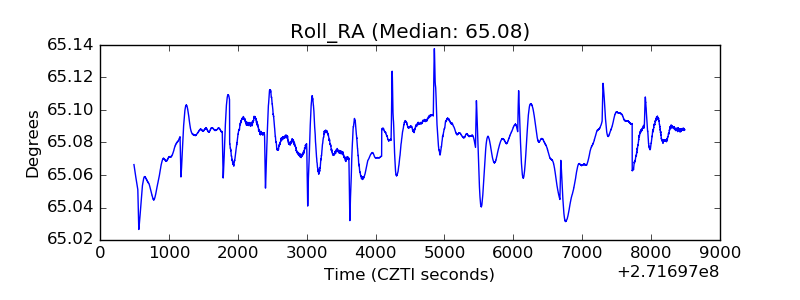 |
| Veto Counter | 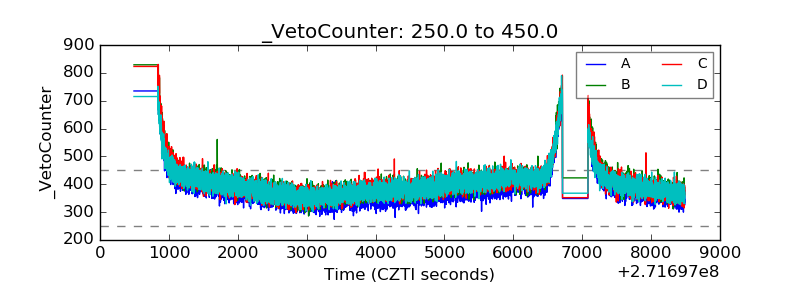 |