| Param | Original file | Final file |
|---|---|---|
| Filename | modeM0/AS1T02_085T01_9000002296_15521cztM0_level2.evt | modeM0/AS1T02_085T01_9000002296_15521cztM0_level2_quad_clean.evt |
| Size (bytes) | 569,004,480 | 85,789,440 |
| Size | 542.6 MB | 81.8 MB |
| Events in quadrant A | 3,963,307 | 522,083 |
| Events in quadrant B | 3,889,265 | 526,390 |
| Events in quadrant C | 4,158,079 | 509,300 |
| Events in quadrant D | 4,699,048 | 504,135 |
| Mode SS | |||
|---|---|---|---|
| Quadrant | BADHDUFLAG | Total packets | Discarded packets |
| A | 0 | 156 | 0 |
| B | 0 | 156 | 0 |
| C | 0 | 156 | 0 |
| D | 0 | 156 | 0 |
| Mode M9 | |||
|---|---|---|---|
| Quadrant | BADHDUFLAG | Total packets | Discarded packets |
| A | 0 | 3 | 0 |
| B | 0 | 3 | 0 |
| C | 0 | 3 | 0 |
| D | 0 | 4 | 0 |
| Mode M0 | |||
|---|---|---|---|
| Quadrant | BADHDUFLAG | Total packets | Discarded packets |
| A | 0 | 16629 | 3 |
| B | 0 | 16519 | 2 |
| C | 0 | 16911 | 2 |
| D | 0 | 19334 | 2 |
| Quadrant | Total seconds | Saturated seconds | Saturation percentage |
|---|---|---|---|
| A | 7706 | 195 | 2.530496% |
| B | 7706 | 225 | 2.919803% |
| C | 7706 | 195 | 2.530496% |
| D | 7706 | 215 | 2.790034% |
Noise dominated data is calculated using 1-second bins in cleaned event files. If a bin has >2000 counts, and if more than 50% of those come from <1% of pixels, then it is considered to be noise-dominated and hence unusable.
| Quadrant | # 1 sec bins | Bins with >0 counts | Bins with >2000 counts | High rate bins dominated by noise | Noise dominated (total time) | Noise dominated (detector-on time) | Marked lightcurve |
|---|---|---|---|---|---|---|---|
| A | 7837 | 7707 | 3 | 3 | 0.04% | 0.04% | 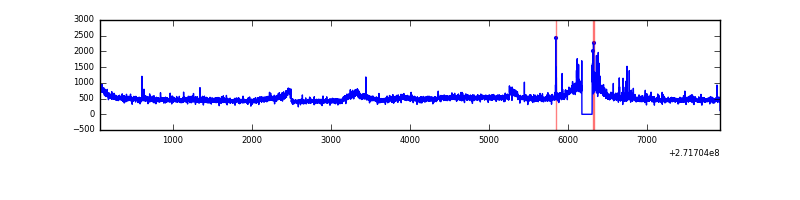 |
| B | 7837 | 7708 | 10 | 10 | 0.13% | 0.13% | 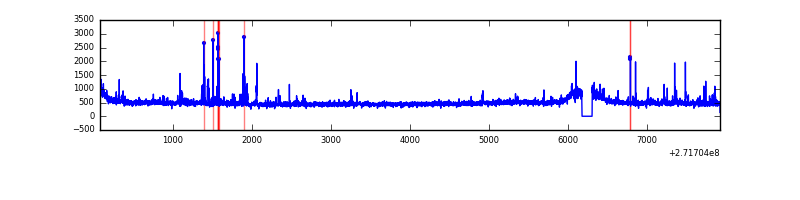 |
| C | 7837 | 7708 | 0 | 0 | 0.00% | 0.00% | 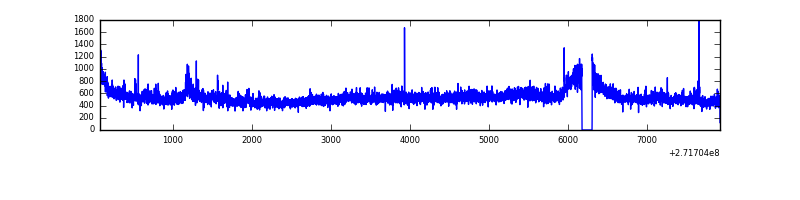 |
| D | 7837 | 7708 | 102 | 102 | 1.30% | 1.32% | 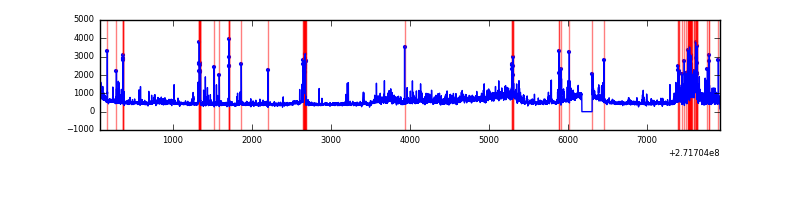 |
Top three noisy pixels from each quadrant. If the there are fewer than three noisy pixels in the level2.evt file, extra rows are filled as -1
| Pixel properties | Quadrant properties | ||||||
|---|---|---|---|---|---|---|---|
| Quadrant | DetID | PixID | Counts | Sigma | Mean | Median | Sigma |
| A | 0 | 253 | 271282 | 1427.01 | 931 | 910 | 189.5 |
| A | 14 | 238 | 88095 | 460.16 | 931 | 910 | 189.5 |
| A | 14 | 237 | 15726 | 78.2 | 931 | 910 | 189.5 |
| B | 4 | 142 | 75957 | 423.79 | 929 | 904 | 177.1 |
| B | 0 | 189 | 38890 | 214.49 | 929 | 904 | 177.1 |
| B | 0 | 197 | 28362 | 155.04 | 929 | 904 | 177.1 |
| C | 3 | 233 | 532202 | 2562.13 | 888 | 893 | 207.4 |
| C | 14 | 238 | 135304 | 648.17 | 888 | 893 | 207.4 |
| C | 0 | 207 | 9530 | 41.65 | 888 | 893 | 207.4 |
| D | 5 | 222 | 913363 | 4057.46 | 905 | 875 | 224.9 |
| D | 7 | 38 | 213206 | 944.15 | 905 | 875 | 224.9 |
| D | 12 | 221 | 74777 | 328.61 | 905 | 875 | 224.9 |
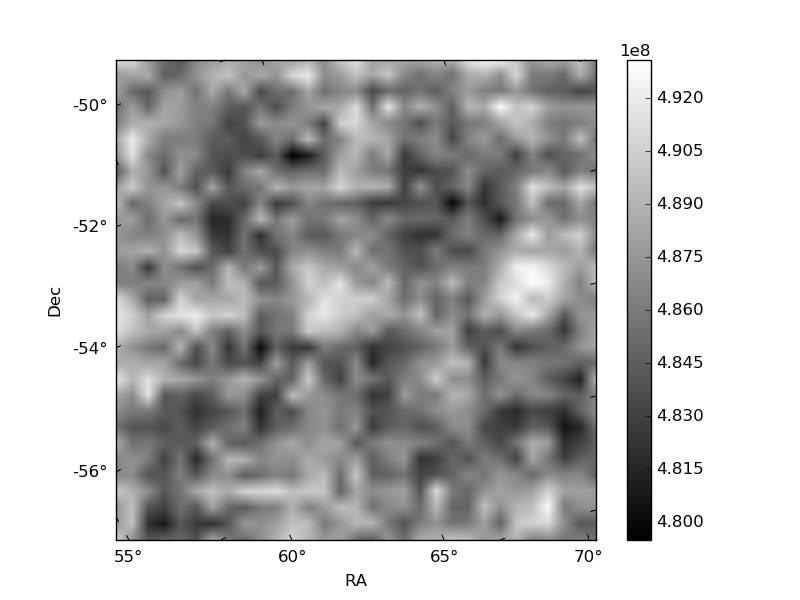
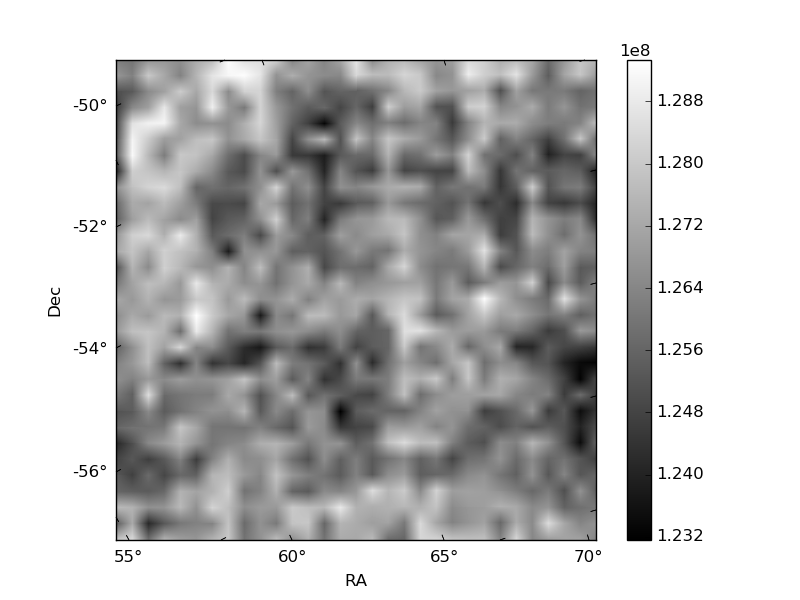
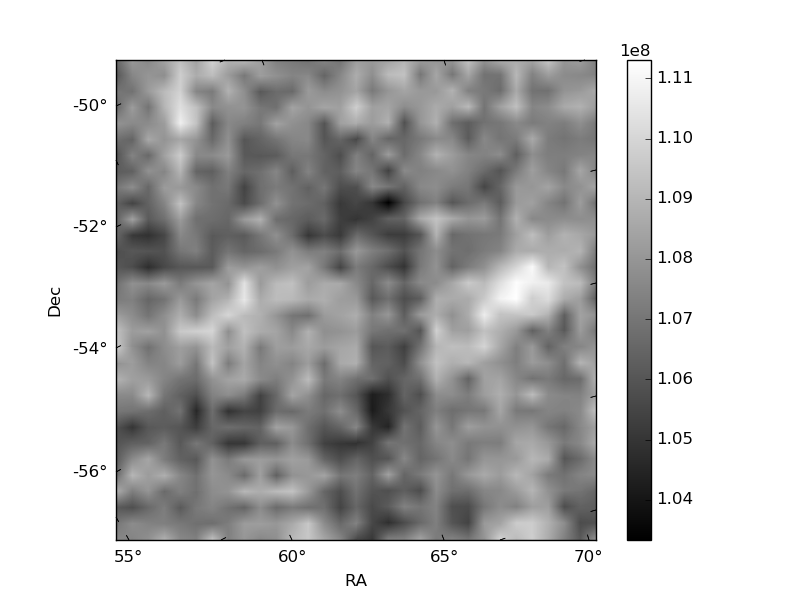
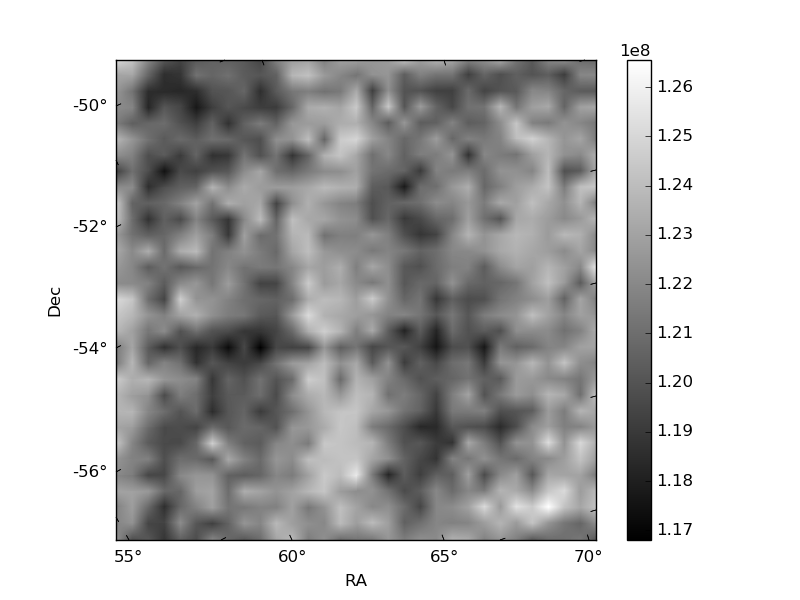
Histogram calculated using DETX and DETY for each event in the final _common_clean file
| Quadrant A | 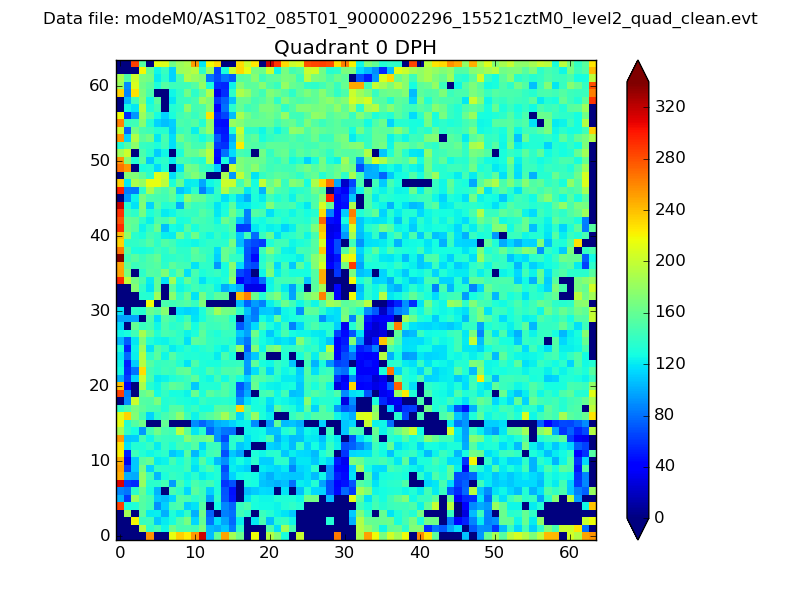 |
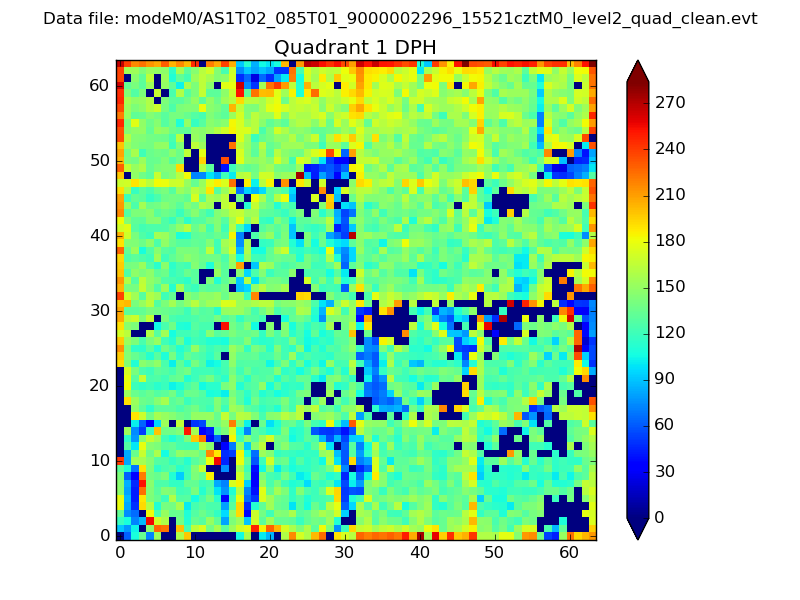 |
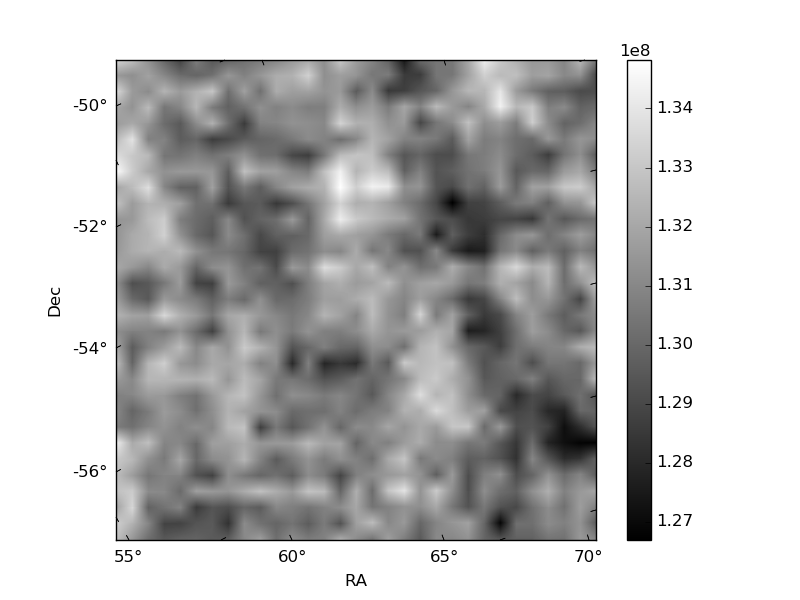
Quadrant B |
|---|---|---|---|
| Quadrant D | 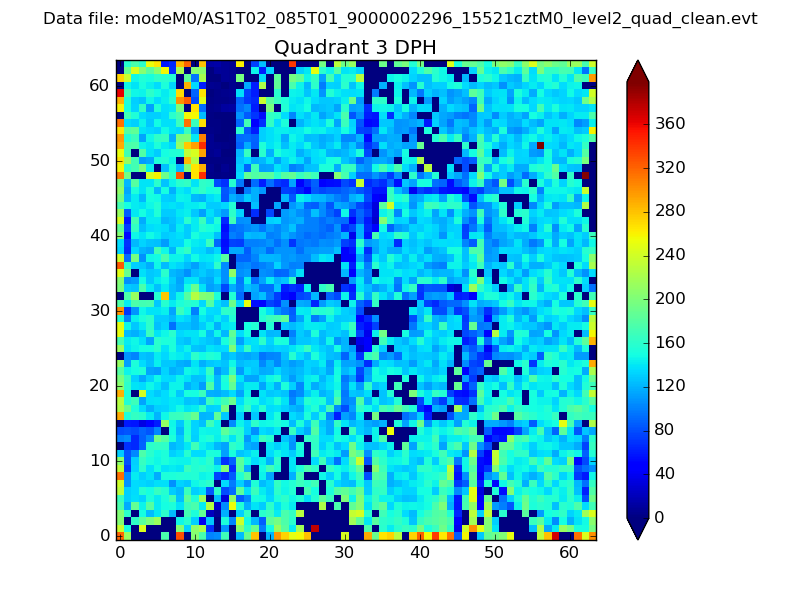 |
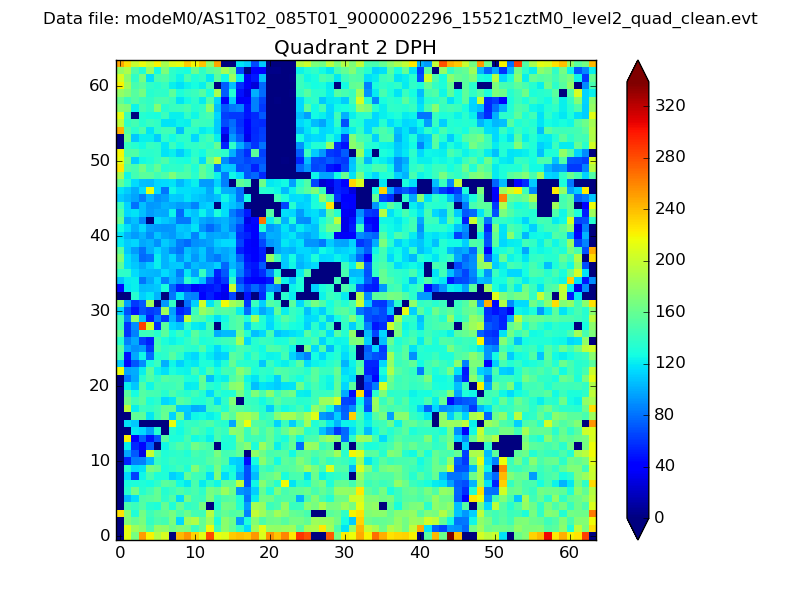 |
Quadrant C |
| Plot type | Count rate plots | Images |
|---|---|---|
| Comparison with Poisson distribution Blue bars denote a histogram of data divided into 1 sec bins. Red curve is a Poisson curve with rate = median count rate of data. |
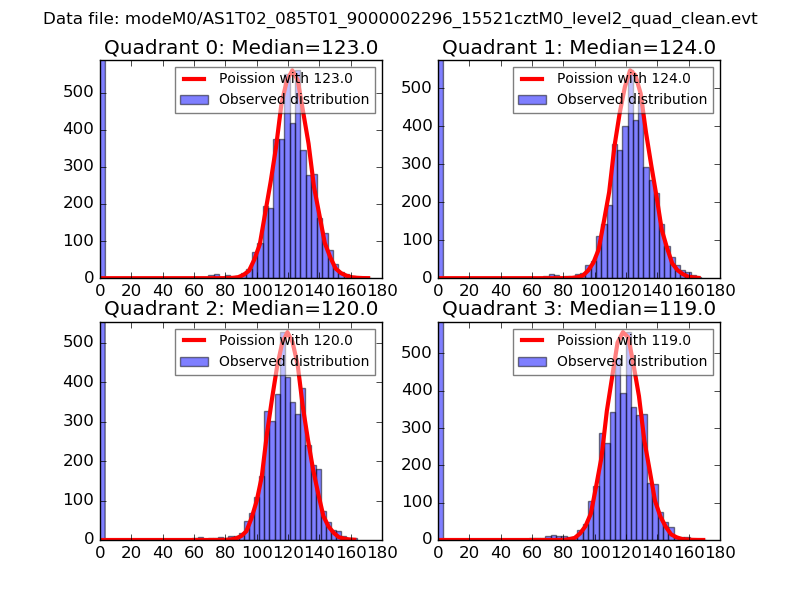 |
 |
| Quadrant-wise count rates Data is divided into 100 sec bins |
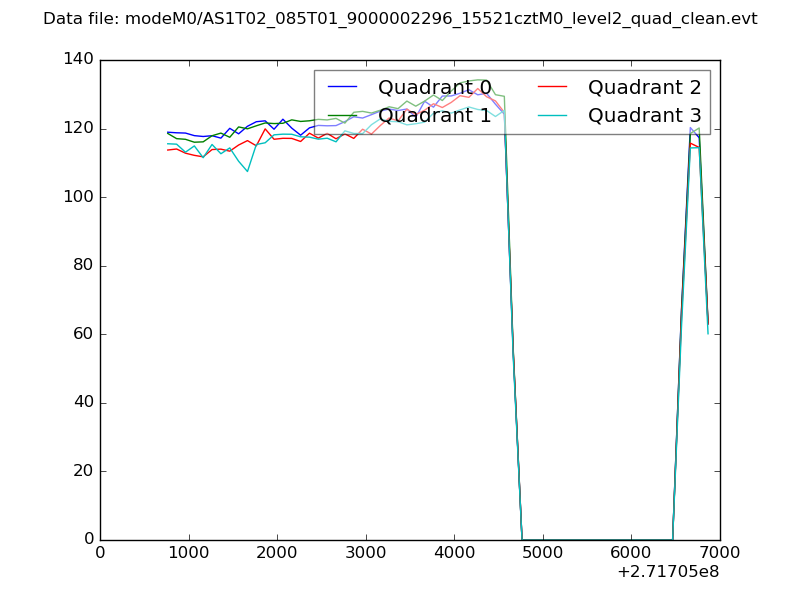 |
|
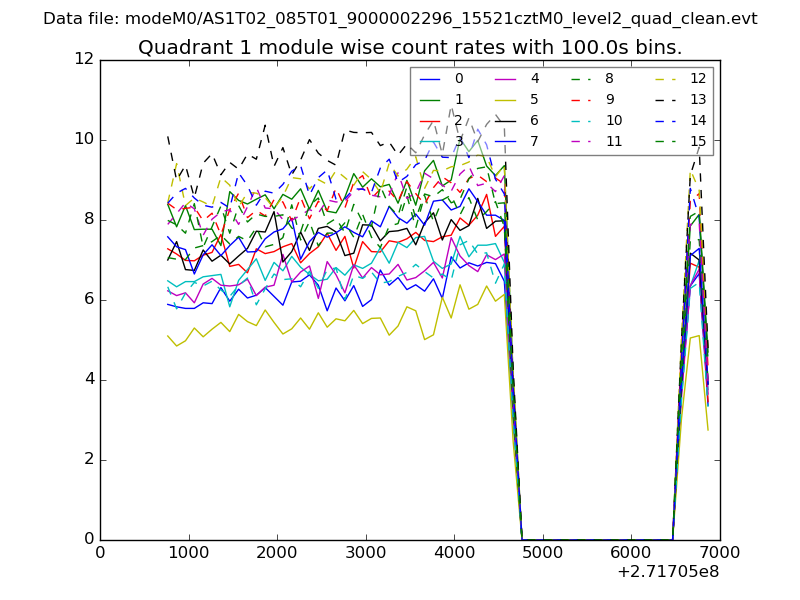
| Module-wise count rates for Quadrant A Data is divided into 100 sec bins |
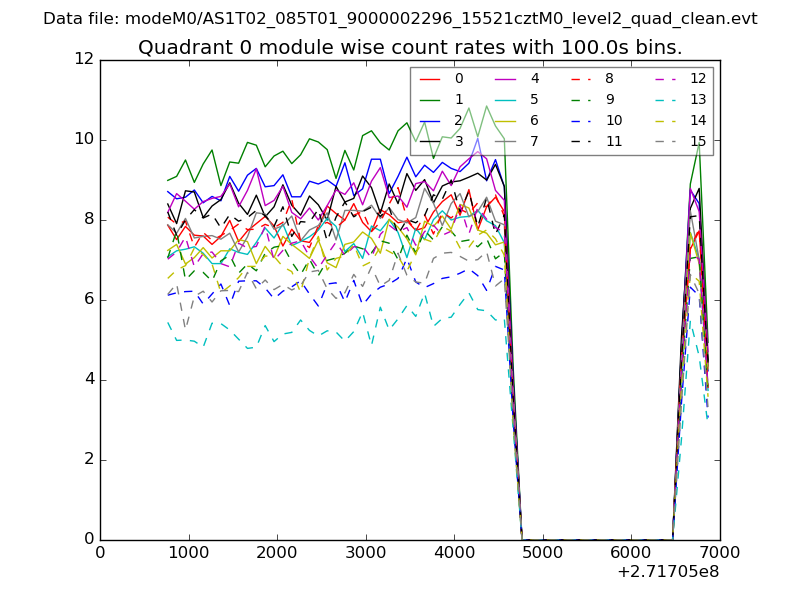 |
 |
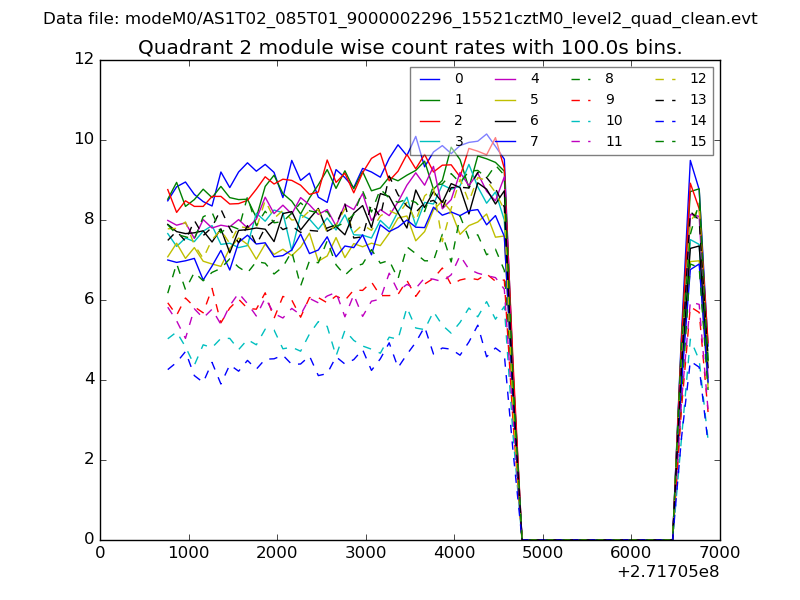
| Module-wise count rates for Quadrant B Data is divided into 100 sec bins |
 |
 |
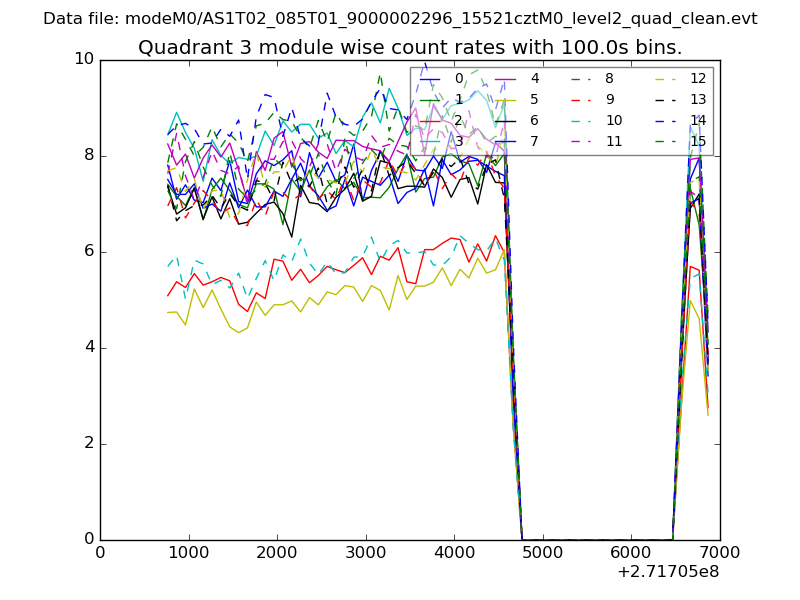
| Module-wise count rates for Quadrant C Data is divided into 100 sec bins |
 |
 |
| Module-wise count rates for Quadrant D Data is divided into 100 sec bins |
 |
 |
| Parameter | Plot |
|---|---|
| CZT HV Monitor | 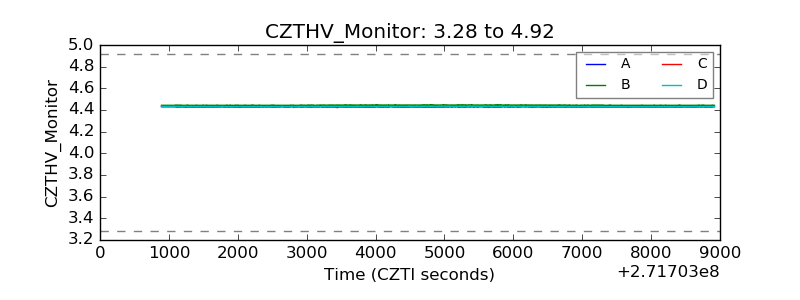 |
| D_VDD | 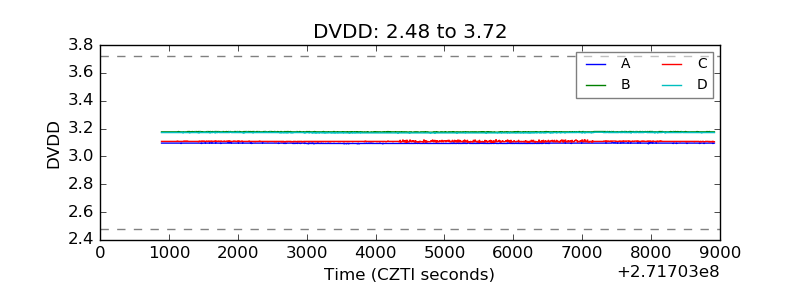 |
| Temperature 1 | 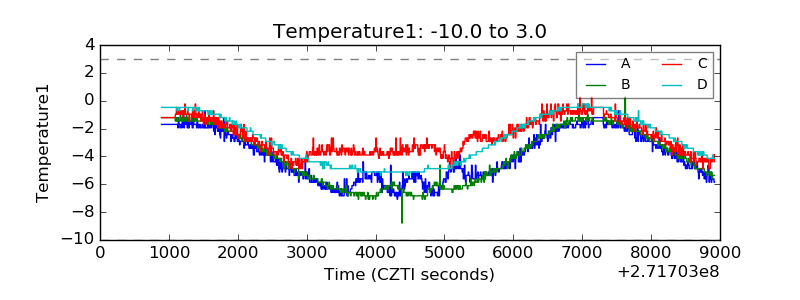 |
| Veto HV Monitor | 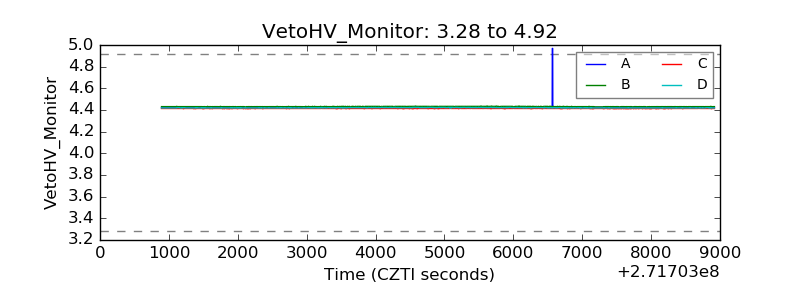 |
| Veto LLD | 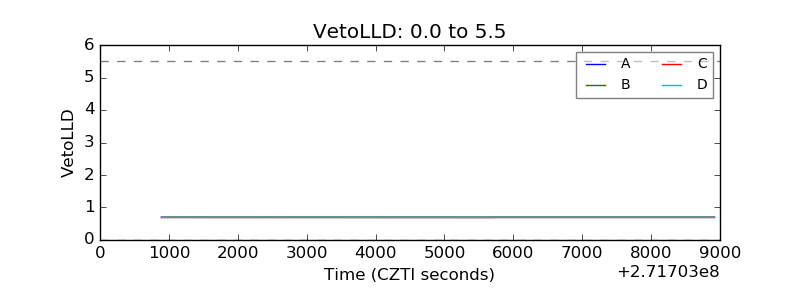 |
| Alpha Counter | 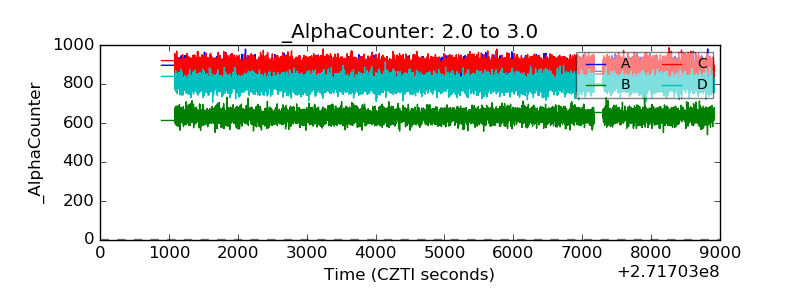 |
| _CPM_Rate | 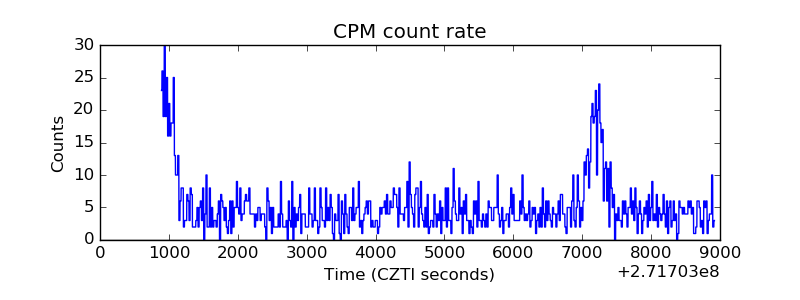 |
| CZT Counter | 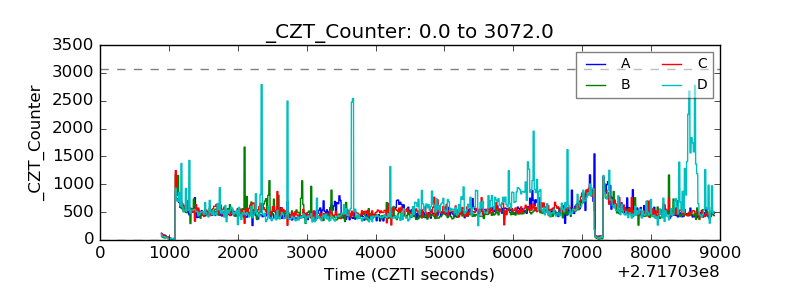 |
| +2.5 Volts monitor |  |
| +5 Volts monitor |  |
| _ROLL_ROT | 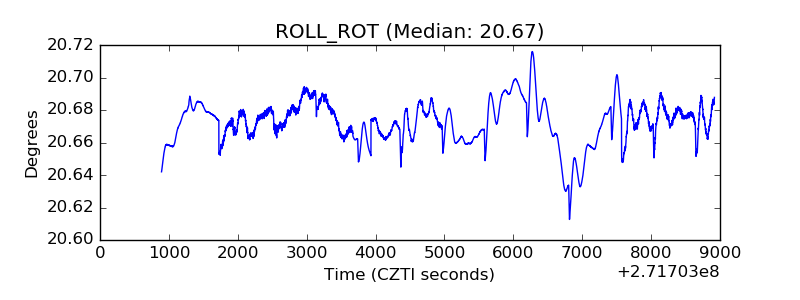 |
| _Roll_DEC | 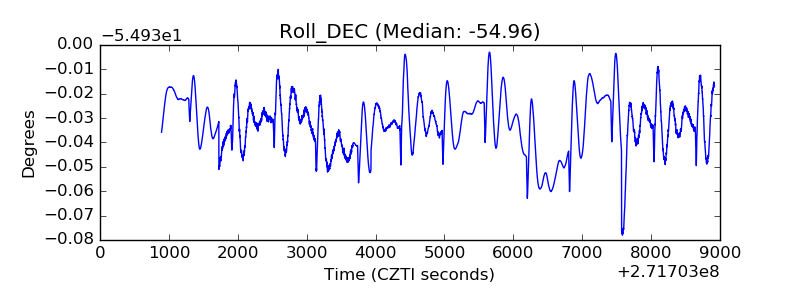 |
| _Roll_RA | 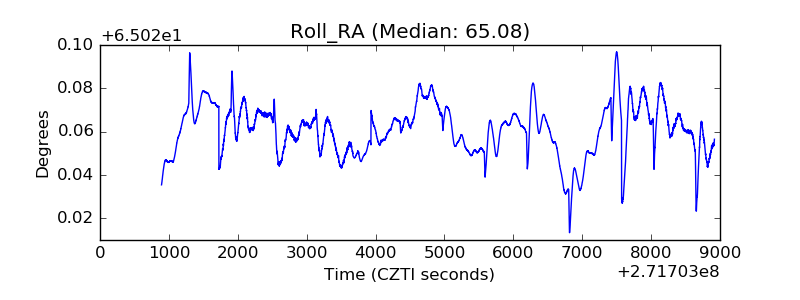 |
| Veto Counter | 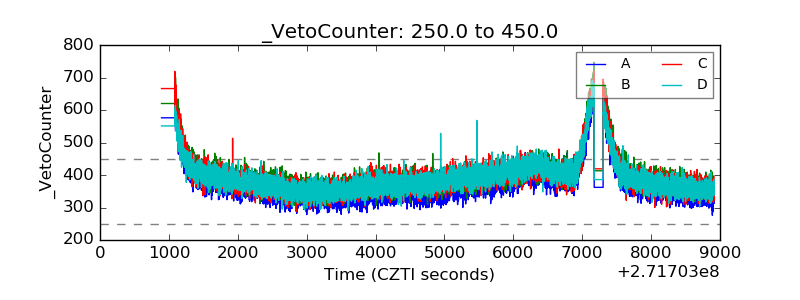 |