| Param | Original file | Final file |
|---|---|---|
| Filename | modeM0/AS1T02_085T01_9000002296_15522cztM0_level2.evt | modeM0/AS1T02_085T01_9000002296_15522cztM0_level2_quad_clean.evt |
| Size (bytes) | 142,548,480 | 19,912,320 |
| Size | 135.9 MB | 19.0 MB |
| Events in quadrant A | 987,478 | 115,979 |
| Events in quadrant B | 952,370 | 116,378 |
| Events in quadrant C | 971,154 | 112,441 |
| Events in quadrant D | 1,266,747 | 111,222 |
| Mode SS | |||
|---|---|---|---|
| Quadrant | BADHDUFLAG | Total packets | Discarded packets |
| A | 0 | 42 | 0 |
| B | 0 | 42 | 0 |
| C | 0 | 42 | 0 |
| D | 0 | 42 | 0 |
| Mode M0 | |||
|---|---|---|---|
| Quadrant | BADHDUFLAG | Total packets | Discarded packets |
| A | 0 | 4145 | 0 |
| B | 0 | 4137 | 0 |
| C | 0 | 4111 | 0 |
| D | 0 | 5106 | 0 |
| Quadrant | Total seconds | Saturated seconds | Saturation percentage |
|---|---|---|---|
| A | 2007 | 3 | 0.149477% |
| B | 2007 | 8 | 0.398605% |
| C | 2007 | 2 | 0.099651% |
| D | 2007 | 47 | 2.341804% |
Noise dominated data is calculated using 1-second bins in cleaned event files. If a bin has >2000 counts, and if more than 50% of those come from <1% of pixels, then it is considered to be noise-dominated and hence unusable.
| Quadrant | # 1 sec bins | Bins with >0 counts | Bins with >2000 counts | High rate bins dominated by noise | Noise dominated (total time) | Noise dominated (detector-on time) | Marked lightcurve |
|---|---|---|---|---|---|---|---|
| A | 2008 | 2008 | 0 | 0 | 0.00% | 0.00% | 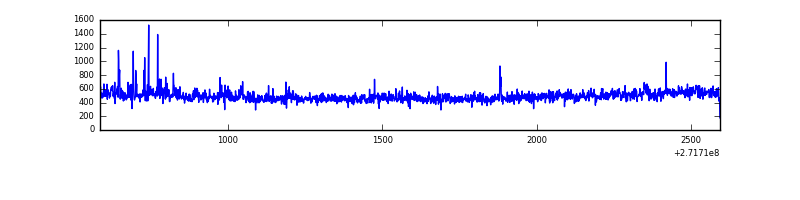 |
| B | 2008 | 2008 | 2 | 2 | 0.10% | 0.10% | 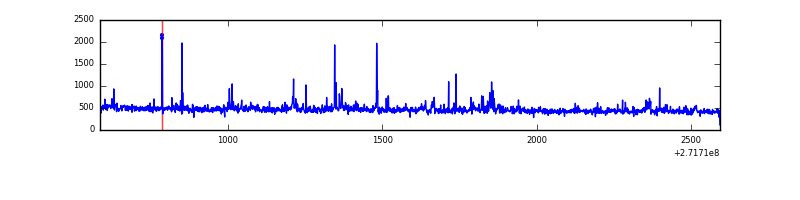 |
| C | 2008 | 2008 | 0 | 0 | 0.00% | 0.00% | 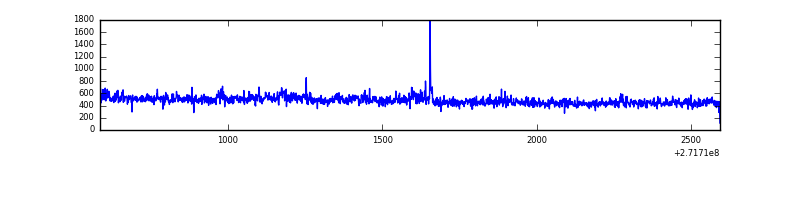 |
| D | 2008 | 2008 | 49 | 49 | 2.44% | 2.44% | 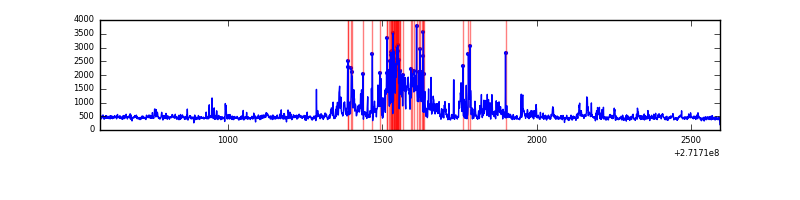 |
Top three noisy pixels from each quadrant. If the there are fewer than three noisy pixels in the level2.evt file, extra rows are filled as -1
| Pixel properties | Quadrant properties | ||||||
|---|---|---|---|---|---|---|---|
| Quadrant | DetID | PixID | Counts | Sigma | Mean | Median | Sigma |
| A | 0 | 253 | 96081 | 1997.92 | 225 | 220 | 48.0 |
| A | 14 | 238 | 16399 | 337.2 | 225 | 220 | 48.0 |
| A | 14 | 237 | 4584 | 90.95 | 225 | 220 | 48.0 |
| B | 0 | 197 | 13259 | 290.14 | 226 | 220 | 44.9 |
| B | 0 | 190 | 13108 | 286.78 | 226 | 220 | 44.9 |
| B | 4 | 142 | 12287 | 268.51 | 226 | 220 | 44.9 |
| C | 3 | 233 | 110079 | 2150.57 | 212 | 213 | 51.1 |
| C | 14 | 238 | 32571 | 633.39 | 212 | 213 | 51.1 |
| C | 13 | 61 | 1557 | 26.31 | 212 | 213 | 51.1 |
| D | 5 | 222 | 322176 | 5938.07 | 214 | 207 | 54.2 |
| D | 7 | 38 | 81238 | 1494.45 | 214 | 207 | 54.2 |
| D | 12 | 221 | 39941 | 732.81 | 214 | 207 | 54.2 |
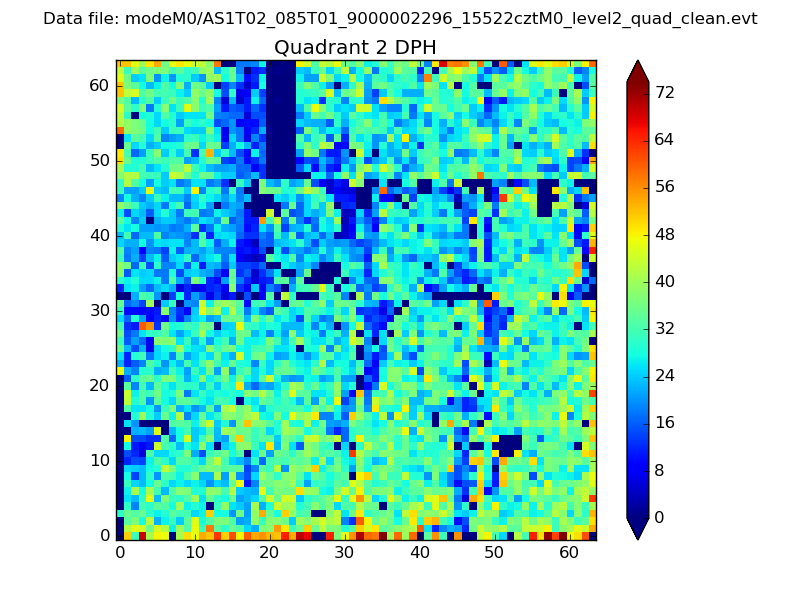
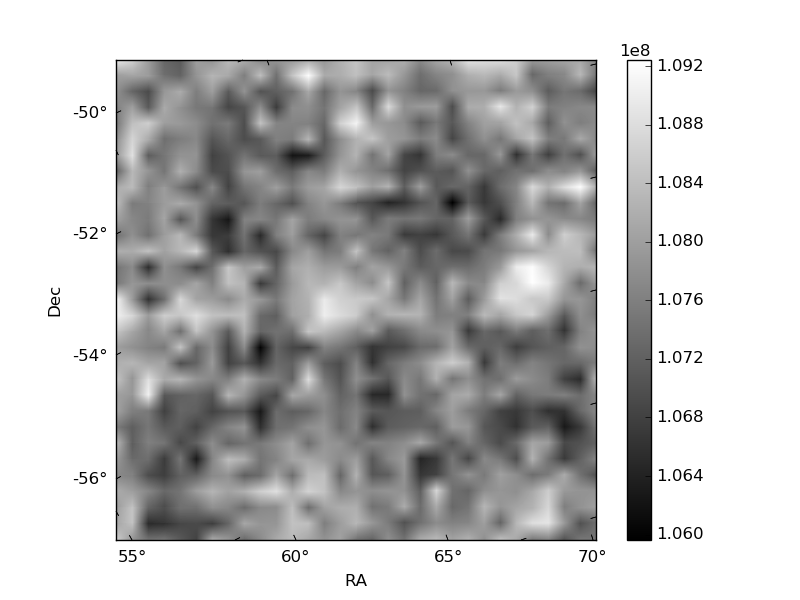
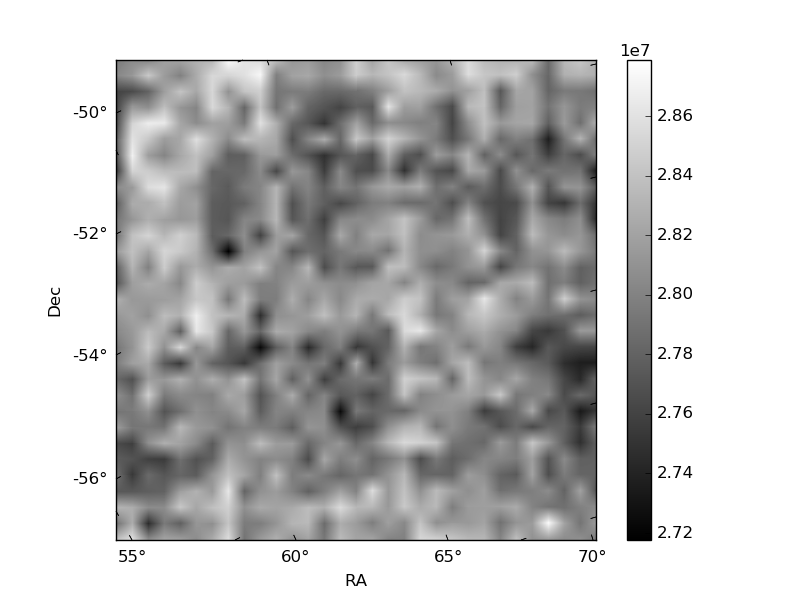
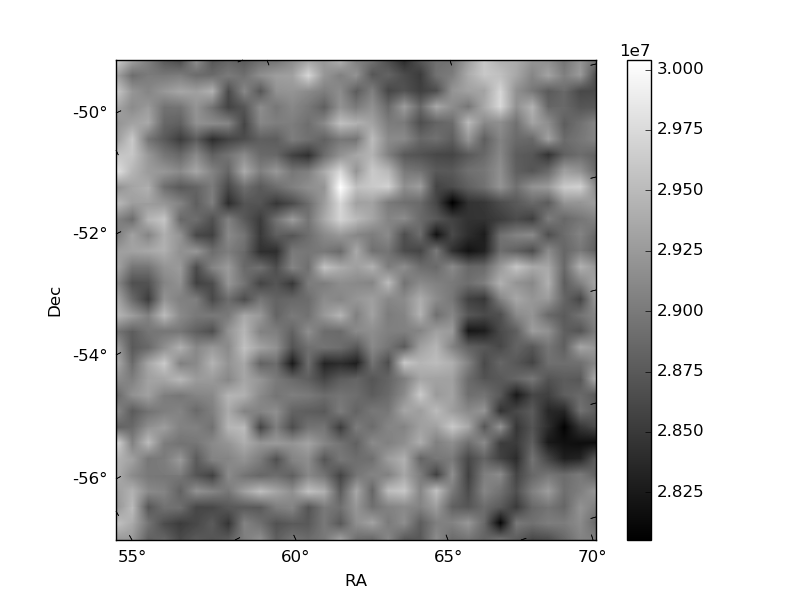
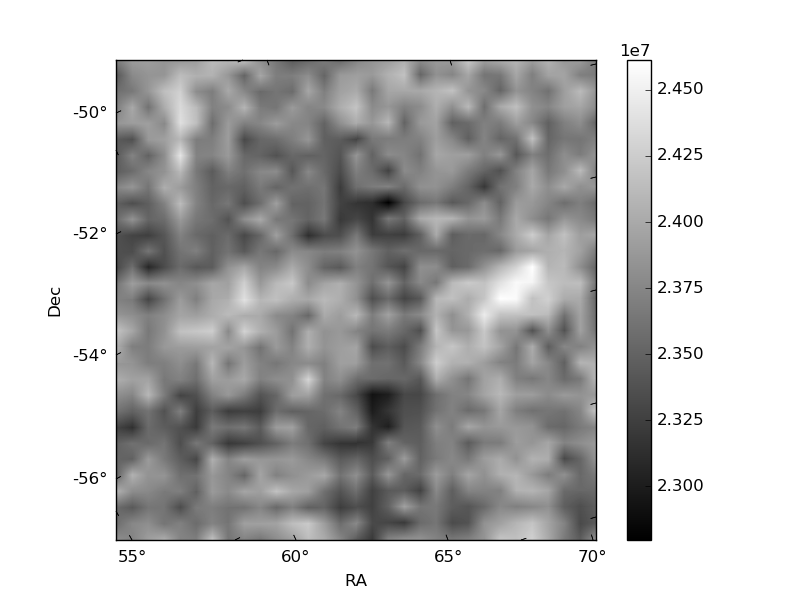
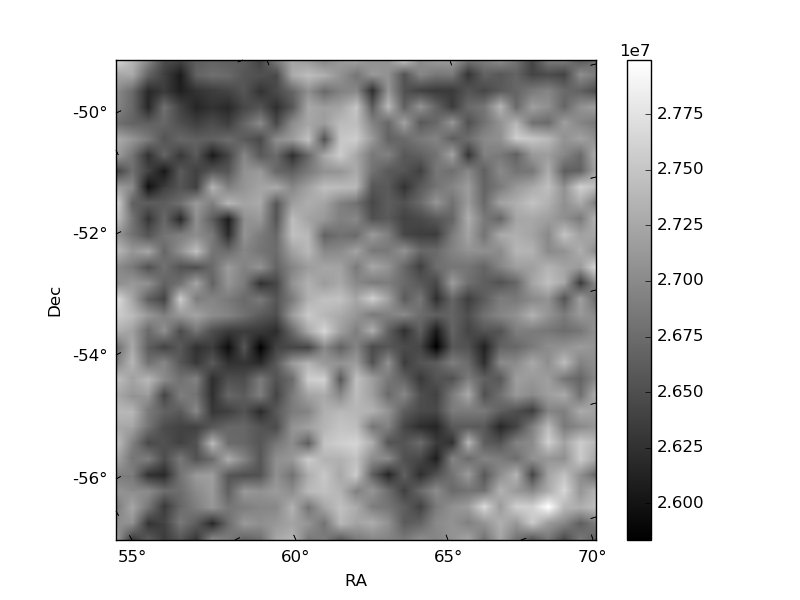
Histogram calculated using DETX and DETY for each event in the final _common_clean file
| Quadrant A | 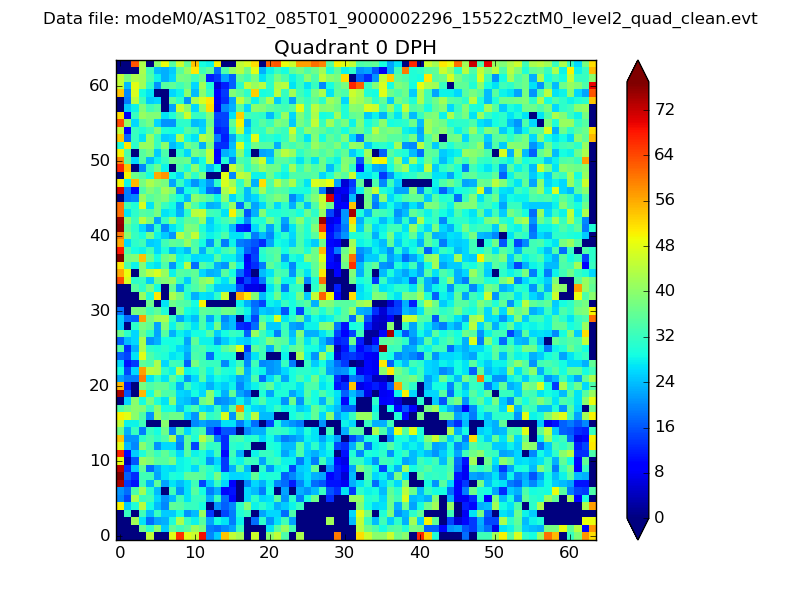 |
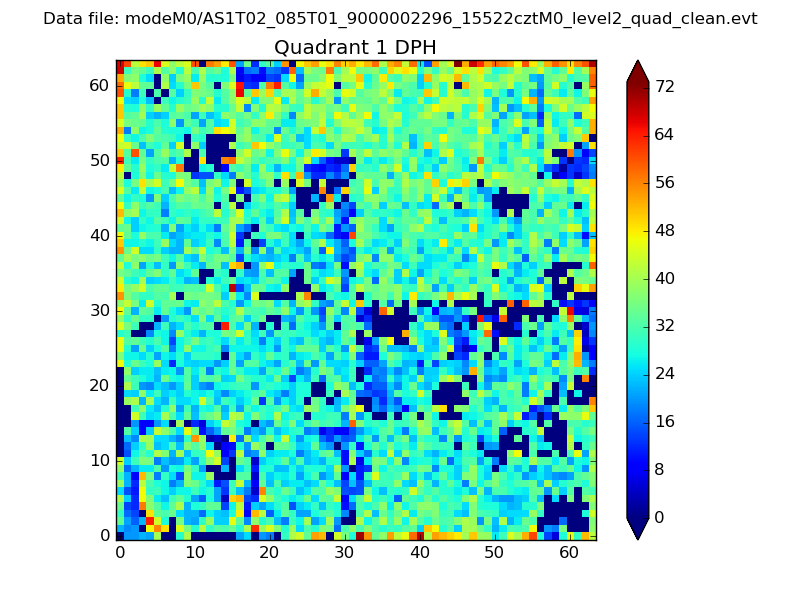 |
Quadrant B |
|---|---|---|---|
| Quadrant D | 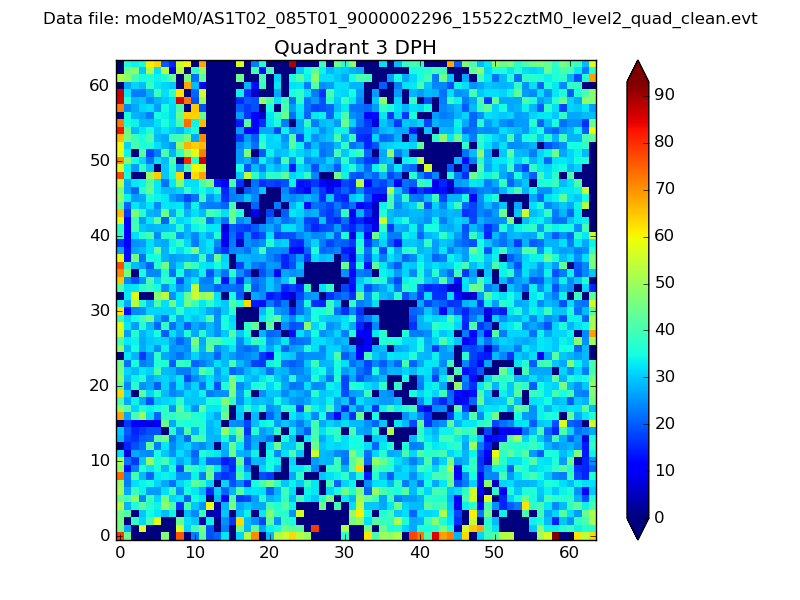 |
 |
Quadrant C |
| Plot type | Count rate plots | Images |
|---|---|---|
| Comparison with Poisson distribution Blue bars denote a histogram of data divided into 1 sec bins. Red curve is a Poisson curve with rate = median count rate of data. |
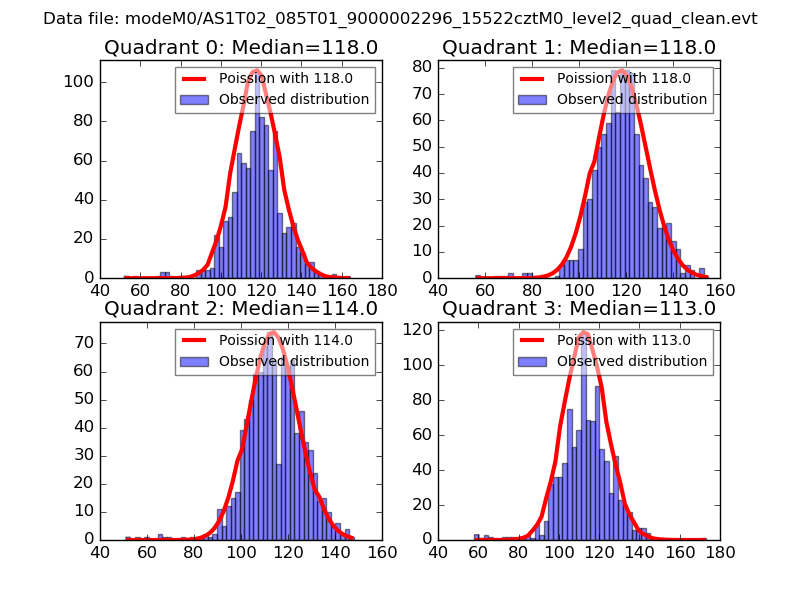 |
 |
| Quadrant-wise count rates Data is divided into 100 sec bins |
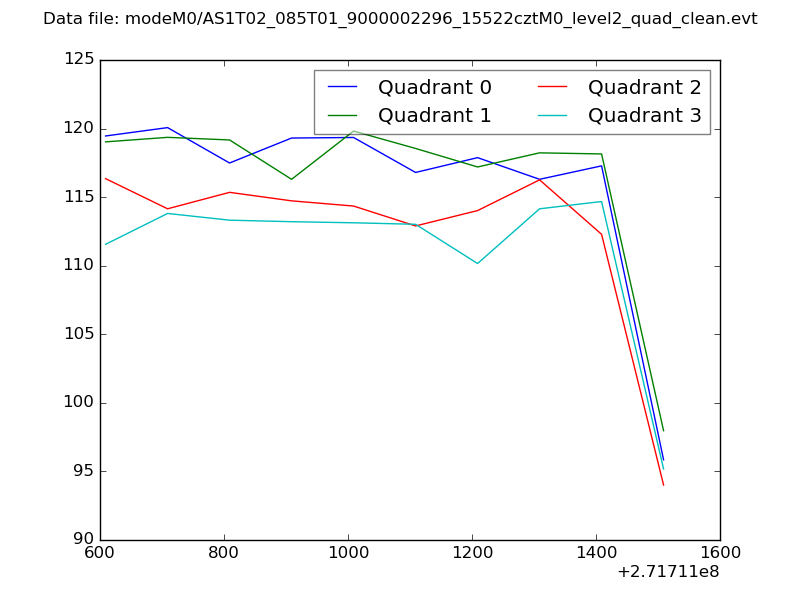 |
|
| Module-wise count rates for Quadrant A Data is divided into 100 sec bins |
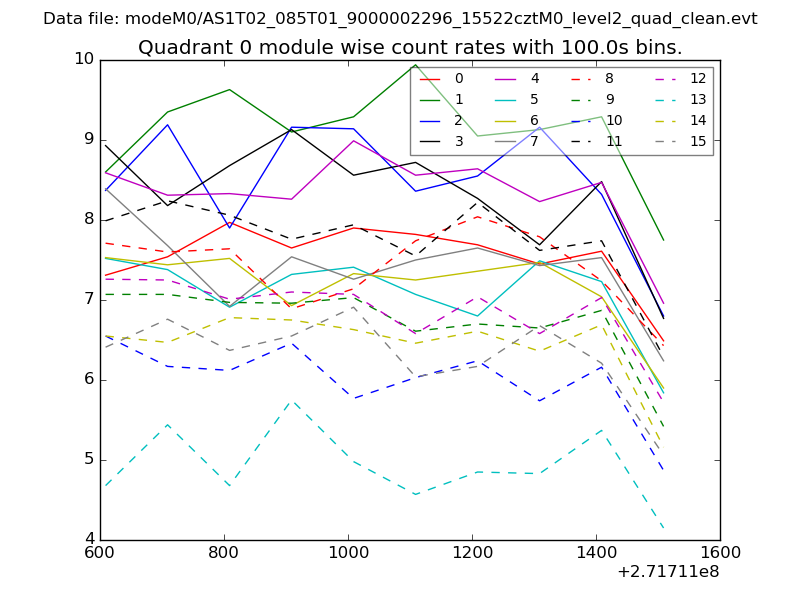 |
 |
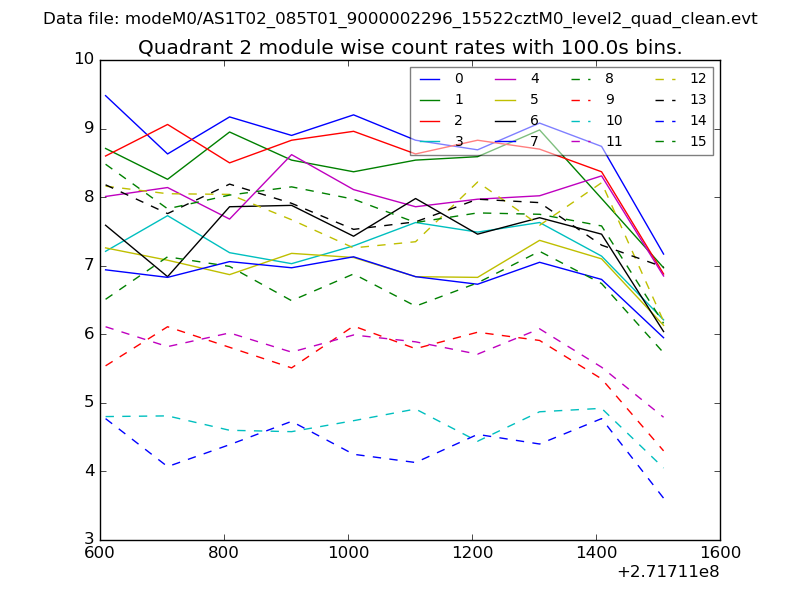
| Module-wise count rates for Quadrant B Data is divided into 100 sec bins |
 |
 |
| Module-wise count rates for Quadrant C Data is divided into 100 sec bins |
 |
 |
| Module-wise count rates for Quadrant D Data is divided into 100 sec bins |
 |
 |
| Parameter | Plot |
|---|---|
| CZT HV Monitor | 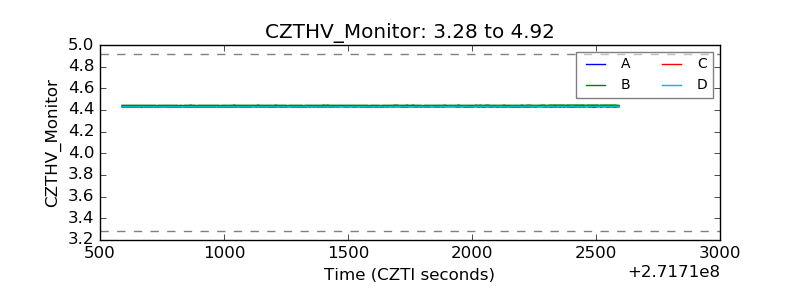 |
| D_VDD | 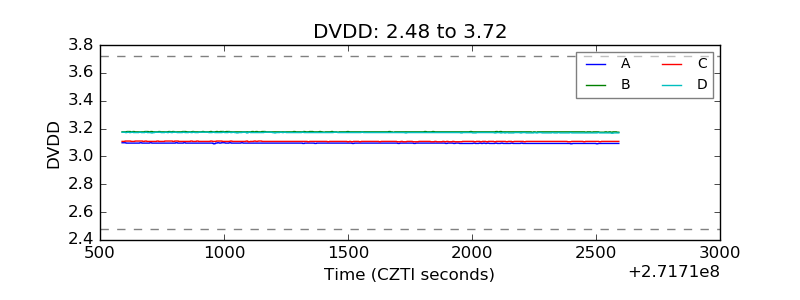 |
| Temperature 1 |  |
| Veto HV Monitor | 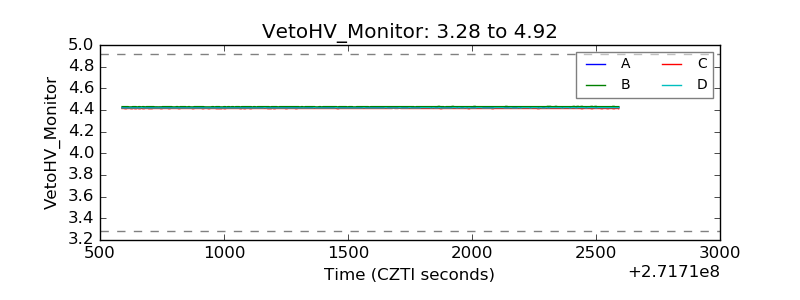 |
| Veto LLD | 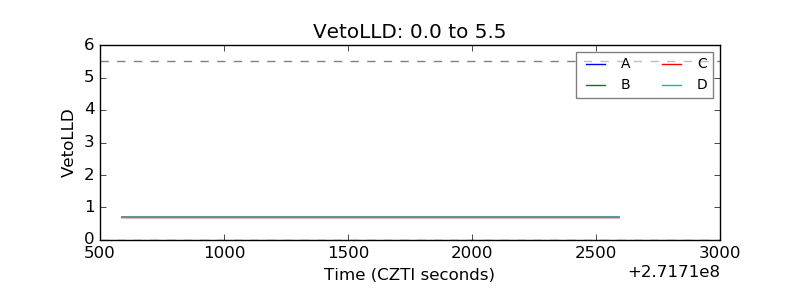 |
| Alpha Counter | 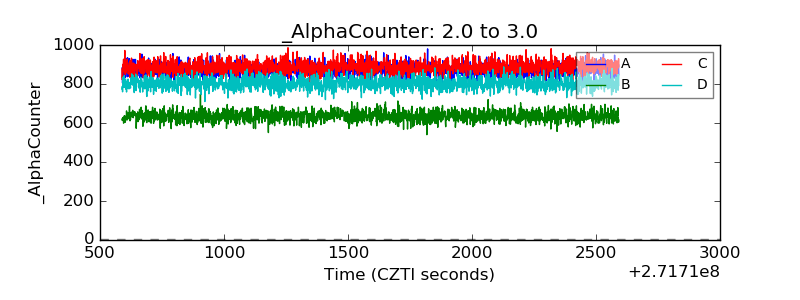 |
| _CPM_Rate | 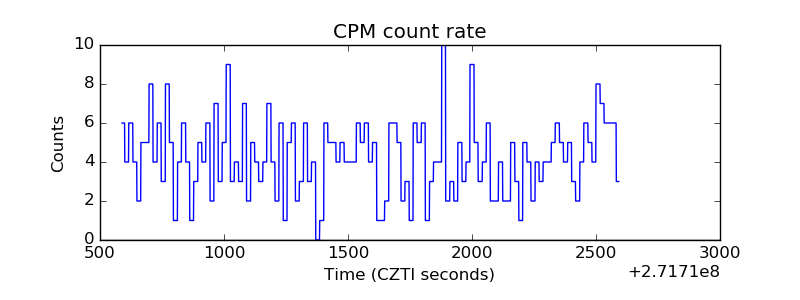 |
| CZT Counter | 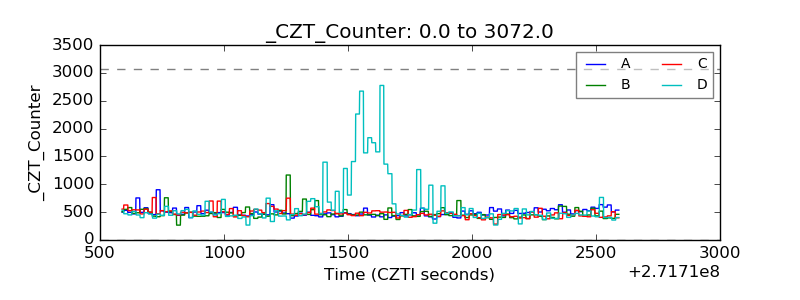 |
| +2.5 Volts monitor |  |
| +5 Volts monitor | 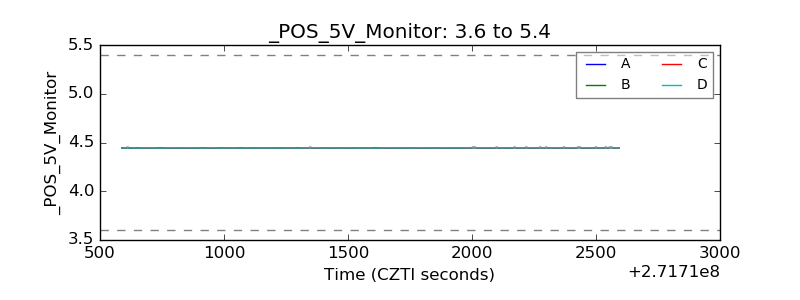 |
| _ROLL_ROT | 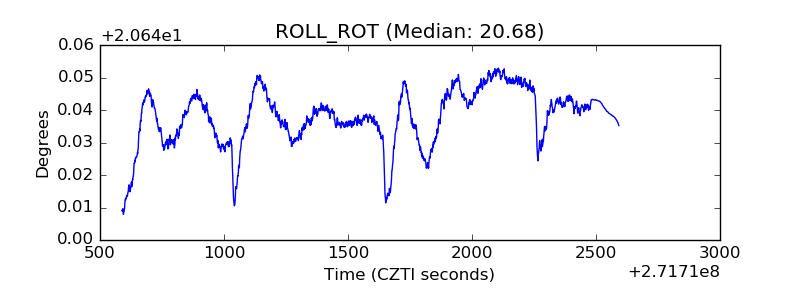 |
| _Roll_DEC | 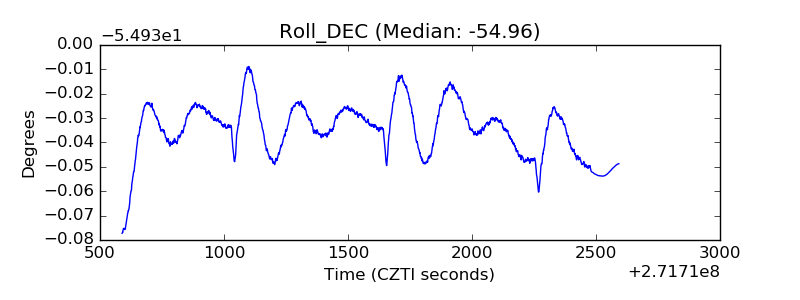 |
| _Roll_RA | 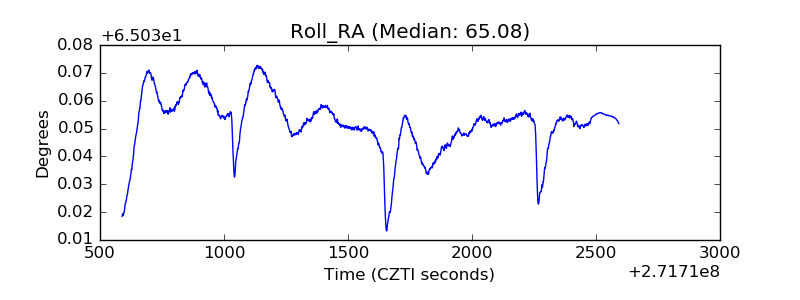 |
| Veto Counter |  |