| Param | Original file | Final file |
|---|---|---|
| Filename | modeM0/AS1T02_079T01_9000002298cztM0_level2.fits | modeM0/AS1T02_079T01_9000002298cztM0_level2_quad_clean.evt |
| Size (bytes) | 210,196,800 | 185,967,360 |
| Size | 200.5 MB | 177.4 MB |
| Events in quadrant A | 1,259,452 | 1,057,240 |
| Events in quadrant B | 1,221,534 | 1,057,505 |
| Events in quadrant C | 1,235,022 | 1,014,507 |
| Events in quadrant D | 1,087,082 | 938,993 |
| Mode M9 | |||
|---|---|---|---|
| Quadrant | BADHDUFLAG | Total packets | Discarded packets |
| A | 0 | 27 | 0 |
| B | 0 | 27 | 0 |
| C | 0 | 27 | 0 |
| D | 0 | 27 | 0 |
| Mode SS | |||
|---|---|---|---|
| Quadrant | BADHDUFLAG | Total packets | Discarded packets |
| A | 0 | 462 | 0 |
| B | 0 | 462 | 0 |
| C | 0 | 462 | 0 |
| D | 0 | 462 | 0 |
| Mode M0 | |||
|---|---|---|---|
| Quadrant | BADHDUFLAG | Total packets | Discarded packets |
| A | 0 | 47417 | 0 |
| B | 0 | 47601 | 0 |
| C | 0 | 47601 | 0 |
| D | 0 | 50245 | 0 |
| Quadrant | Total seconds | Saturated seconds | Saturation percentage |
|---|---|---|---|
| A | 22715 | 228 | 1.003742% |
| B | 22715 | 147 | 0.647149% |
| C | 22715 | 243 | 1.069778% |
| D | 22715 | 155 | 0.682368% |
Noise dominated data is calculated using 1-second bins in cleaned event files. If a bin has >2000 counts, and if more than 50% of those come from <1% of pixels, then it is considered to be noise-dominated and hence unusable.
| Quadrant | # 1 sec bins | Bins with >0 counts | Bins with >2000 counts | High rate bins dominated by noise | Noise dominated (total time) | Noise dominated (detector-on time) | Marked lightcurve |
|---|---|---|---|---|---|---|---|
| A | 25280 | 22714 | 0 | 0 | 0.00% | 0.00% |  |
| B | 25280 | 22715 | 0 | 0 | 0.00% | 0.00% |  |
| C | 25280 | 22715 | 0 | 0 | 0.00% | 0.00% | 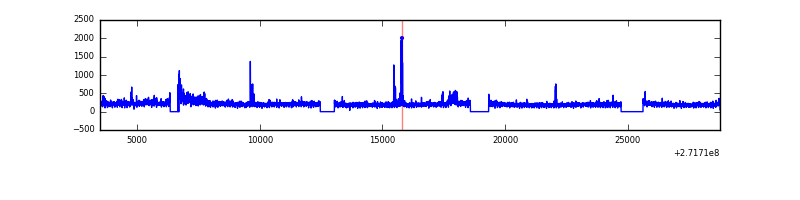 |
| D | 25280 | 22714 | 0 | 0 | 0.00% | 0.00% | 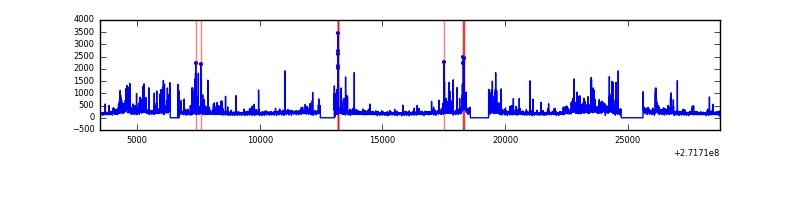 |
Top three noisy pixels from each quadrant. If the there are fewer than three noisy pixels in the level2.evt file, extra rows are filled as -1
| Pixel properties | Quadrant properties | ||||||
|---|---|---|---|---|---|---|---|
| Quadrant | DetID | PixID | Counts | Sigma | Mean | Median | Sigma |
| A | 0 | 29 | 1235 | 10.96 | 328 | 307 | 84.7 |
| A | 7 | 110 | 963 | 7.75 | 328 | 307 | 84.7 |
| A | 0 | 30 | 961 | 7.72 | 328 | 307 | 84.7 |
| B | 2 | 9 | 1044 | 11.26 | 322 | 306 | 65.6 |
| B | 2 | 8 | 862 | 8.48 | 322 | 306 | 65.6 |
| B | 3 | 17 | 836 | 8.08 | 322 | 306 | 65.6 |
| C | 12 | 241 | 947 | 7.62 | 325 | 303 | 84.5 |
| C | 3 | 158 | 841 | 6.36 | 325 | 303 | 84.5 |
| C | 2 | 191 | 838 | 6.33 | 325 | 303 | 84.5 |
| D | 6 | 231 | 821 | 6.45 | 310 | 282 | 83.6 |
| D | 10 | 189 | 776 | 5.91 | 310 | 282 | 83.6 |
| D | 1 | 31 | 756 | 5.67 | 310 | 282 | 83.6 |
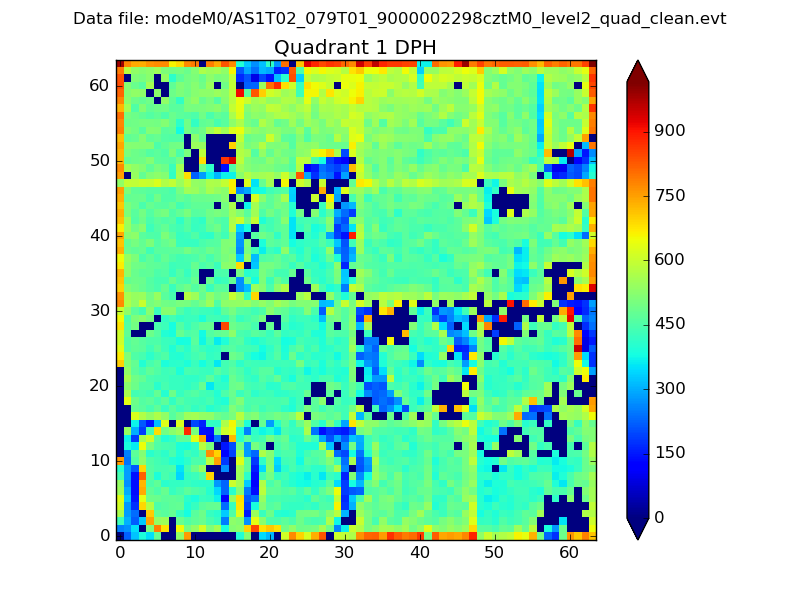
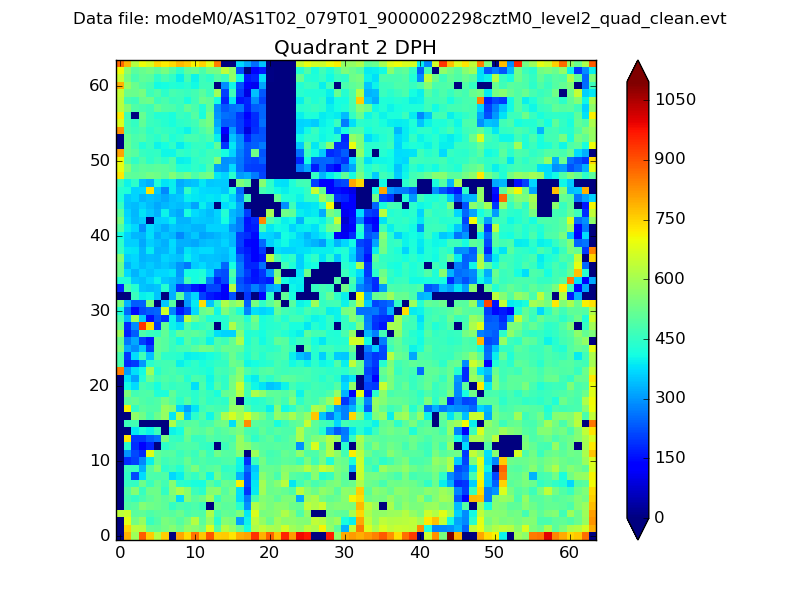
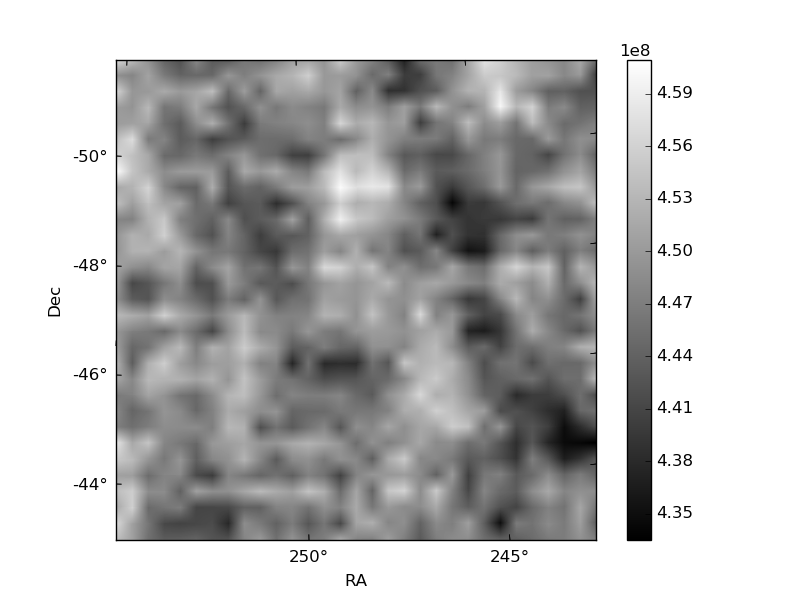
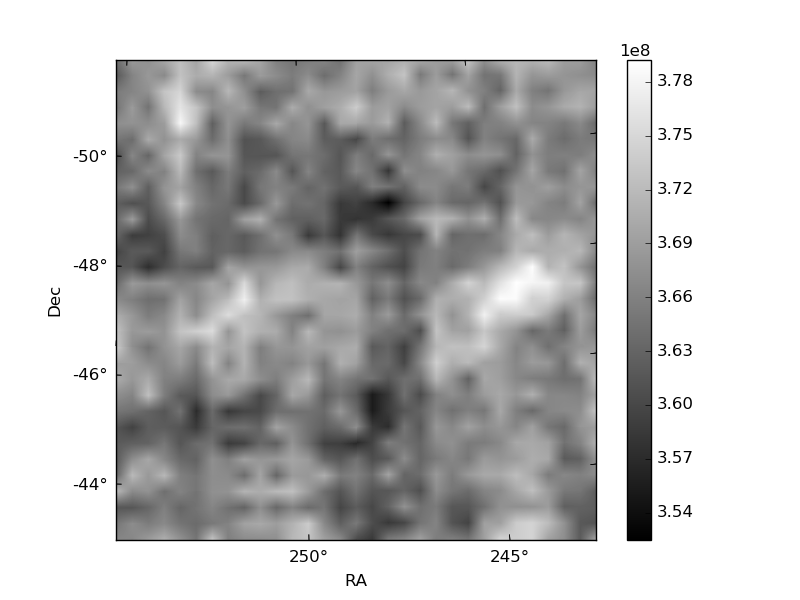
Histogram calculated using DETX and DETY for each event in the final _common_clean file
| Quadrant A |  |
 |
Quadrant B |
|---|---|---|---|
| Quadrant D |  |
 |
Quadrant C |
| Plot type | Count rate plots | Images |
|---|---|---|
| Comparison with Poisson distribution Blue bars denote a histogram of data divided into 1 sec bins. Red curve is a Poisson curve with rate = median count rate of data. |
 |
 |
| Quadrant-wise count rates Data is divided into 100 sec bins |
 |
|
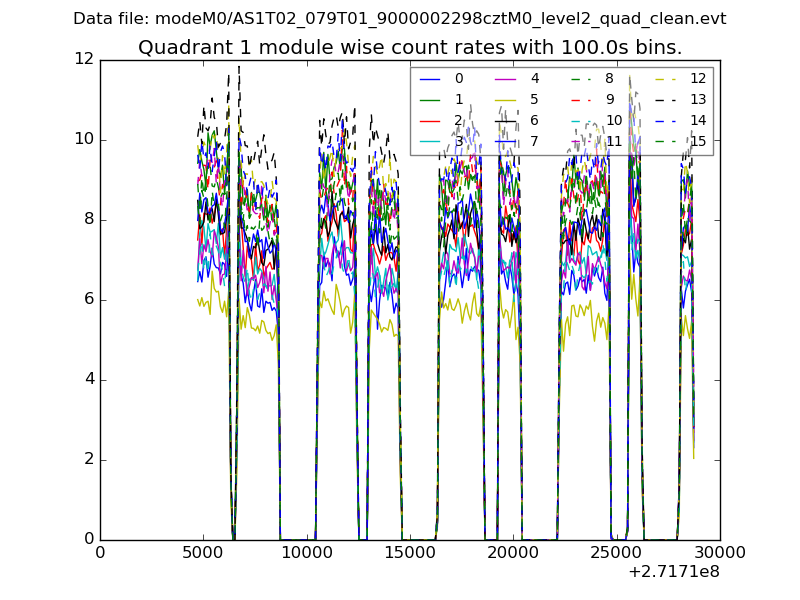
| Module-wise count rates for Quadrant A Data is divided into 100 sec bins |
 |
 |
| Module-wise count rates for Quadrant B Data is divided into 100 sec bins |
 |
 |
| Module-wise count rates for Quadrant C Data is divided into 100 sec bins |
 |
 |
| Module-wise count rates for Quadrant D Data is divided into 100 sec bins |
 |
 |
| Parameter | Plot |
|---|---|
| CZT HV Monitor |  |
| D_VDD |  |
| Temperature 1 | 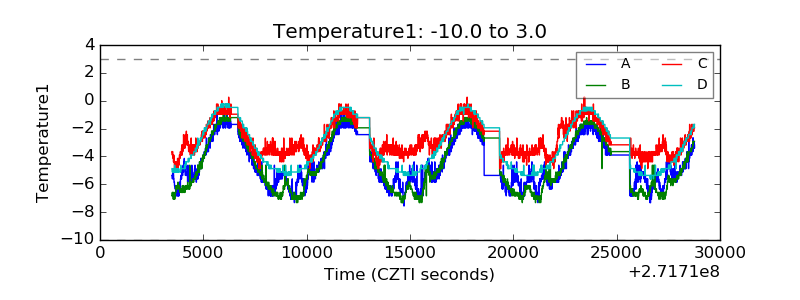 |
| Veto HV Monitor |  |
| Veto LLD | 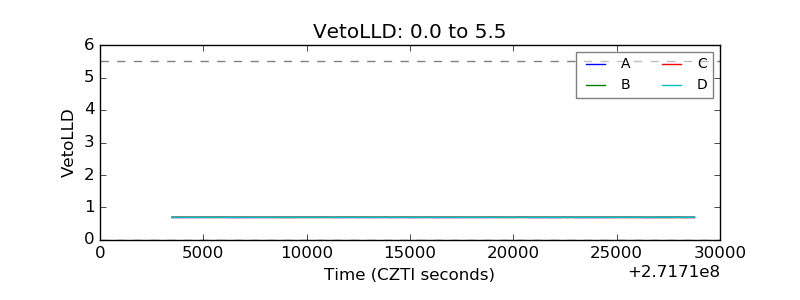 |
| Alpha Counter |  |
| _CPM_Rate |  |
| CZT Counter |  |
| +2.5 Volts monitor | 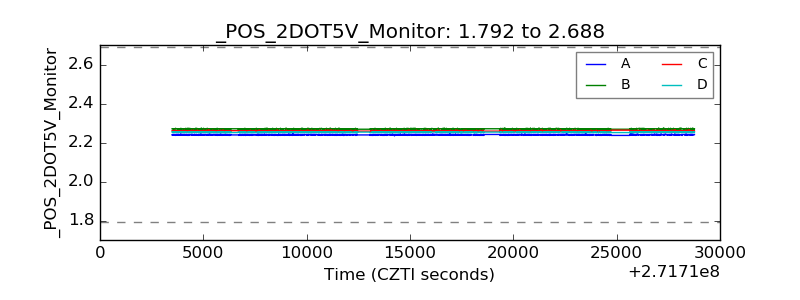 |
| +5 Volts monitor |  |
| _ROLL_ROT |  |
| _Roll_DEC |  |
| _Roll_RA |  |
| Veto Counter |  |