| Param | Original file | Final file |
|---|---|---|
| Filename | modeM0/AS1T02_079T01_9000002298_15522cztM0_level2.evt | modeM0/AS1T02_079T01_9000002298_15522cztM0_level2_quad_clean.evt |
| Size (bytes) | 335,018,880 | 63,843,840 |
| Size | 319.5 MB | 60.9 MB |
| Events in quadrant A | 2,518,506 | 410,114 |
| Events in quadrant B | 2,294,968 | 415,808 |
| Events in quadrant C | 2,429,319 | 400,169 |
| Events in quadrant D | 2,598,454 | 392,370 |
| Mode M9 | |||
|---|---|---|---|
| Quadrant | BADHDUFLAG | Total packets | Discarded packets |
| A | 0 | 4 | 0 |
| B | 0 | 4 | 0 |
| C | 0 | 4 | 0 |
| D | 0 | 4 | 0 |
| Mode SS | |||
|---|---|---|---|
| Quadrant | BADHDUFLAG | Total packets | Discarded packets |
| A | 0 | 94 | 0 |
| B | 0 | 94 | 0 |
| C | 0 | 94 | 0 |
| D | 0 | 94 | 0 |
| Mode M0 | |||
|---|---|---|---|
| Quadrant | BADHDUFLAG | Total packets | Discarded packets |
| A | 0 | 10282 | 2 |
| B | 0 | 9594 | 1 |
| C | 0 | 9880 | 1 |
| D | 0 | 10778 | 1 |
| Quadrant | Total seconds | Saturated seconds | Saturation percentage |
|---|---|---|---|
| A | 4472 | 158 | 3.533095% |
| B | 4472 | 62 | 1.386404% |
| C | 4472 | 90 | 2.012522% |
| D | 4472 | 79 | 1.766547% |
Noise dominated data is calculated using 1-second bins in cleaned event files. If a bin has >2000 counts, and if more than 50% of those come from <1% of pixels, then it is considered to be noise-dominated and hence unusable.
| Quadrant | # 1 sec bins | Bins with >0 counts | Bins with >2000 counts | High rate bins dominated by noise | Noise dominated (total time) | Noise dominated (detector-on time) | Marked lightcurve |
|---|---|---|---|---|---|---|---|
| A | 4823 | 4474 | 88 | 88 | 1.82% | 1.97% |  |
| B | 4823 | 4475 | 10 | 10 | 0.21% | 0.22% | 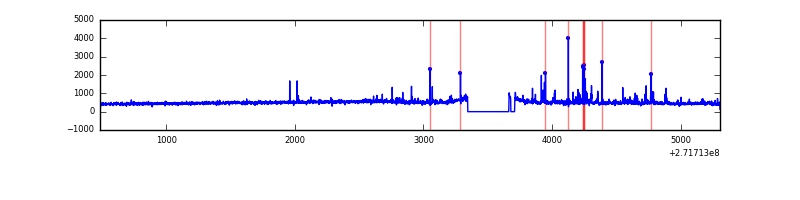 |
| C | 4823 | 4475 | 0 | 0 | 0.00% | 0.00% | 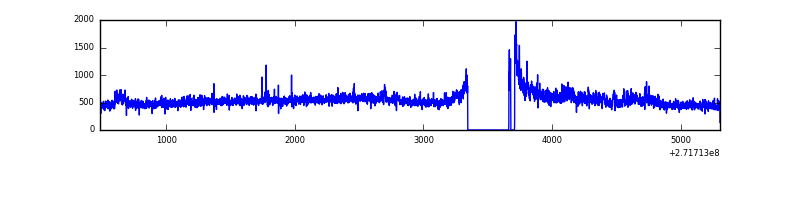 |
| D | 4823 | 4474 | 34 | 34 | 0.70% | 0.76% | 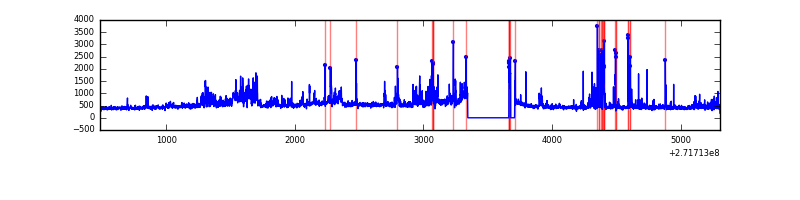 |
Top three noisy pixels from each quadrant. If the there are fewer than three noisy pixels in the level2.evt file, extra rows are filled as -1
| Pixel properties | Quadrant properties | ||||||
|---|---|---|---|---|---|---|---|
| Quadrant | DetID | PixID | Counts | Sigma | Mean | Median | Sigma |
| A | 0 | 253 | 373631 | 3362.93 | 539 | 527 | 110.9 |
| A | 14 | 238 | 51265 | 457.32 | 539 | 527 | 110.9 |
| A | 14 | 237 | 14714 | 127.87 | 539 | 527 | 110.9 |
| B | 0 | 197 | 25854 | 239.42 | 544 | 531 | 105.8 |
| B | 0 | 182 | 23067 | 213.07 | 544 | 531 | 105.8 |
| B | 10 | 245 | 21792 | 201.02 | 544 | 531 | 105.8 |
| C | 3 | 233 | 311346 | 2547.9 | 517 | 519 | 122.0 |
| C | 14 | 238 | 80195 | 653.12 | 517 | 519 | 122.0 |
| C | 0 | 207 | 7755 | 59.31 | 517 | 519 | 122.0 |
| D | 12 | 221 | 333472 | 2557.55 | 526 | 510 | 130.2 |
| D | 7 | 38 | 123319 | 943.32 | 526 | 510 | 130.2 |
| D | 5 | 222 | 77672 | 592.7 | 526 | 510 | 130.2 |
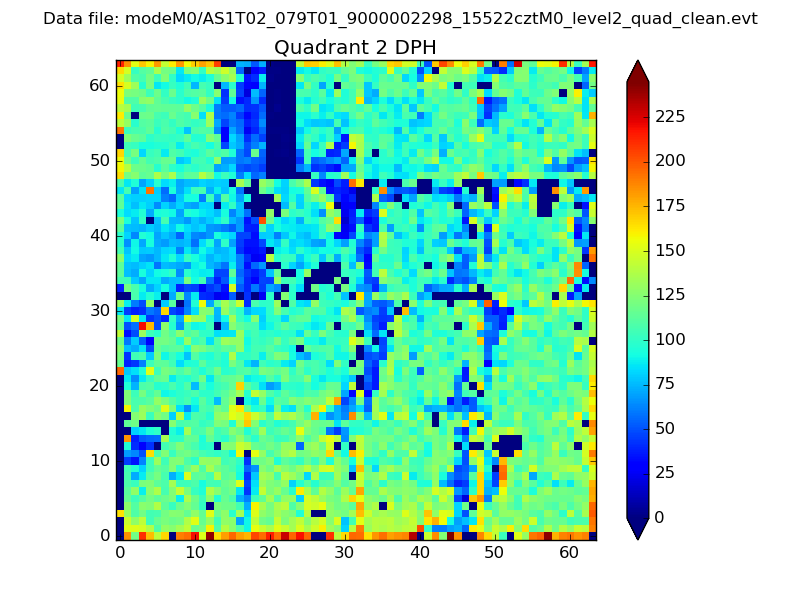
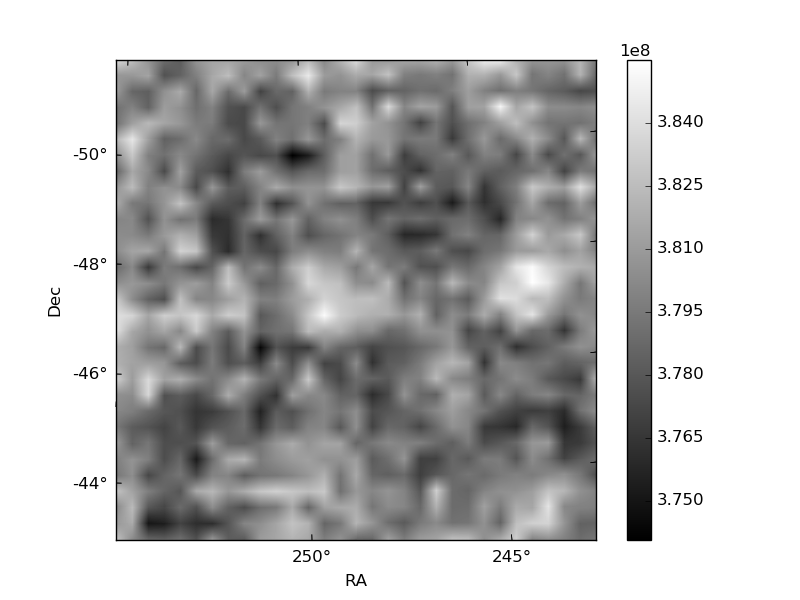
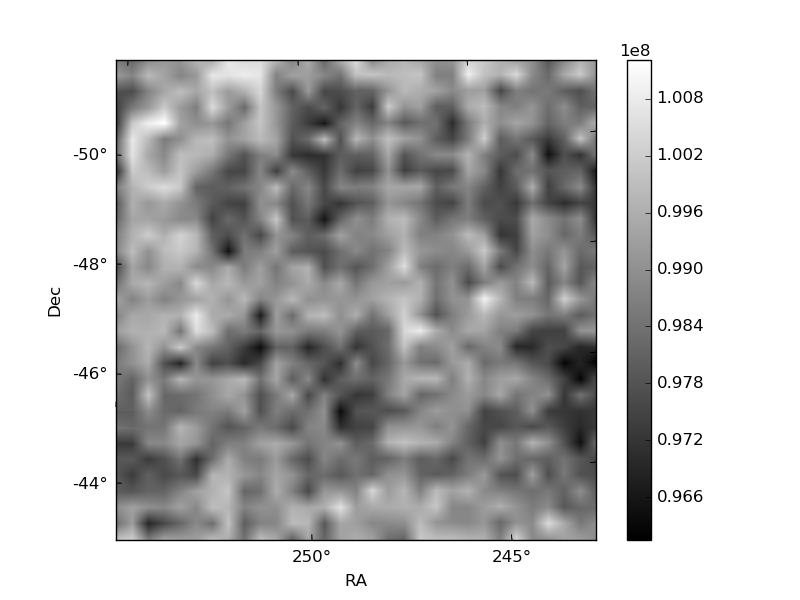
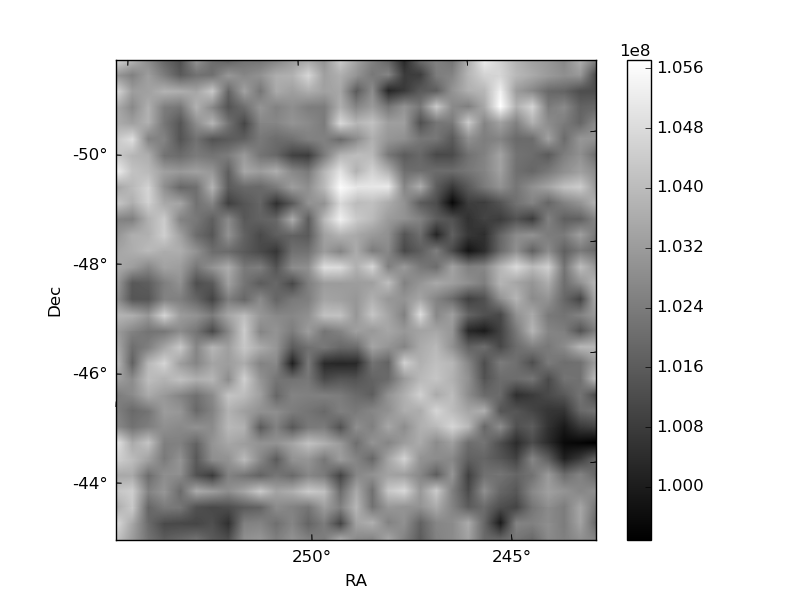
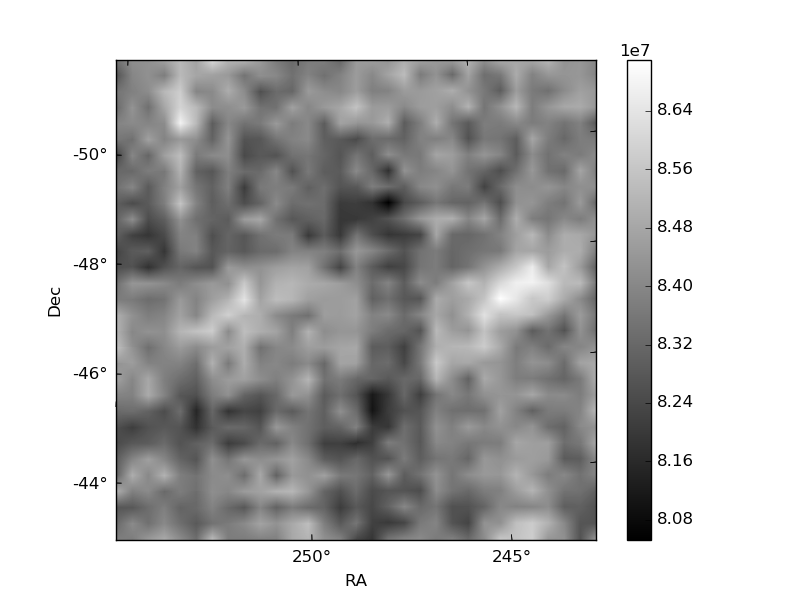
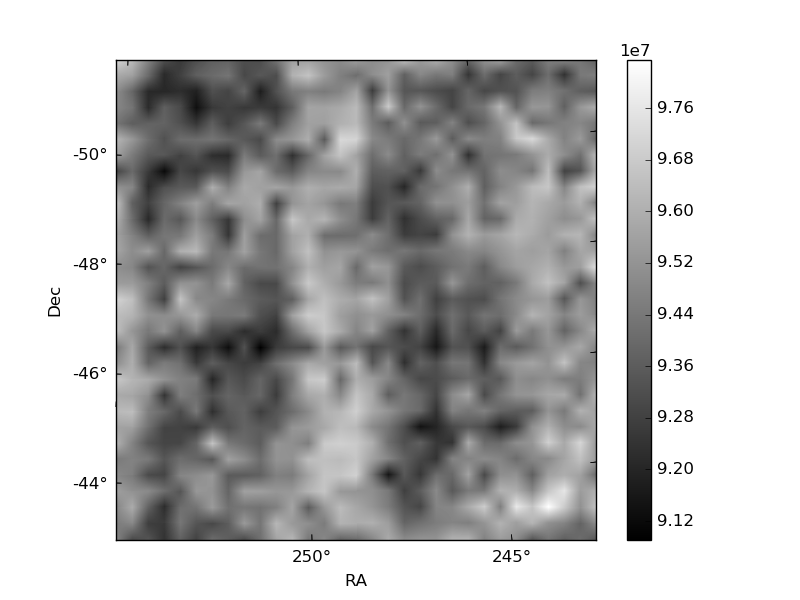
Histogram calculated using DETX and DETY for each event in the final _common_clean file
| Quadrant A | 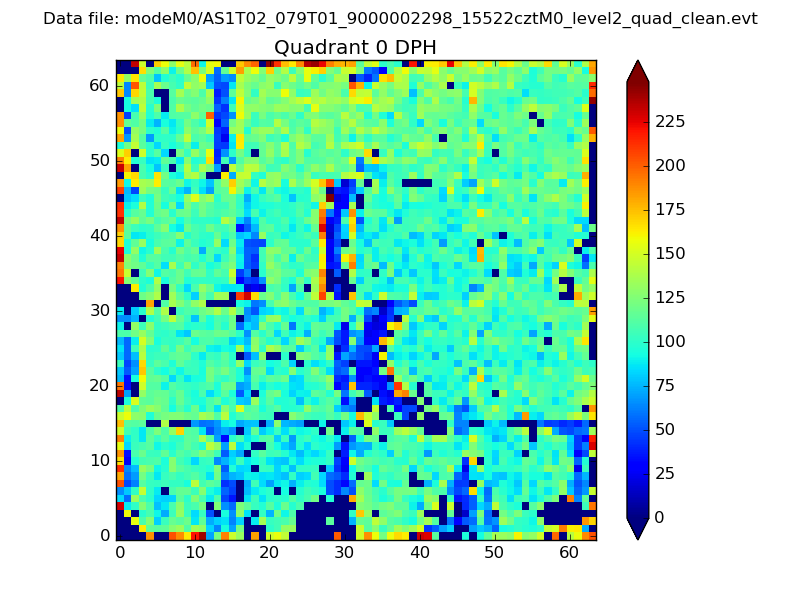 |
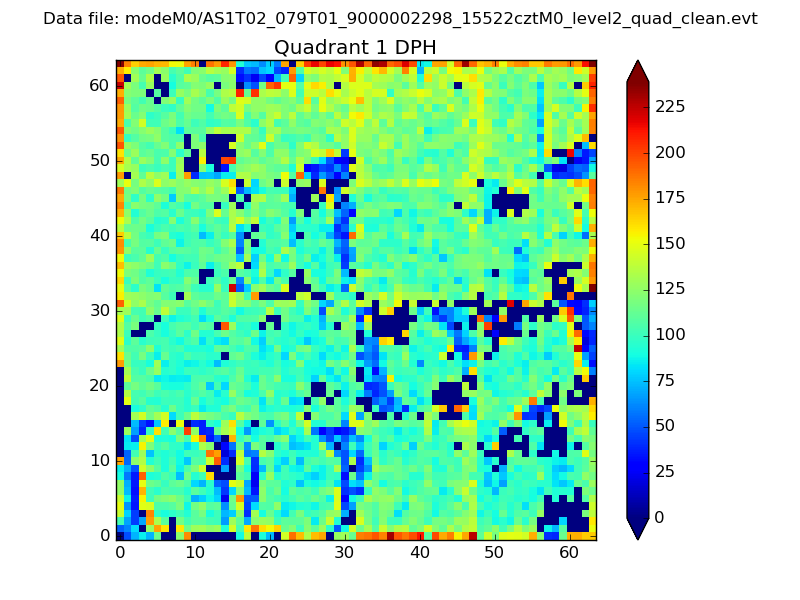 |
Quadrant B |
|---|---|---|---|
| Quadrant D | 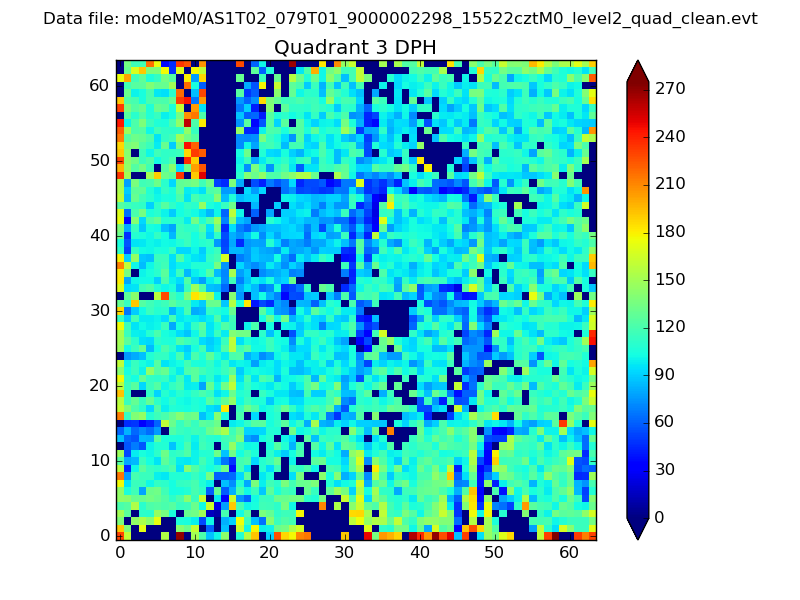 |
 |
Quadrant C |
| Plot type | Count rate plots | Images |
|---|---|---|
| Comparison with Poisson distribution Blue bars denote a histogram of data divided into 1 sec bins. Red curve is a Poisson curve with rate = median count rate of data. |
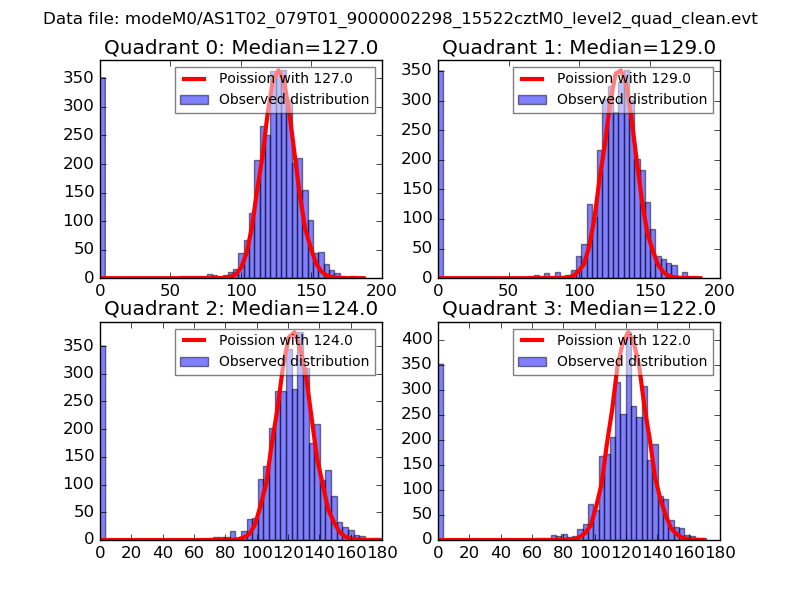 |
 |
| Quadrant-wise count rates Data is divided into 100 sec bins |
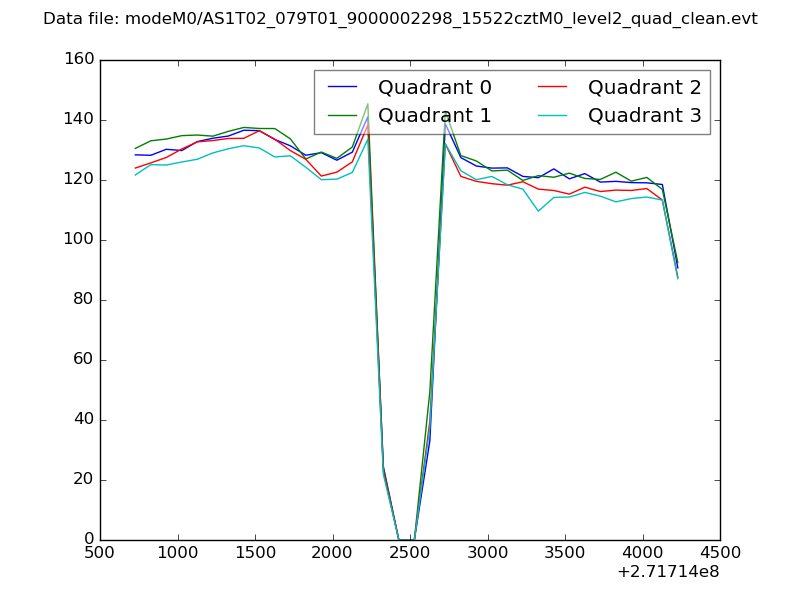 |
|
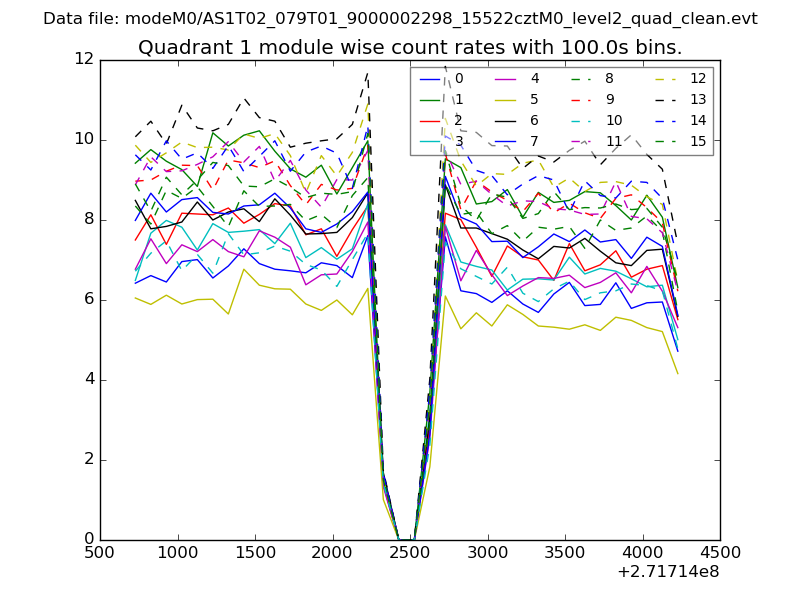
| Module-wise count rates for Quadrant A Data is divided into 100 sec bins |
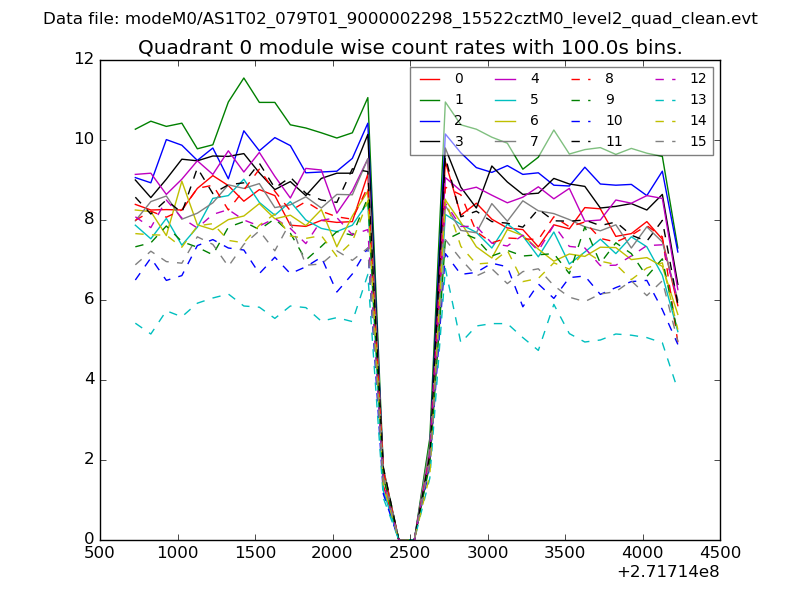 |
 |
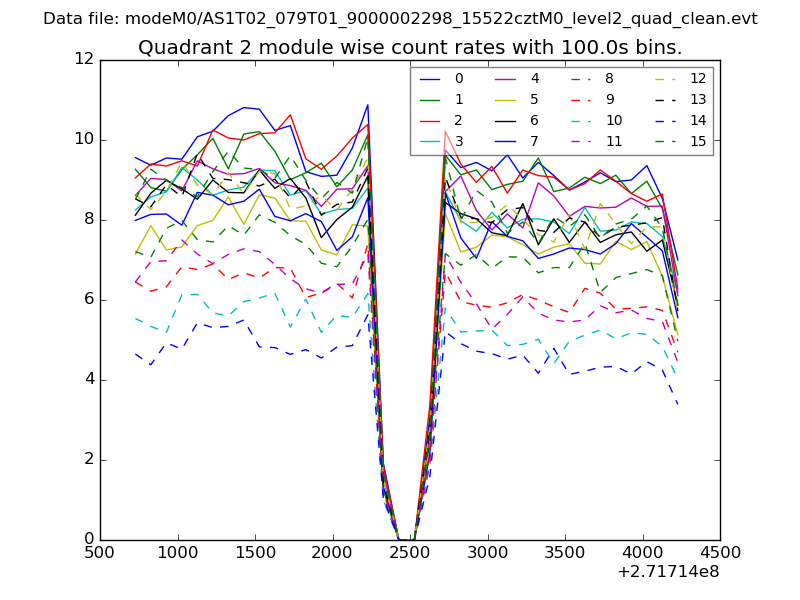
| Module-wise count rates for Quadrant B Data is divided into 100 sec bins |
 |
 |
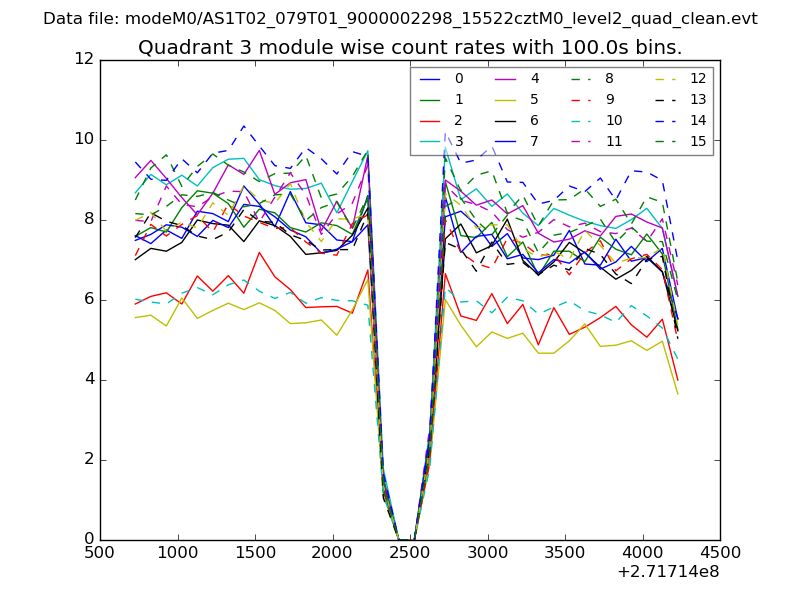
| Module-wise count rates for Quadrant C Data is divided into 100 sec bins |
 |
 |
| Module-wise count rates for Quadrant D Data is divided into 100 sec bins |
 |
 |
| Parameter | Plot |
|---|---|
| CZT HV Monitor | 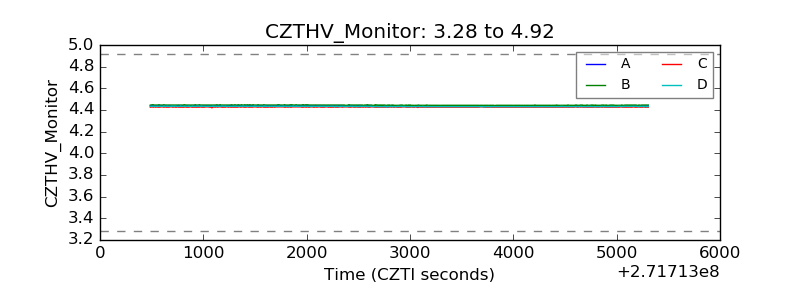 |
| D_VDD | 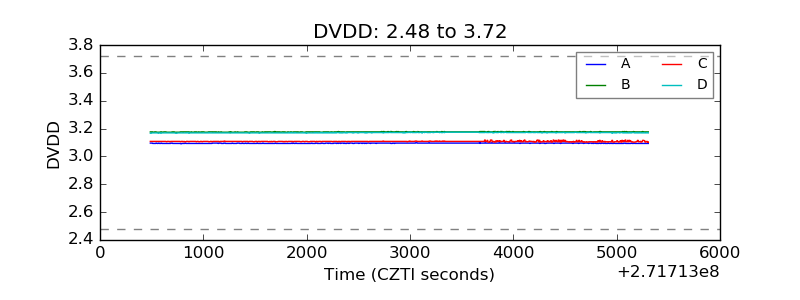 |
| Temperature 1 | 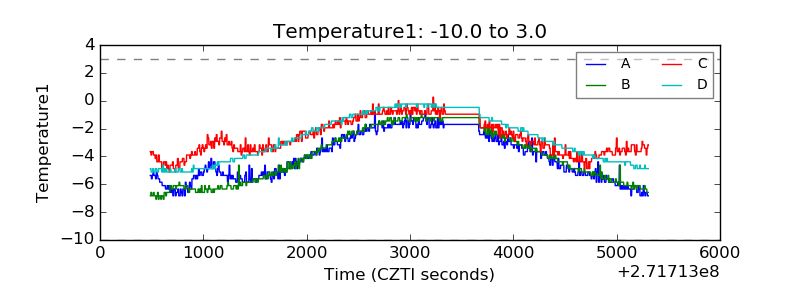 |
| Veto HV Monitor | 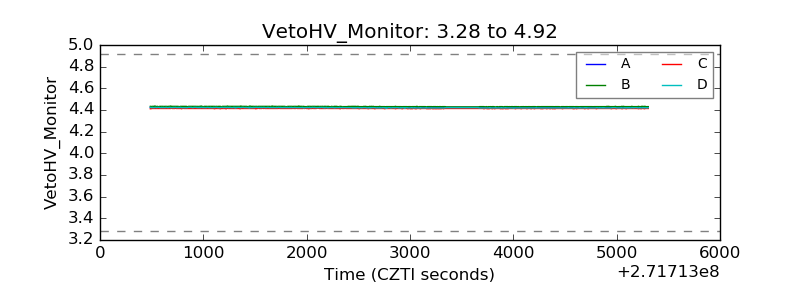 |
| Veto LLD | 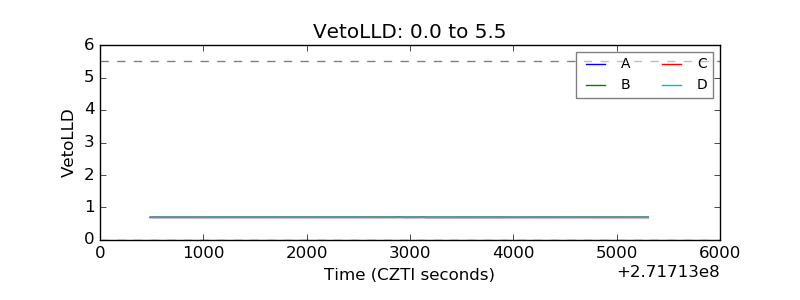 |
| Alpha Counter | 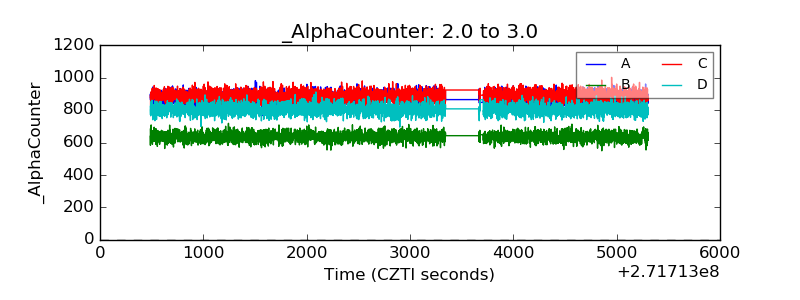 |
| _CPM_Rate | 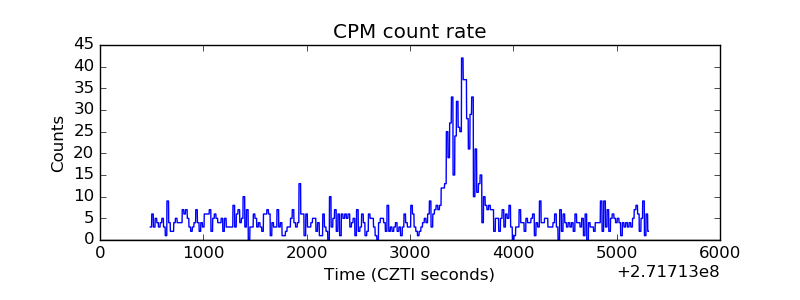 |
| CZT Counter | 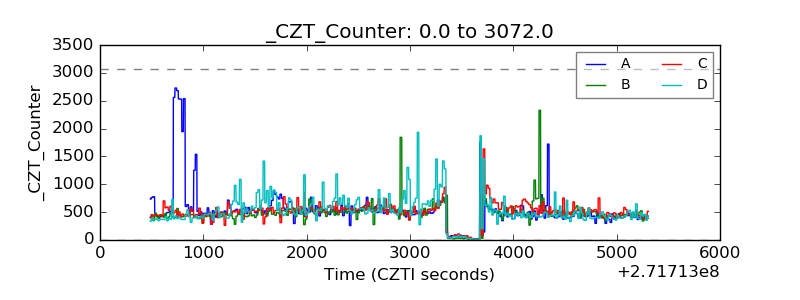 |
| +2.5 Volts monitor |  |
| +5 Volts monitor |  |
| _ROLL_ROT | 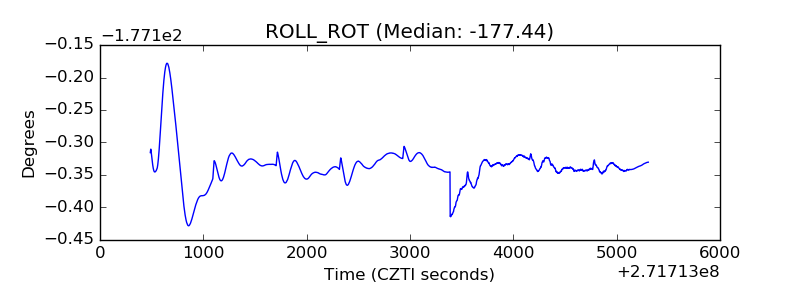 |
| _Roll_DEC | 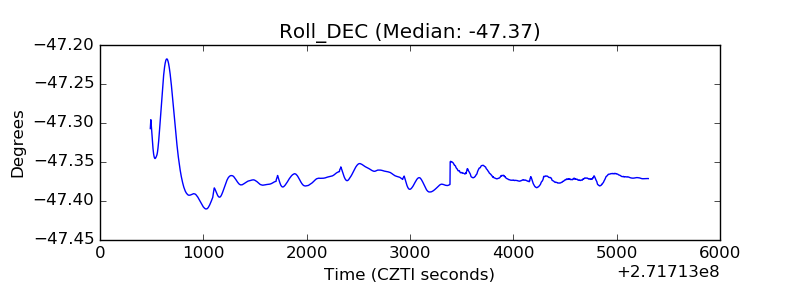 |
| _Roll_RA | 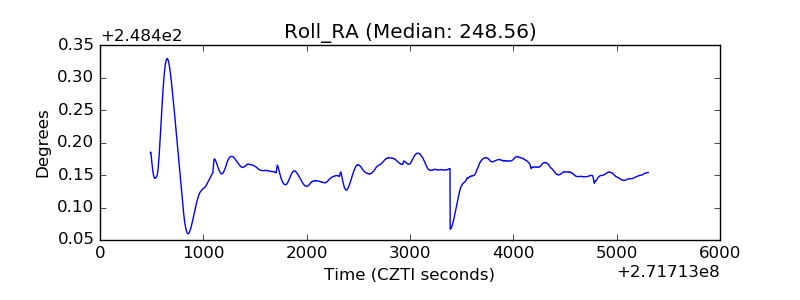 |
| Veto Counter | 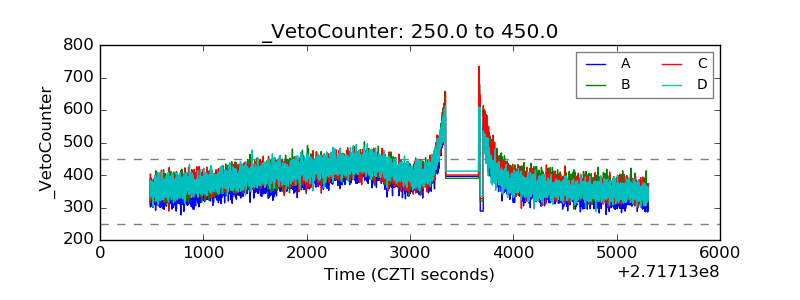 |