| Param | Original file | Final file |
|---|---|---|
| Filename | modeM0/AS1T02_079T01_9000002298_15524cztM0_level2.evt | modeM0/AS1T02_079T01_9000002298_15524cztM0_level2_quad_clean.evt |
| Size (bytes) | 759,461,760 | 152,173,440 |
| Size | 724.3 MB | 145.1 MB |
| Events in quadrant A | 5,376,780 | 968,727 |
| Events in quadrant B | 5,549,615 | 978,782 |
| Events in quadrant C | 5,781,455 | 942,585 |
| Events in quadrant D | 5,518,865 | 928,902 |
| Mode M9 | |||
|---|---|---|---|
| Quadrant | BADHDUFLAG | Total packets | Discarded packets |
| A | 0 | 17 | 0 |
| B | 0 | 16 | 0 |
| C | 0 | 16 | 0 |
| D | 0 | 16 | 0 |
| Mode SS | |||
|---|---|---|---|
| Quadrant | BADHDUFLAG | Total packets | Discarded packets |
| A | 0 | 234 | 0 |
| B | 0 | 234 | 0 |
| C | 0 | 234 | 0 |
| D | 0 | 234 | 0 |
| Mode M0 | |||
|---|---|---|---|
| Quadrant | BADHDUFLAG | Total packets | Discarded packets |
| A | 0 | 23593 | 2 |
| B | 0 | 23918 | 2 |
| C | 0 | 24450 | 2 |
| D | 0 | 24525 | 2 |
| Quadrant | Total seconds | Saturated seconds | Saturation percentage |
|---|---|---|---|
| A | 11424 | 99 | 0.866597% |
| B | 11424 | 85 | 0.744048% |
| C | 11424 | 172 | 1.505602% |
| D | 11424 | 100 | 0.875350% |
Noise dominated data is calculated using 1-second bins in cleaned event files. If a bin has >2000 counts, and if more than 50% of those come from <1% of pixels, then it is considered to be noise-dominated and hence unusable.
| Quadrant | # 1 sec bins | Bins with >0 counts | Bins with >2000 counts | High rate bins dominated by noise | Noise dominated (total time) | Noise dominated (detector-on time) | Marked lightcurve |
|---|---|---|---|---|---|---|---|
| A | 12350 | 11427 | 17 | 17 | 0.14% | 0.15% | 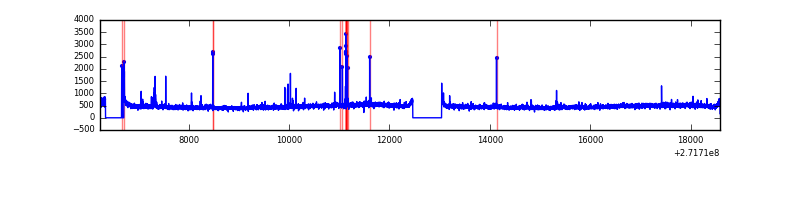 |
| B | 12350 | 11428 | 15 | 15 | 0.12% | 0.13% | 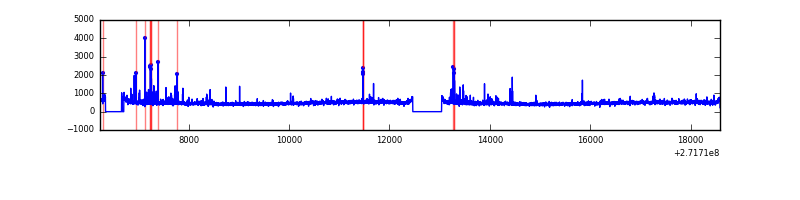 |
| C | 12350 | 11428 | 32 | 32 | 0.26% | 0.28% | 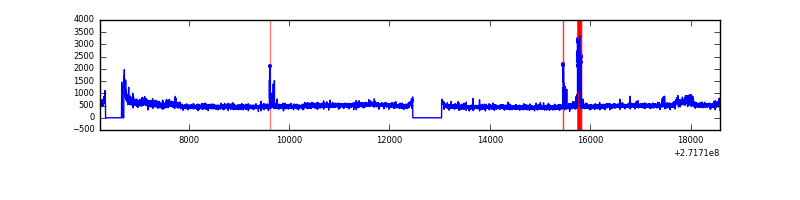 |
| D | 12350 | 11427 | 54 | 54 | 0.44% | 0.47% | 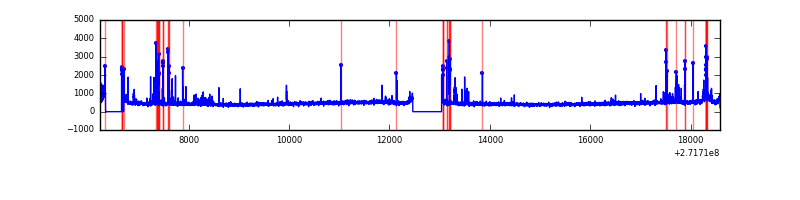 |
Top three noisy pixels from each quadrant. If the there are fewer than three noisy pixels in the level2.evt file, extra rows are filled as -1
| Pixel properties | Quadrant properties | ||||||
|---|---|---|---|---|---|---|---|
| Quadrant | DetID | PixID | Counts | Sigma | Mean | Median | Sigma |
| A | 9 | 143 | 89536 | 328.78 | 1334 | 1307 | 268.3 |
| A | 0 | 253 | 80787 | 296.18 | 1334 | 1307 | 268.3 |
| A | 14 | 238 | 58500 | 213.13 | 1334 | 1307 | 268.3 |
| B | 4 | 142 | 44412 | 168.61 | 1338 | 1305 | 255.7 |
| B | 0 | 189 | 42840 | 162.46 | 1338 | 1305 | 255.7 |
| B | 4 | 190 | 41454 | 157.04 | 1338 | 1305 | 255.7 |
| C | 3 | 233 | 449117 | 1514.26 | 1270 | 1276 | 295.7 |
| C | 14 | 238 | 195873 | 657.98 | 1270 | 1276 | 295.7 |
| C | 9 | 54 | 129952 | 435.09 | 1270 | 1276 | 295.7 |
| D | 7 | 38 | 172805 | 549.49 | 1292 | 1252 | 312.2 |
| D | 12 | 221 | 164609 | 523.24 | 1292 | 1252 | 312.2 |
| D | 5 | 222 | 116279 | 368.43 | 1292 | 1252 | 312.2 |
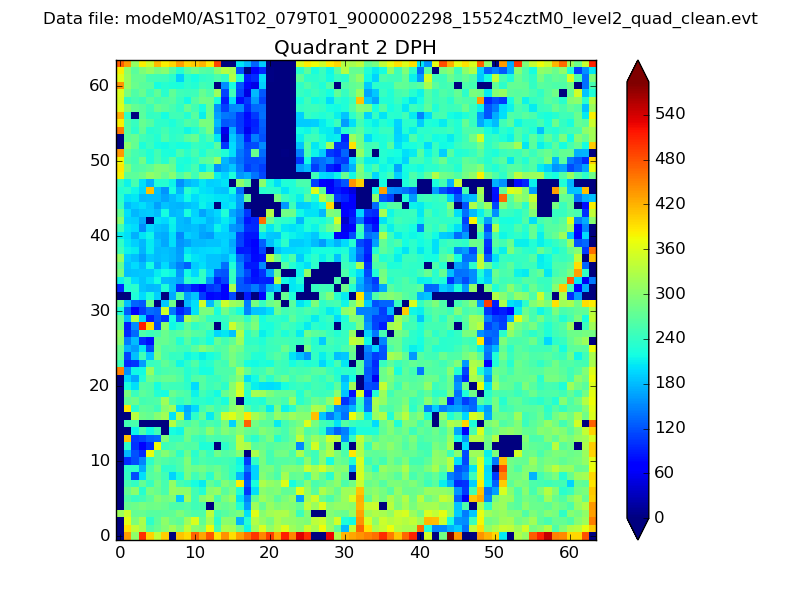
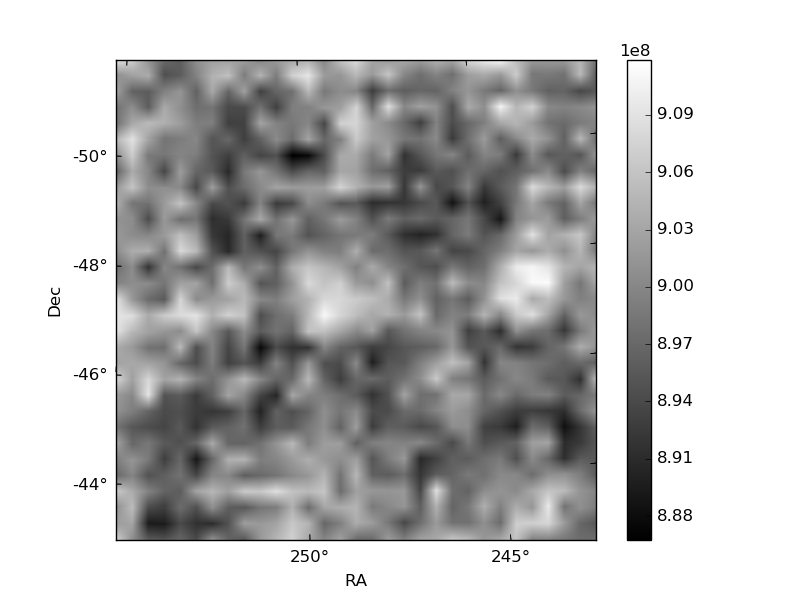
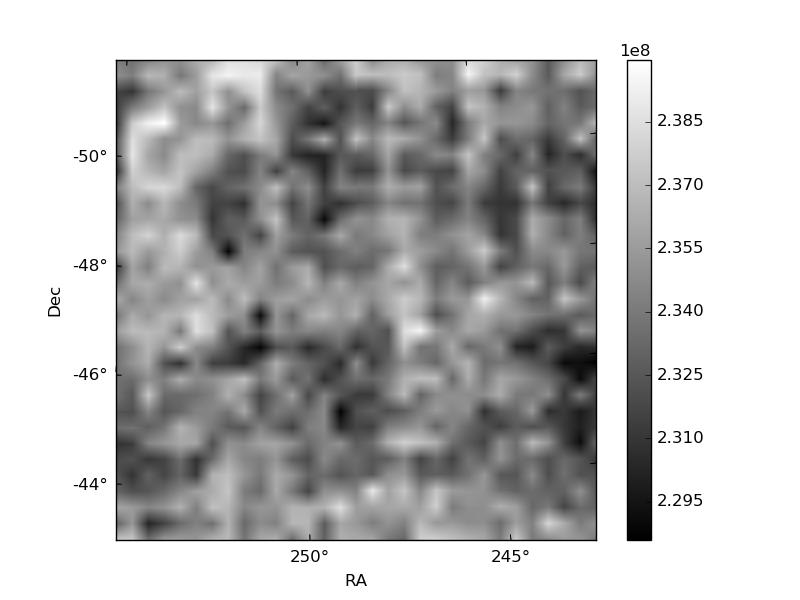
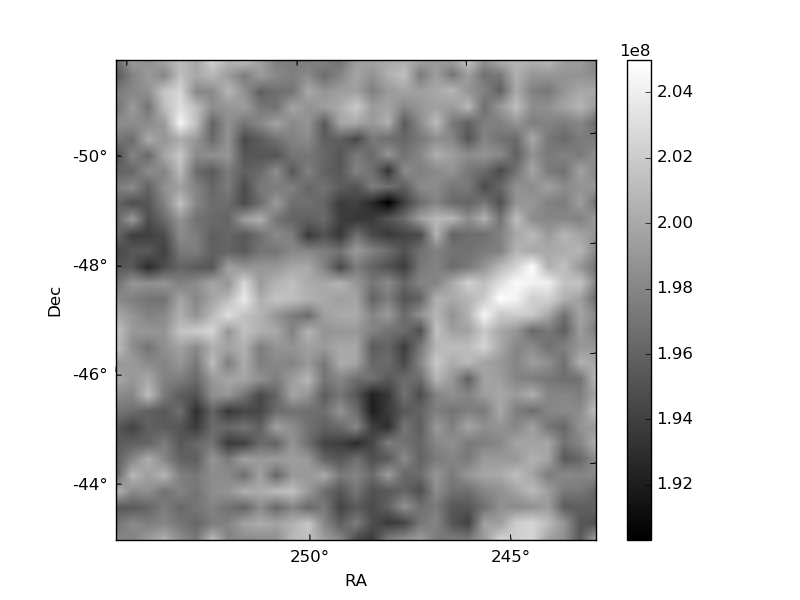
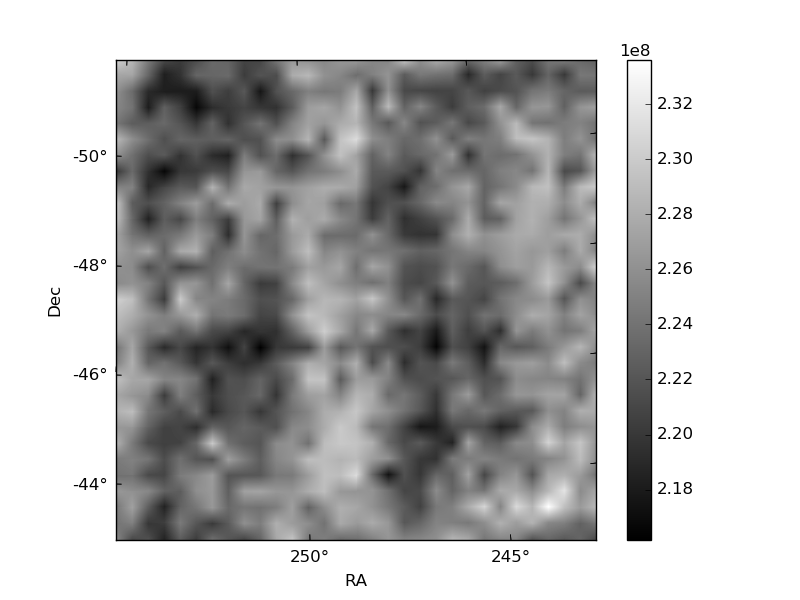
Histogram calculated using DETX and DETY for each event in the final _common_clean file
| Quadrant A | 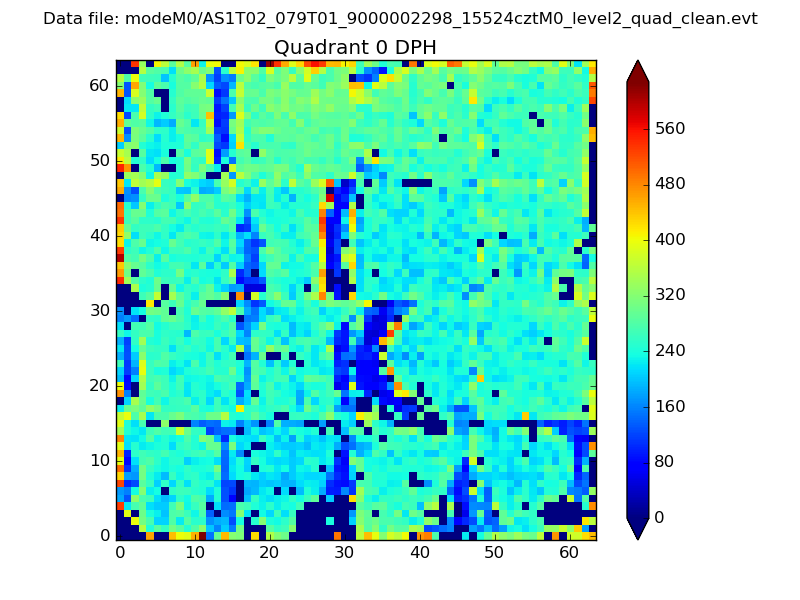 |
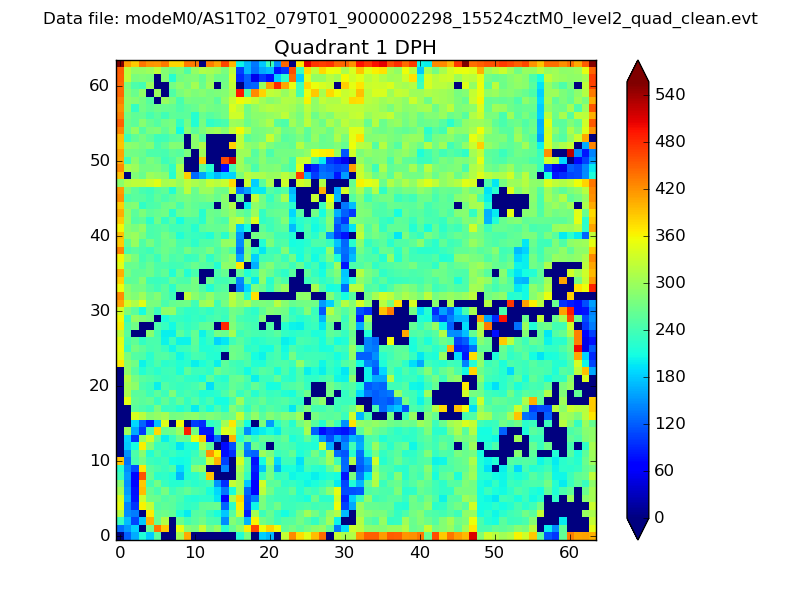 |
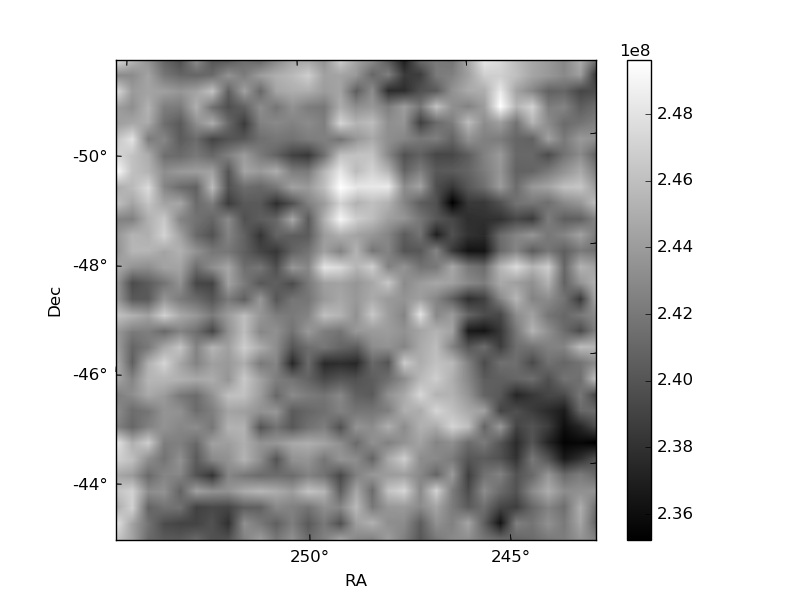
Quadrant B |
|---|---|---|---|
| Quadrant D | 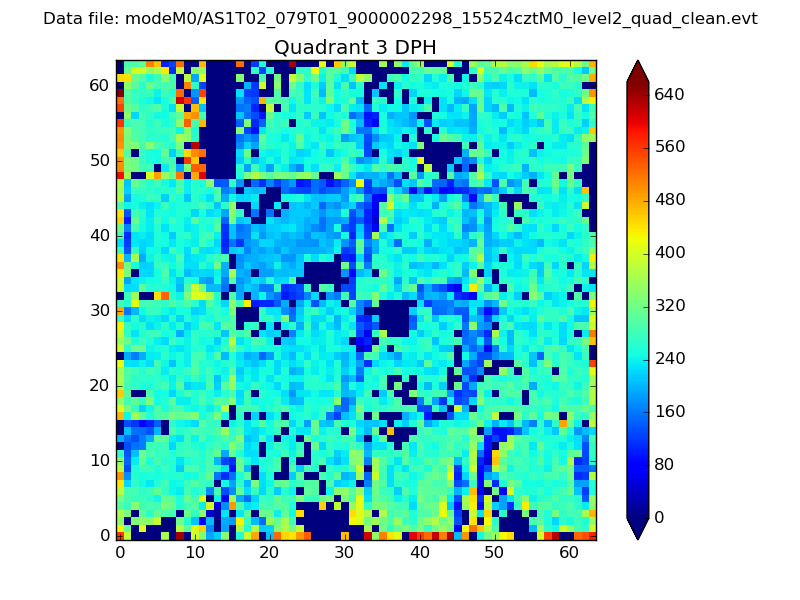 |
 |
Quadrant C |
| Plot type | Count rate plots | Images |
|---|---|---|
| Comparison with Poisson distribution Blue bars denote a histogram of data divided into 1 sec bins. Red curve is a Poisson curve with rate = median count rate of data. |
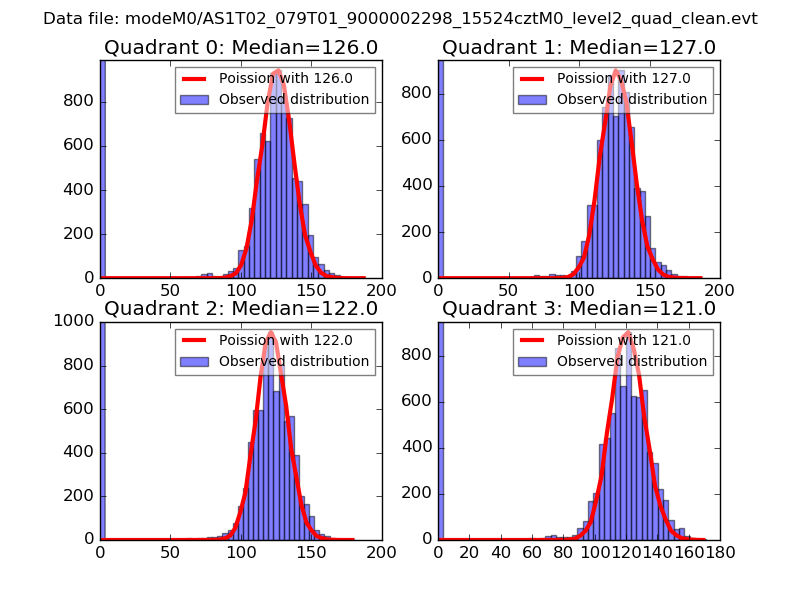 |
 |
| Quadrant-wise count rates Data is divided into 100 sec bins |
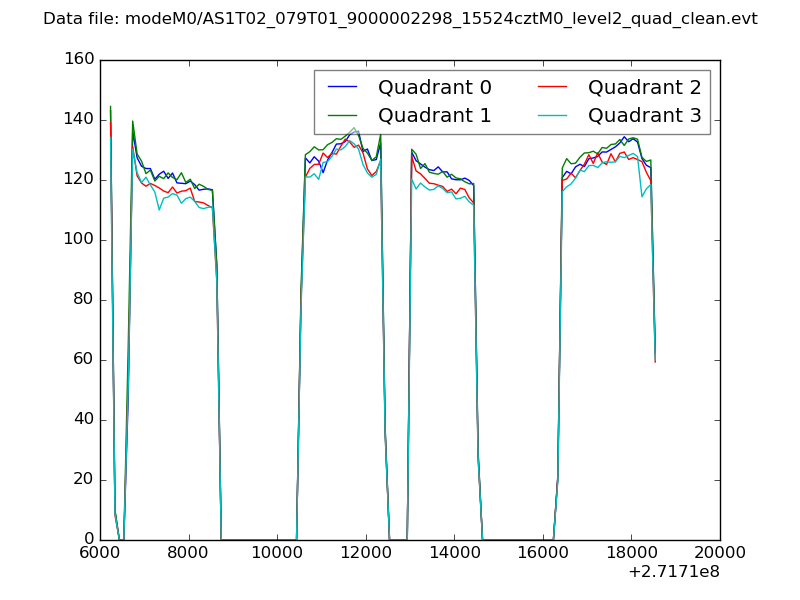 |
|
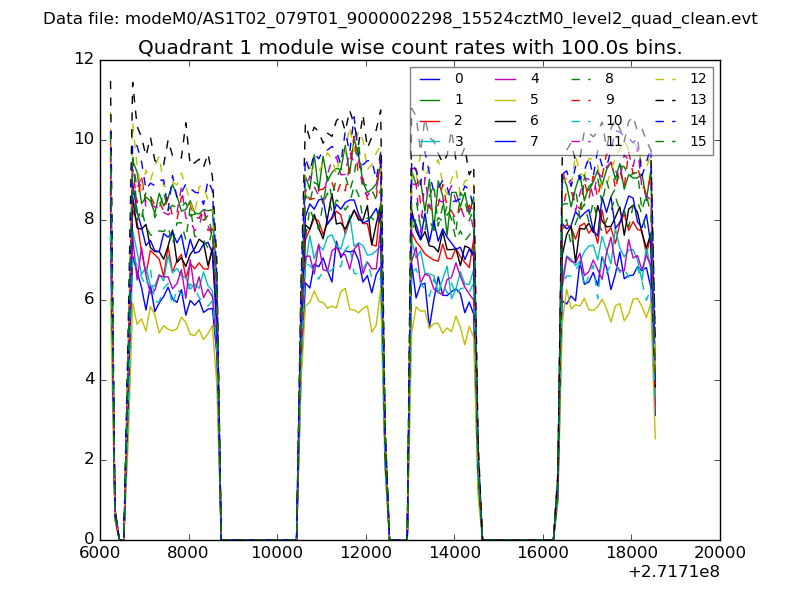
| Module-wise count rates for Quadrant A Data is divided into 100 sec bins |
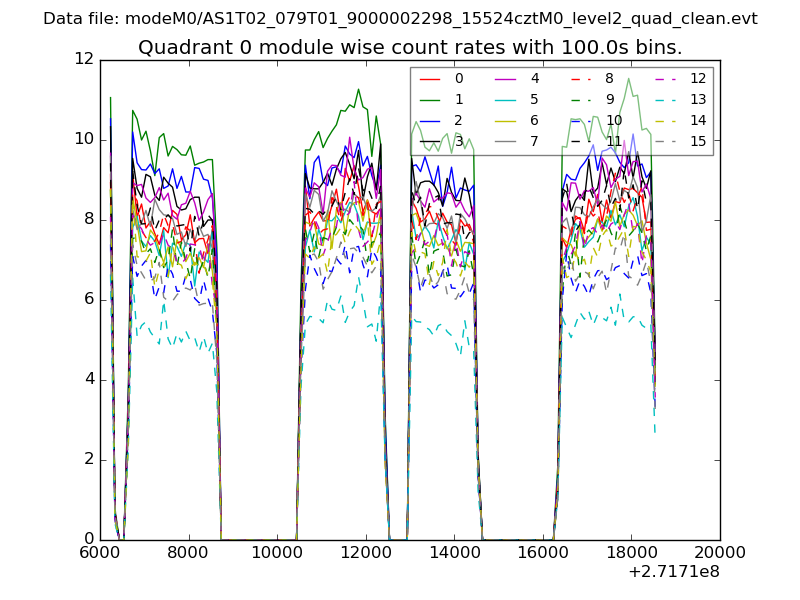 |
 |
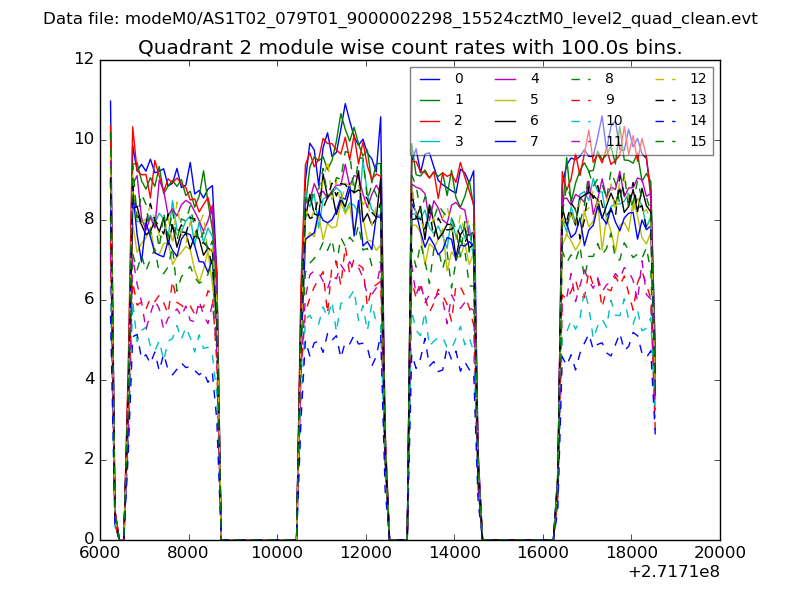
| Module-wise count rates for Quadrant B Data is divided into 100 sec bins |
 |
 |
| Module-wise count rates for Quadrant C Data is divided into 100 sec bins |
 |
 |
| Module-wise count rates for Quadrant D Data is divided into 100 sec bins |
 |
 |
| Parameter | Plot |
|---|---|
| CZT HV Monitor | 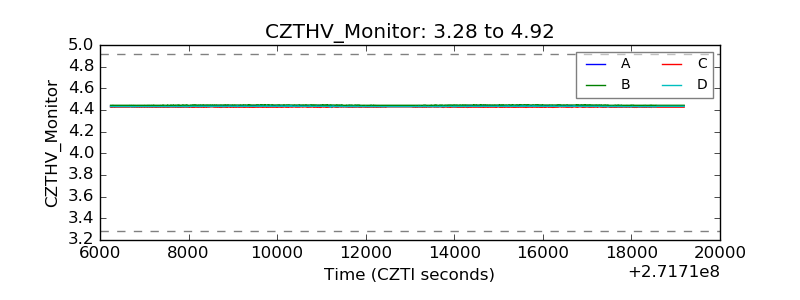 |
| D_VDD | 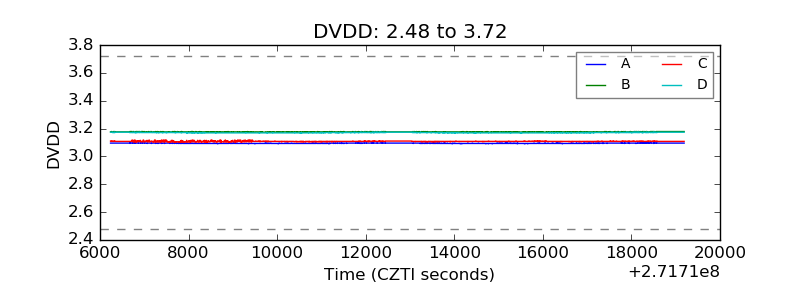 |
| Temperature 1 | 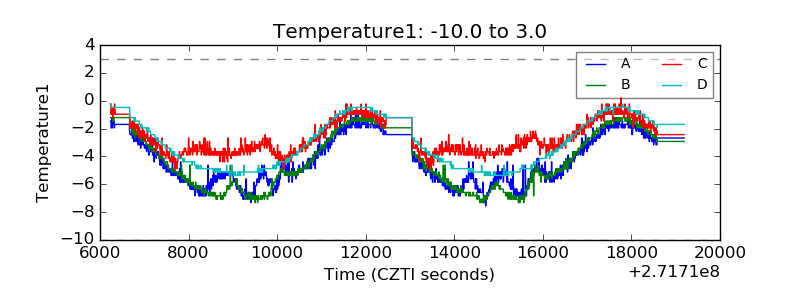 |
| Veto HV Monitor | 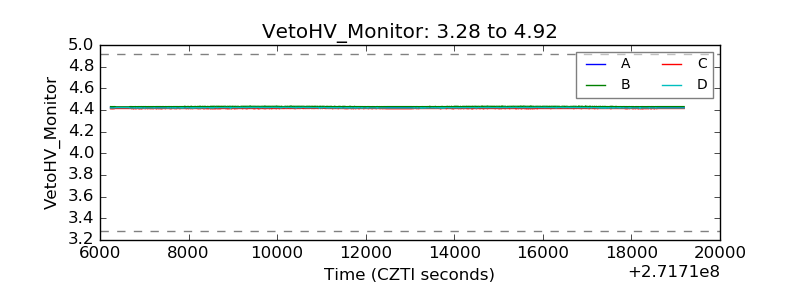 |
| Veto LLD | 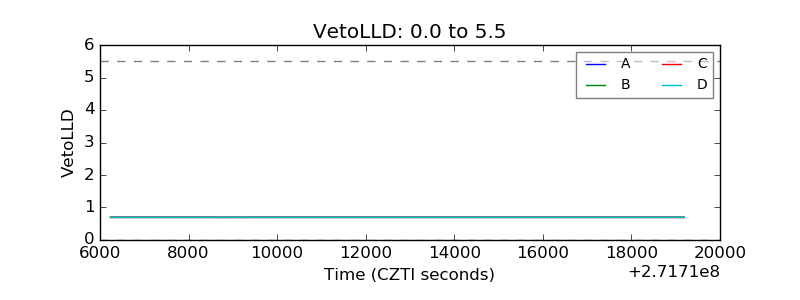 |
| Alpha Counter | 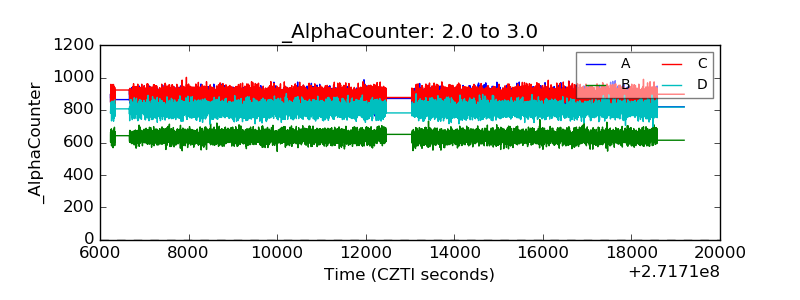 |
| _CPM_Rate | 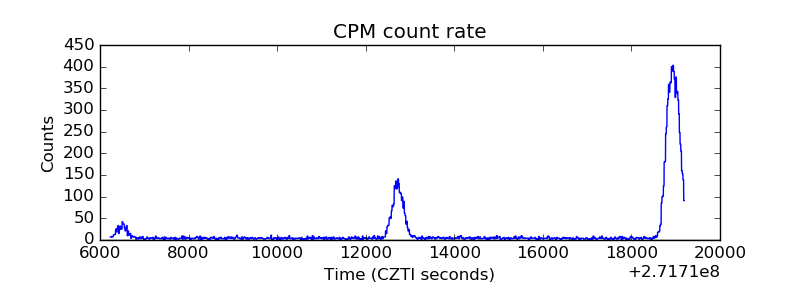 |
| CZT Counter | 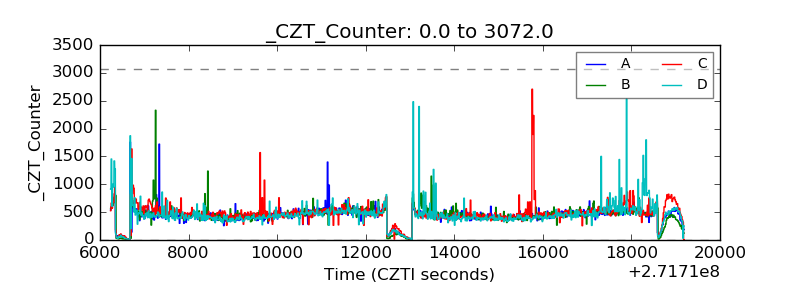 |
| +2.5 Volts monitor |  |
| +5 Volts monitor |  |
| _ROLL_ROT |  |
| _Roll_DEC | 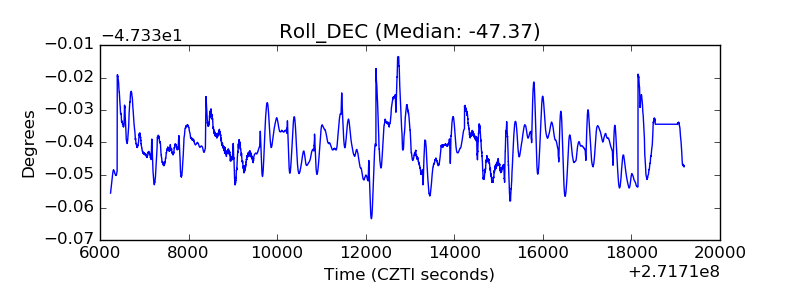 |
| _Roll_RA | 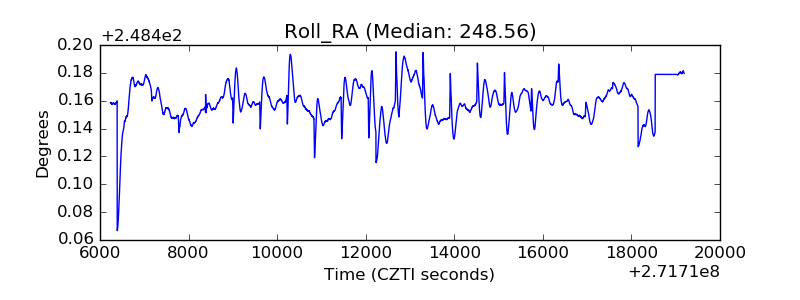 |
| Veto Counter | 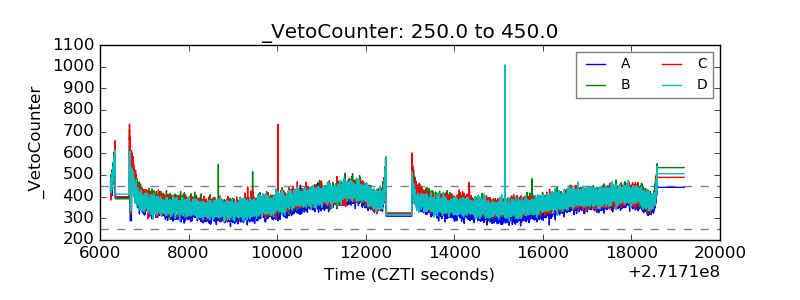 |