| Param | Original file | Final file |
|---|---|---|
| Filename | modeM0/AS1T02_079T01_9000002298_15525cztM0_level2.evt | modeM0/AS1T02_079T01_9000002298_15525cztM0_level2_quad_clean.evt |
| Size (bytes) | 504,293,760 | 95,641,920 |
| Size | 480.9 MB | 91.2 MB |
| Events in quadrant A | 3,467,320 | 601,957 |
| Events in quadrant B | 3,727,384 | 609,486 |
| Events in quadrant C | 3,531,562 | 589,690 |
| Events in quadrant D | 4,038,626 | 575,014 |
| Mode M9 | |||
|---|---|---|---|
| Quadrant | BADHDUFLAG | Total packets | Discarded packets |
| A | 0 | 17 | 0 |
| B | 0 | 17 | 0 |
| C | 0 | 17 | 0 |
| D | 0 | 17 | 0 |
| Mode SS | |||
|---|---|---|---|
| Quadrant | BADHDUFLAG | Total packets | Discarded packets |
| A | 0 | 152 | 0 |
| B | 0 | 152 | 0 |
| C | 0 | 152 | 0 |
| D | 0 | 152 | 0 |
| Mode M0 | |||
|---|---|---|---|
| Quadrant | BADHDUFLAG | Total packets | Discarded packets |
| A | 0 | 15199 | 3 |
| B | 0 | 15814 | 2 |
| C | 0 | 15269 | 2 |
| D | 0 | 17252 | 2 |
| Quadrant | Total seconds | Saturated seconds | Saturation percentage |
|---|---|---|---|
| A | 7482 | 29 | 0.387597% |
| B | 7482 | 60 | 0.801925% |
| C | 7482 | 51 | 0.681636% |
| D | 7482 | 48 | 0.641540% |
Noise dominated data is calculated using 1-second bins in cleaned event files. If a bin has >2000 counts, and if more than 50% of those come from <1% of pixels, then it is considered to be noise-dominated and hence unusable.
| Quadrant | # 1 sec bins | Bins with >0 counts | Bins with >2000 counts | High rate bins dominated by noise | Noise dominated (total time) | Noise dominated (detector-on time) | Marked lightcurve |
|---|---|---|---|---|---|---|---|
| A | 9123 | 7485 | 0 | 0 | 0.00% | 0.00% | 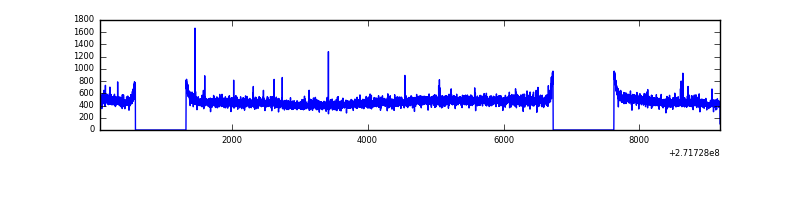 |
| B | 9123 | 7485 | 9 | 9 | 0.10% | 0.12% | 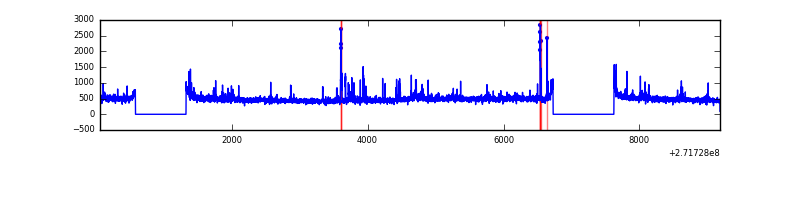 |
| C | 9123 | 7485 | 0 | 0 | 0.00% | 0.00% | 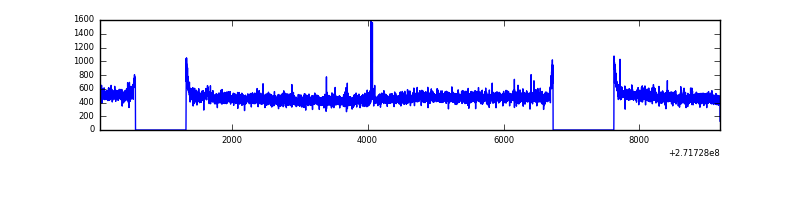 |
| D | 9123 | 7485 | 27 | 27 | 0.30% | 0.36% | 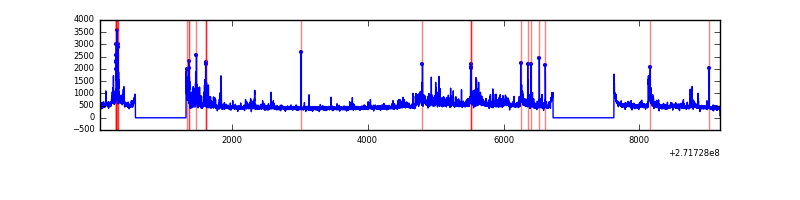 |
Top three noisy pixels from each quadrant. If the there are fewer than three noisy pixels in the level2.evt file, extra rows are filled as -1
| Pixel properties | Quadrant properties | ||||||
|---|---|---|---|---|---|---|---|
| Quadrant | DetID | PixID | Counts | Sigma | Mean | Median | Sigma |
| A | 0 | 253 | 60702 | 330.2 | 885 | 865 | 181.2 |
| A | 0 | 226 | 7732 | 37.89 | 885 | 865 | 181.2 |
| A | 9 | 143 | 7644 | 37.41 | 885 | 865 | 181.2 |
| B | 4 | 173 | 94558 | 551.87 | 888 | 865 | 169.8 |
| B | 4 | 142 | 25573 | 145.53 | 888 | 865 | 169.8 |
| B | 0 | 189 | 23676 | 134.36 | 888 | 865 | 169.8 |
| C | 14 | 238 | 130259 | 649.41 | 850 | 854 | 199.3 |
| C | 3 | 233 | 63604 | 314.91 | 850 | 854 | 199.3 |
| C | 10 | 22 | 16436 | 78.2 | 850 | 854 | 199.3 |
| D | 5 | 222 | 300710 | 1412.06 | 858 | 832 | 212.4 |
| D | 12 | 221 | 297719 | 1397.97 | 858 | 832 | 212.4 |
| D | 1 | 52 | 77651 | 361.72 | 858 | 832 | 212.4 |
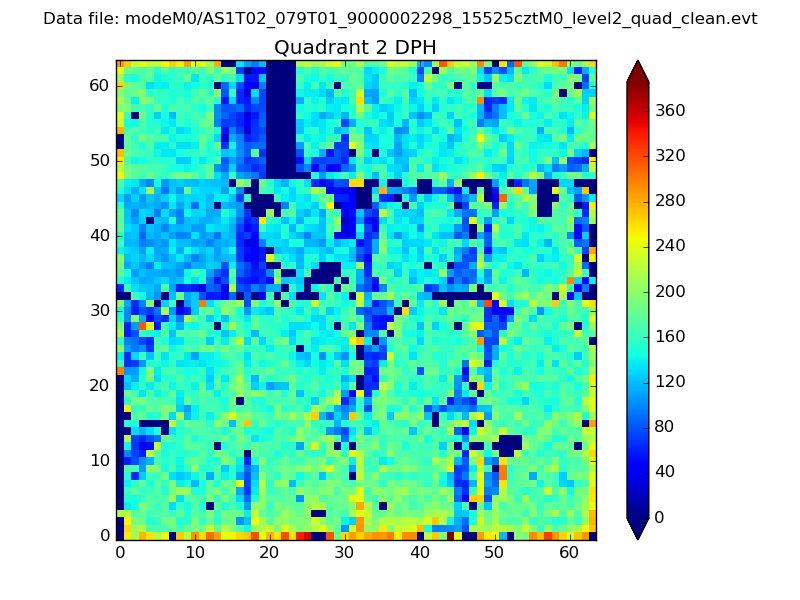
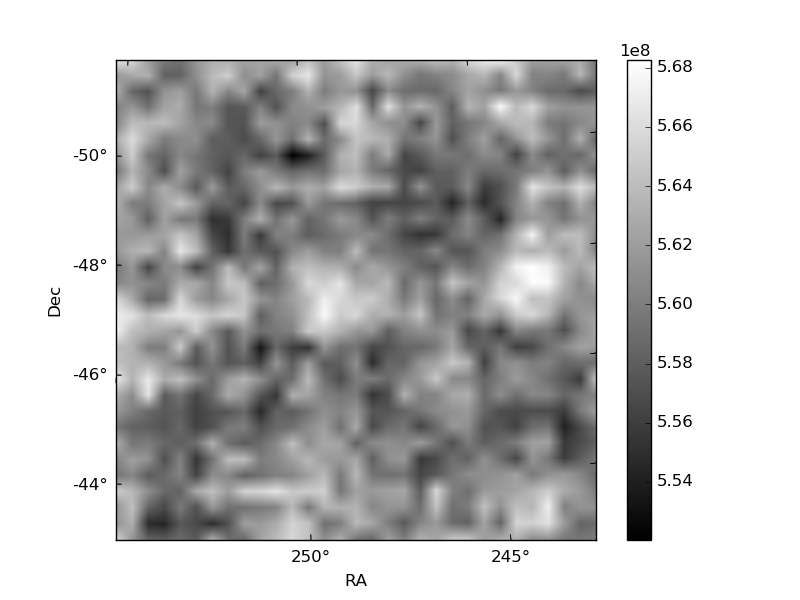
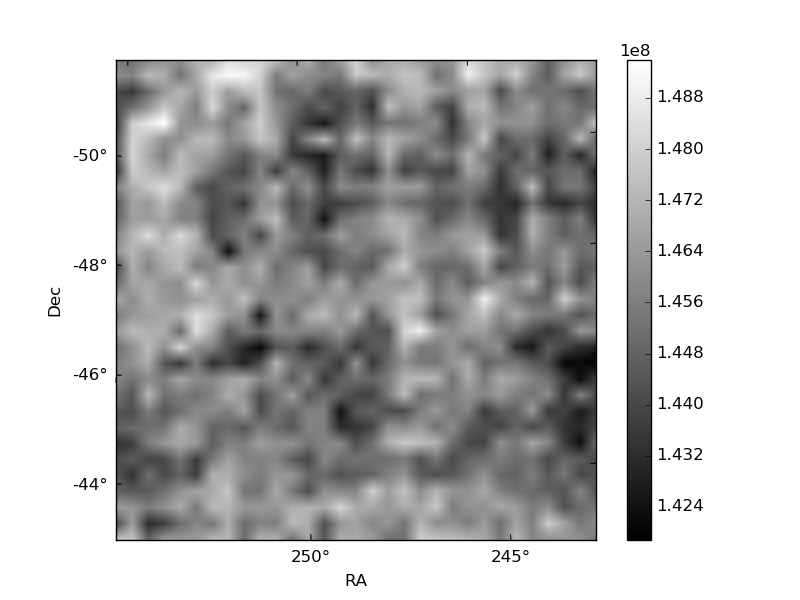
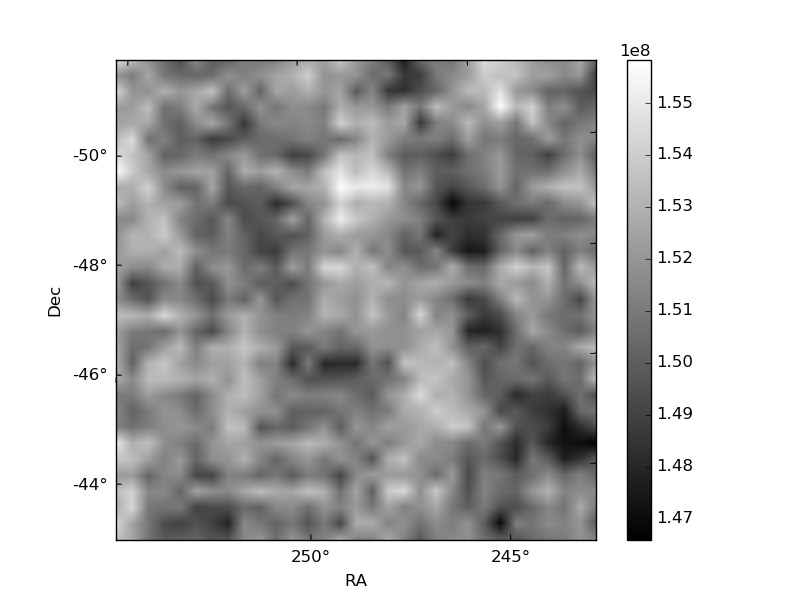
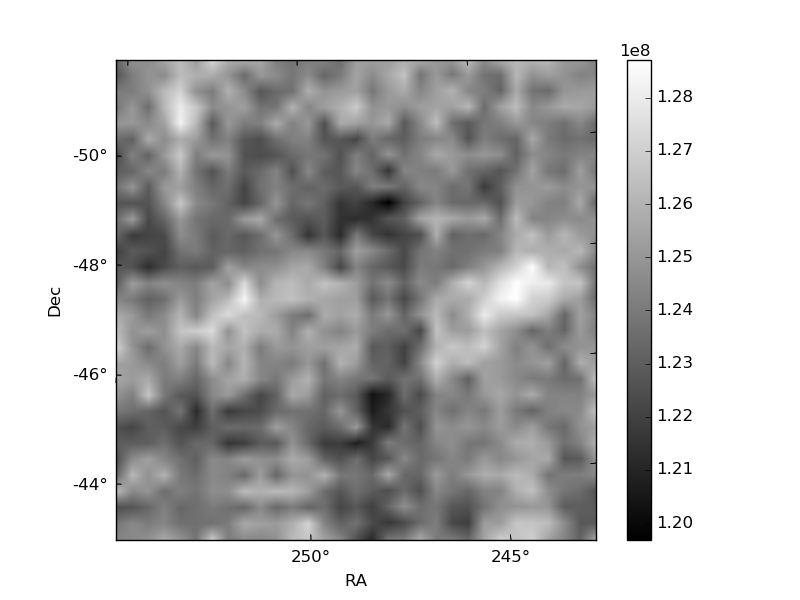
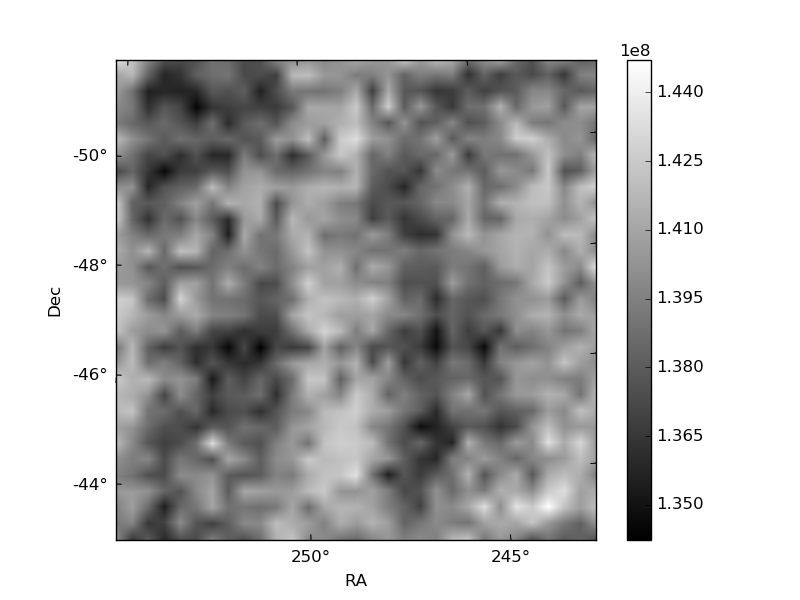
Histogram calculated using DETX and DETY for each event in the final _common_clean file
| Quadrant A | 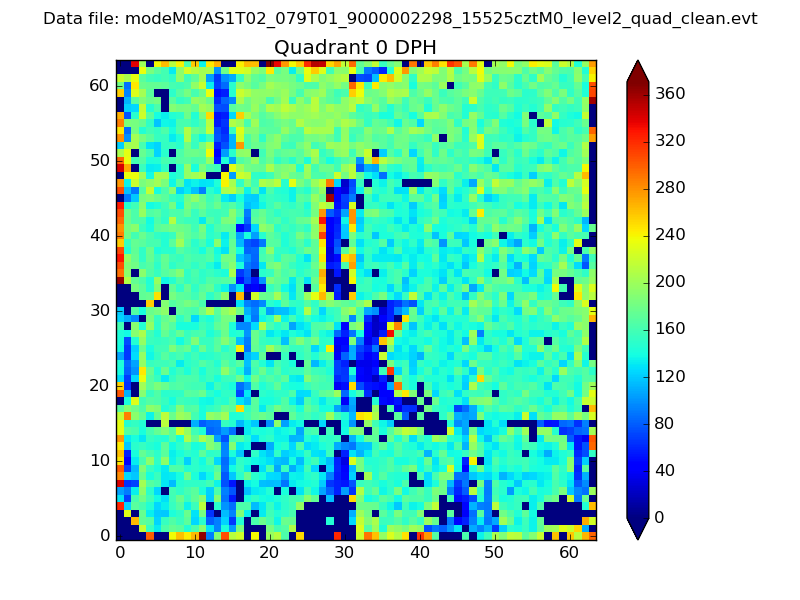 |
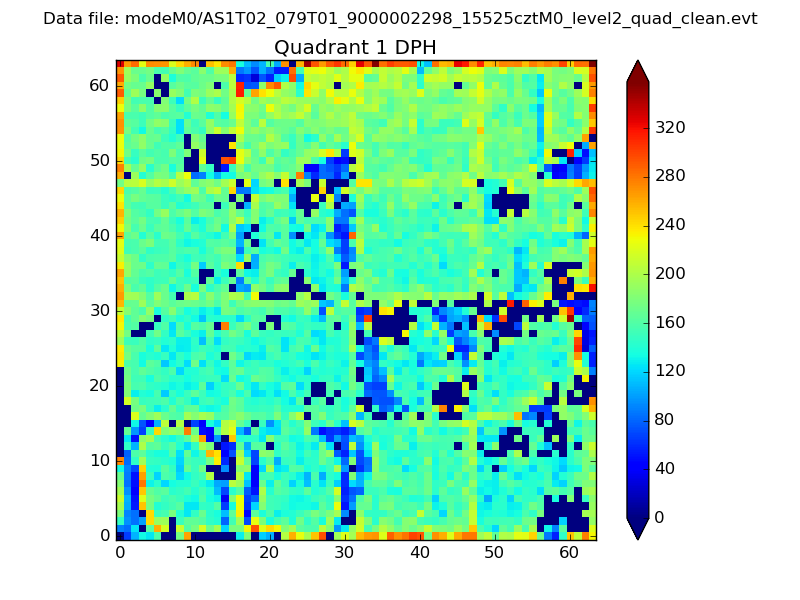 |
Quadrant B |
|---|---|---|---|
| Quadrant D | 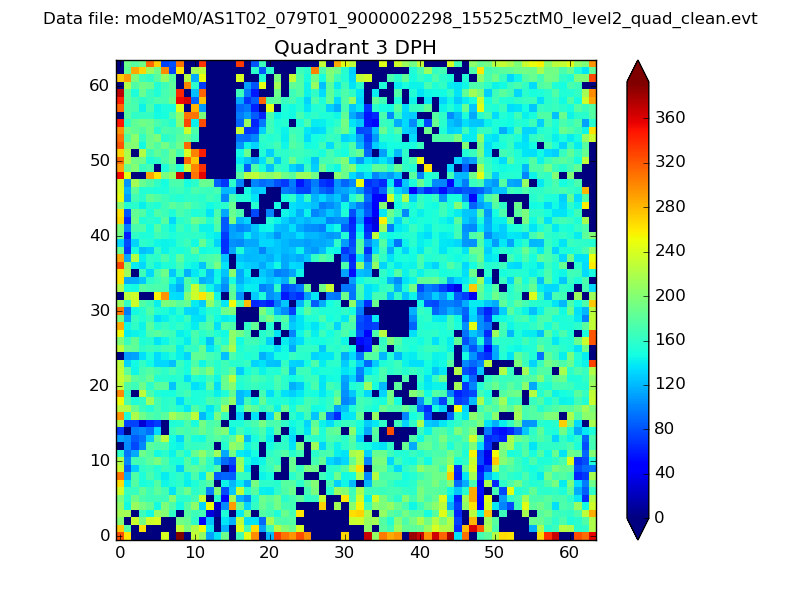 |
 |
Quadrant C |
| Plot type | Count rate plots | Images |
|---|---|---|
| Comparison with Poisson distribution Blue bars denote a histogram of data divided into 1 sec bins. Red curve is a Poisson curve with rate = median count rate of data. |
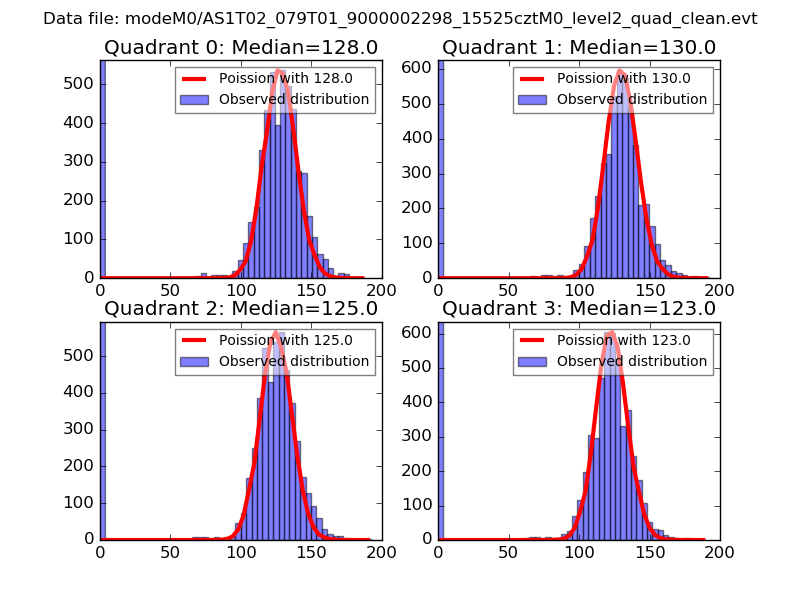 |
 |
| Quadrant-wise count rates Data is divided into 100 sec bins |
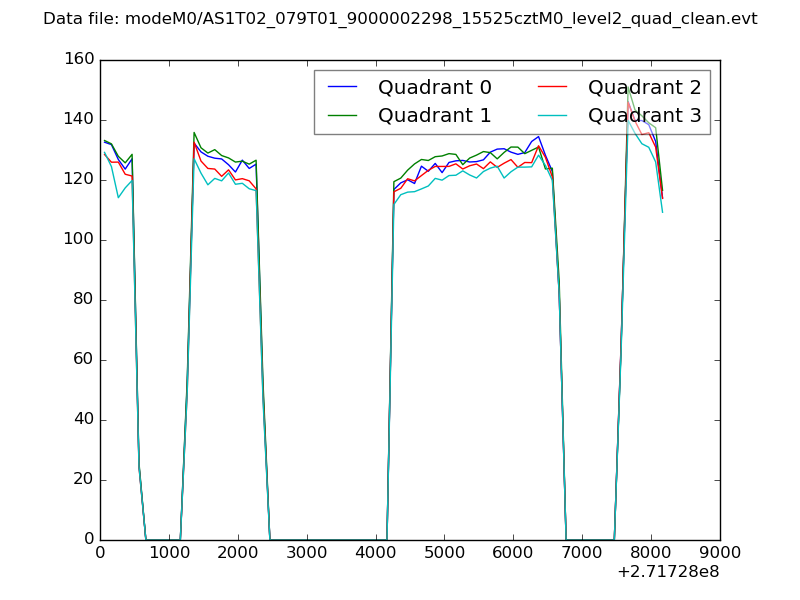 |
|
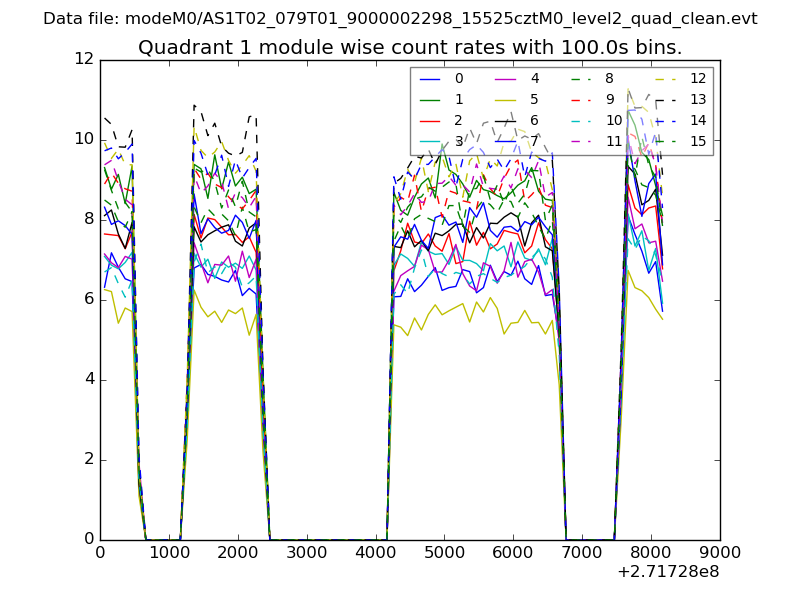
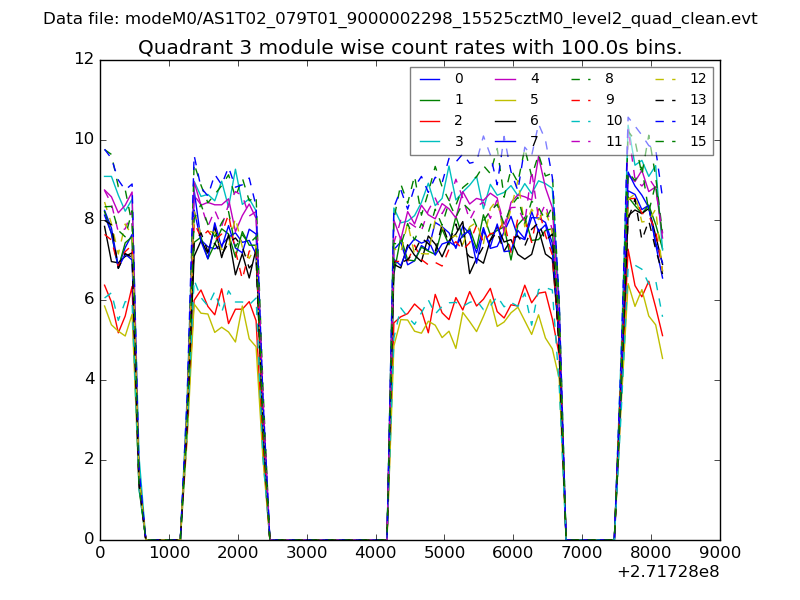
| Module-wise count rates for Quadrant A Data is divided into 100 sec bins |
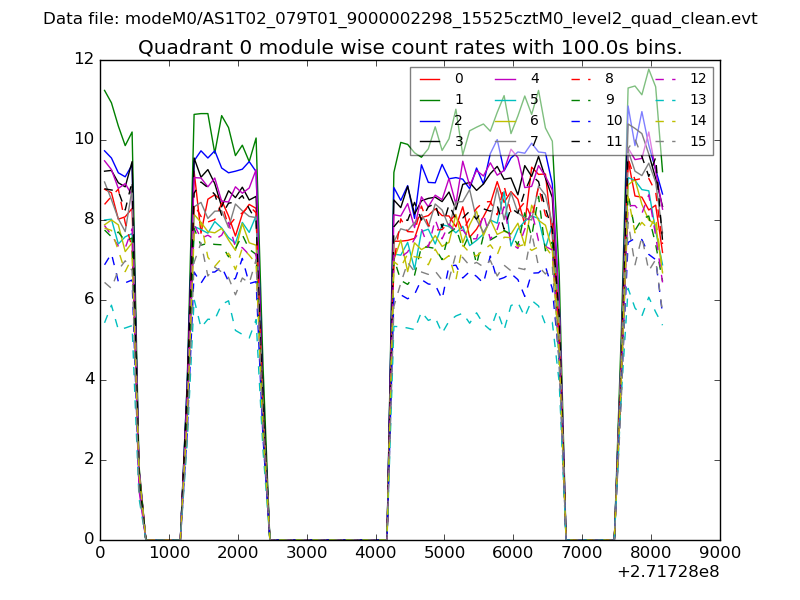 |
 |
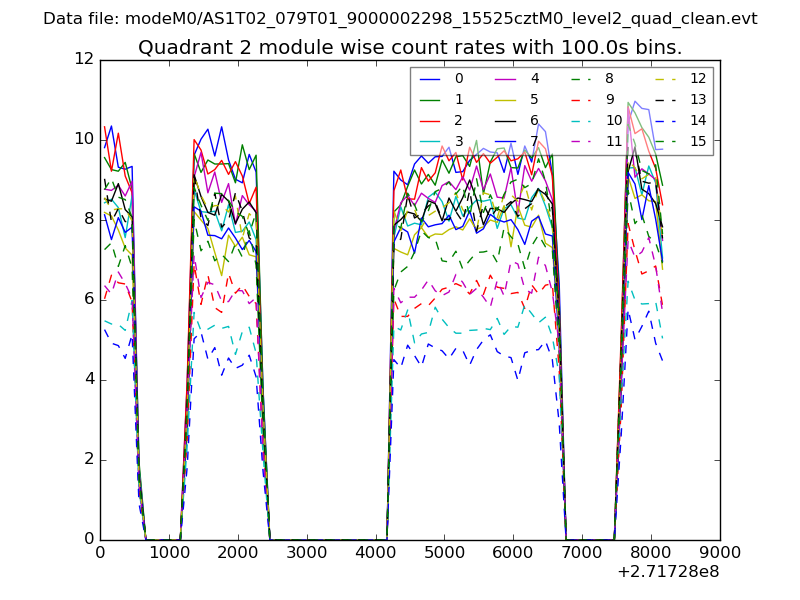
| Module-wise count rates for Quadrant B Data is divided into 100 sec bins |
 |
 |
| Module-wise count rates for Quadrant C Data is divided into 100 sec bins |
 |
 |
| Module-wise count rates for Quadrant D Data is divided into 100 sec bins |
 |
 |
| Parameter | Plot |
|---|---|
| CZT HV Monitor | 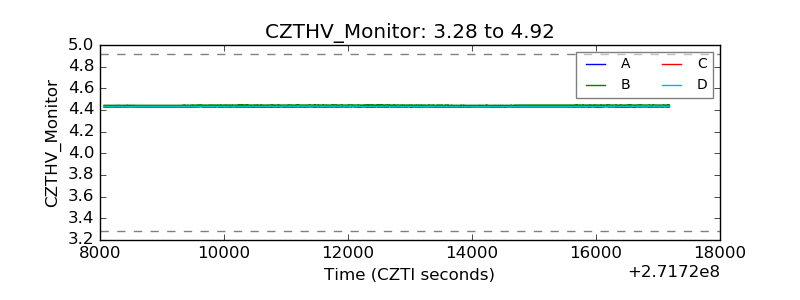 |
| D_VDD | 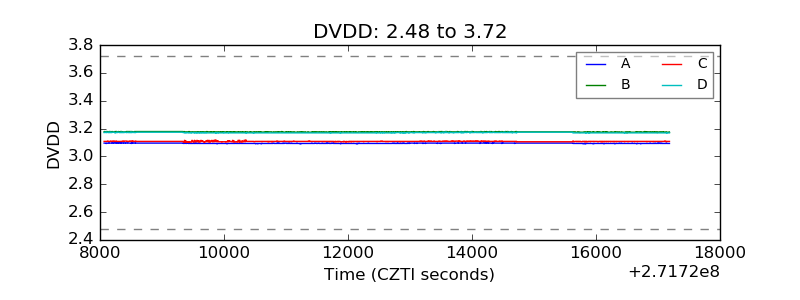 |
| Temperature 1 | 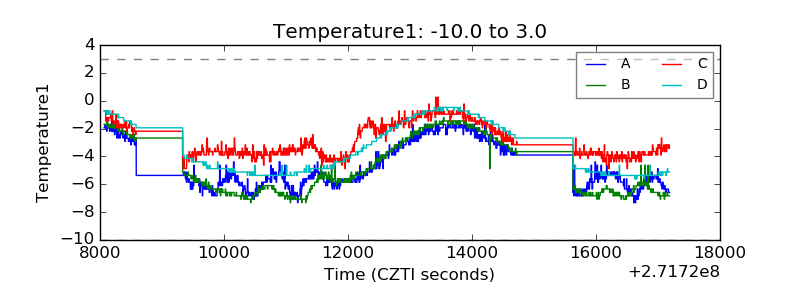 |
| Veto HV Monitor | 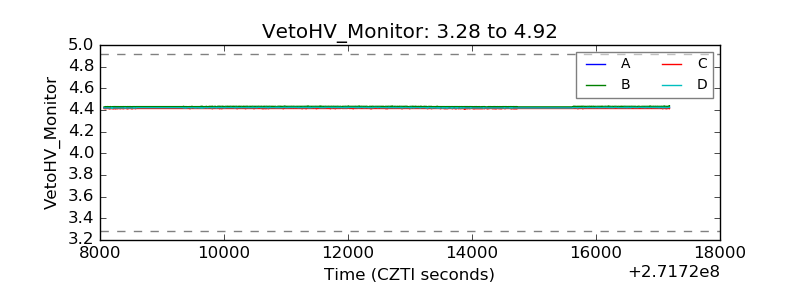 |
| Veto LLD | 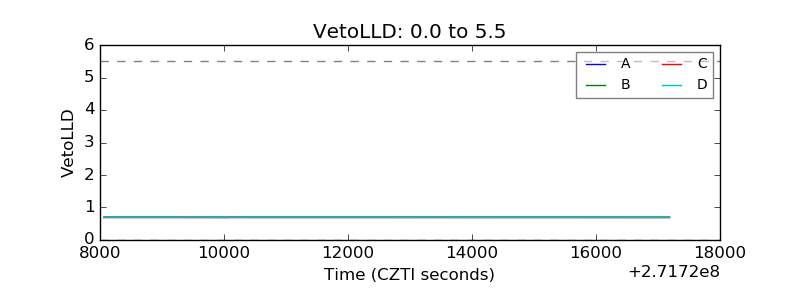 |
| Alpha Counter | 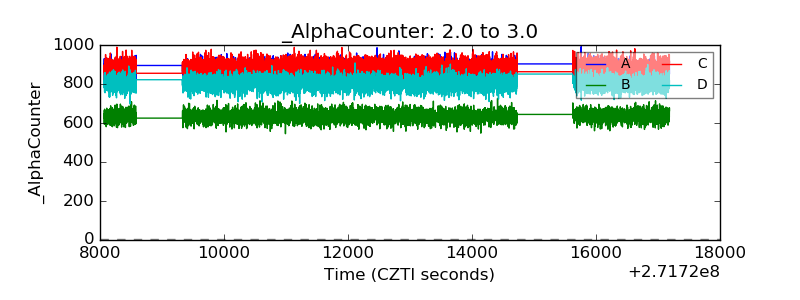 |
| _CPM_Rate | 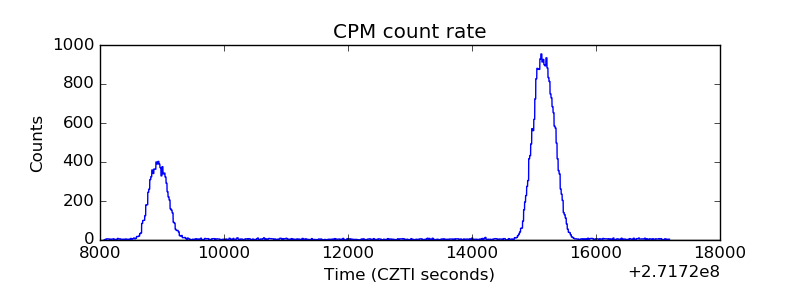 |
| CZT Counter | 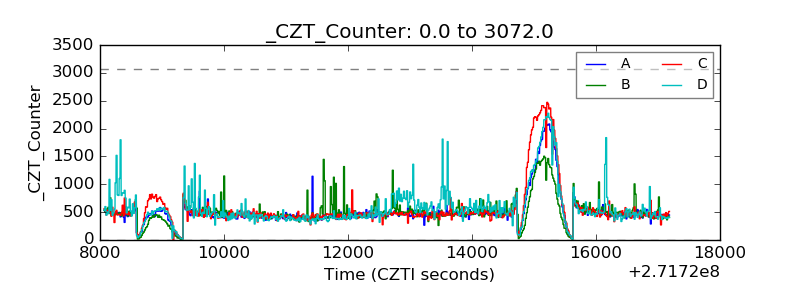 |
| +2.5 Volts monitor |  |
| +5 Volts monitor |  |
| _ROLL_ROT | 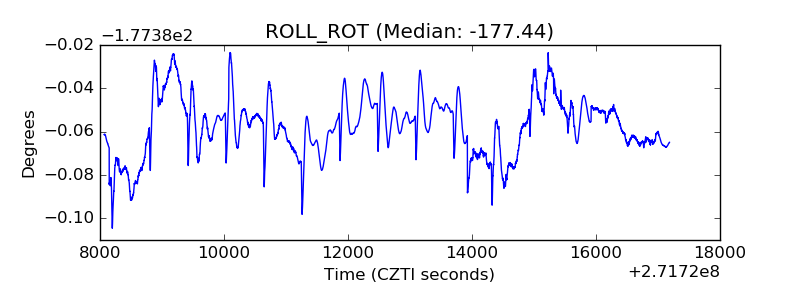 |
| _Roll_DEC | 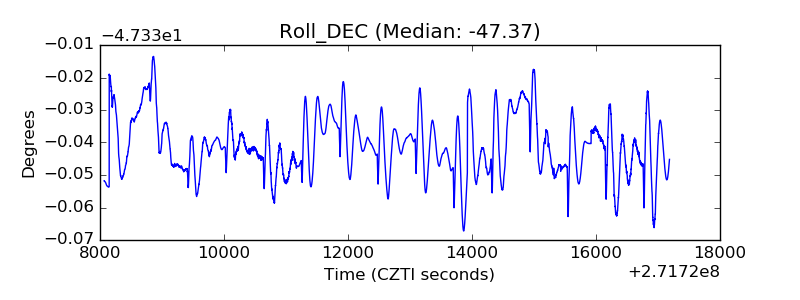 |
| _Roll_RA | 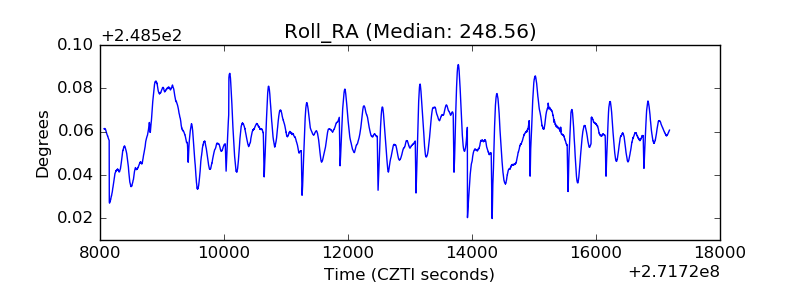 |
| Veto Counter | 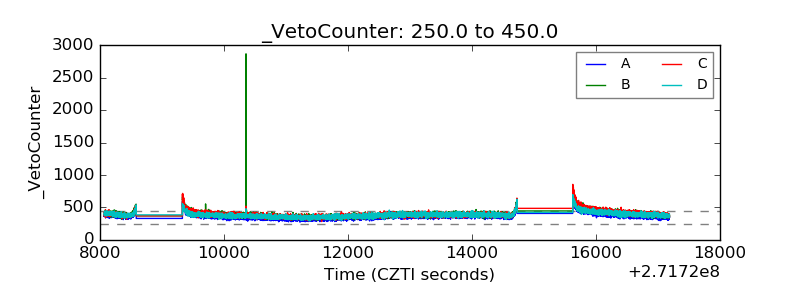 |