| Param | Original file | Final file |
|---|---|---|
| Filename | modeM0/AS1T02_079T01_9000002298_15526cztM0_level2.evt | modeM0/AS1T02_079T01_9000002298_15526cztM0_level2_quad_clean.evt |
| Size (bytes) | 184,144,320 | 24,840,000 |
| Size | 175.6 MB | 23.7 MB |
| Events in quadrant A | 1,305,156 | 135,733 |
| Events in quadrant B | 1,373,142 | 139,490 |
| Events in quadrant C | 1,345,080 | 135,597 |
| Events in quadrant D | 1,351,664 | 131,298 |
| Mode SS | |||
|---|---|---|---|
| Quadrant | BADHDUFLAG | Total packets | Discarded packets |
| A | 0 | 58 | 0 |
| B | 0 | 58 | 0 |
| C | 0 | 58 | 0 |
| D | 0 | 58 | 0 |
| Mode M0 | |||
|---|---|---|---|
| Quadrant | BADHDUFLAG | Total packets | Discarded packets |
| A | 0 | 5886 | 0 |
| B | 0 | 6034 | 0 |
| C | 0 | 5895 | 0 |
| D | 0 | 6097 | 0 |
| Quadrant | Total seconds | Saturated seconds | Saturation percentage |
|---|---|---|---|
| A | 2936 | 0 | 0.000000% |
| B | 2936 | 1 | 0.034060% |
| C | 2936 | 8 | 0.272480% |
| D | 2936 | 1 | 0.034060% |
Noise dominated data is calculated using 1-second bins in cleaned event files. If a bin has >2000 counts, and if more than 50% of those come from <1% of pixels, then it is considered to be noise-dominated and hence unusable.
| Quadrant | # 1 sec bins | Bins with >0 counts | Bins with >2000 counts | High rate bins dominated by noise | Noise dominated (total time) | Noise dominated (detector-on time) | Marked lightcurve |
|---|---|---|---|---|---|---|---|
| A | 2937 | 2937 | 0 | 0 | 0.00% | 0.00% | 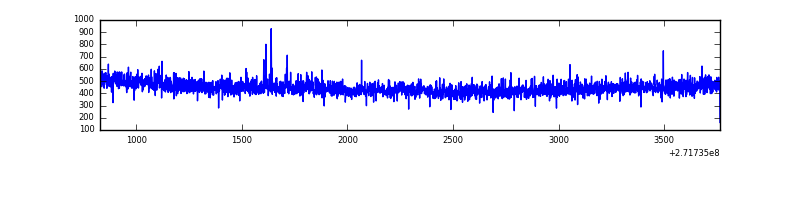 |
| B | 2937 | 2937 | 0 | 0 | 0.00% | 0.00% | 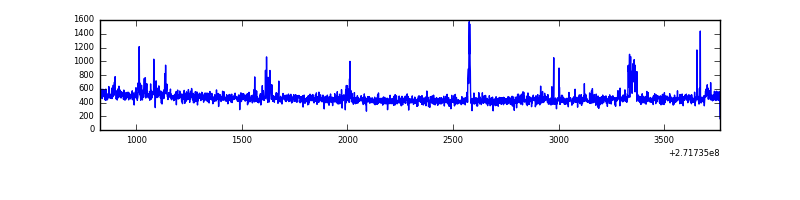 |
| C | 2937 | 2937 | 0 | 0 | 0.00% | 0.00% |  |
| D | 2937 | 2937 | 2 | 2 | 0.07% | 0.07% | 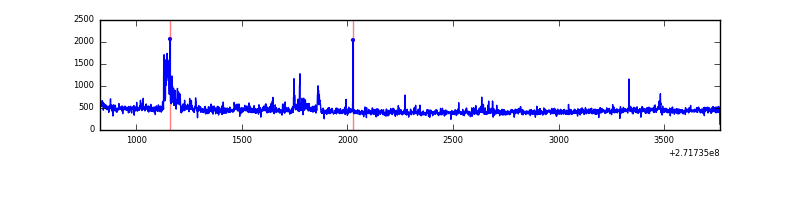 |
Top three noisy pixels from each quadrant. If the there are fewer than three noisy pixels in the level2.evt file, extra rows are filled as -1
| Pixel properties | Quadrant properties | ||||||
|---|---|---|---|---|---|---|---|
| Quadrant | DetID | PixID | Counts | Sigma | Mean | Median | Sigma |
| A | 0 | 253 | 25881 | 377.38 | 332 | 325 | 67.7 |
| A | 0 | 226 | 2888 | 37.85 | 332 | 325 | 67.7 |
| A | 12 | 194 | 2416 | 30.88 | 332 | 325 | 67.7 |
| B | 4 | 173 | 40495 | 612.04 | 337 | 328 | 65.6 |
| B | 0 | 214 | 10517 | 155.25 | 337 | 328 | 65.6 |
| B | 12 | 111 | 7700 | 112.33 | 337 | 328 | 65.6 |
| C | 14 | 238 | 51300 | 660.47 | 327 | 328 | 77.2 |
| C | 3 | 233 | 17584 | 223.6 | 327 | 328 | 77.2 |
| C | 13 | 61 | 2261 | 25.05 | 327 | 328 | 77.2 |
| D | 5 | 222 | 73609 | 907.5 | 326 | 316 | 80.8 |
| D | 1 | 52 | 33323 | 408.69 | 326 | 316 | 80.8 |
| D | 5 | 51 | 12547 | 151.44 | 326 | 316 | 80.8 |
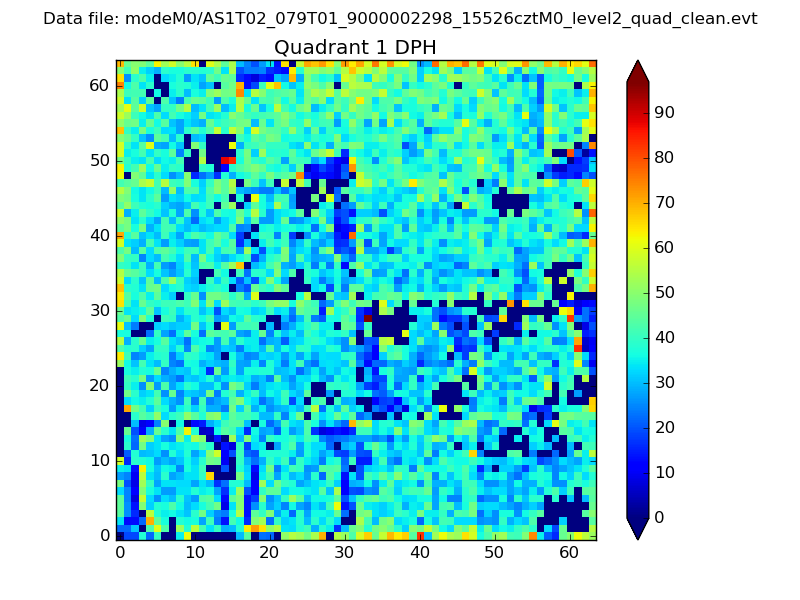
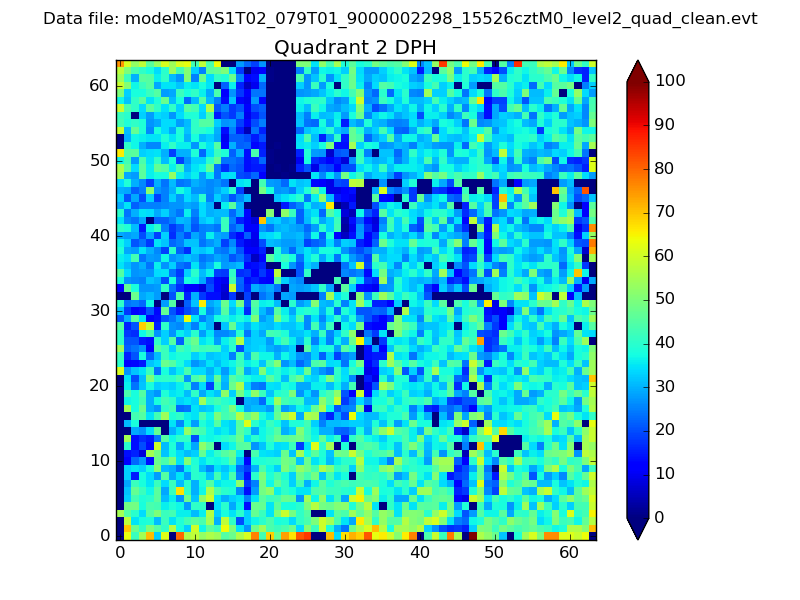
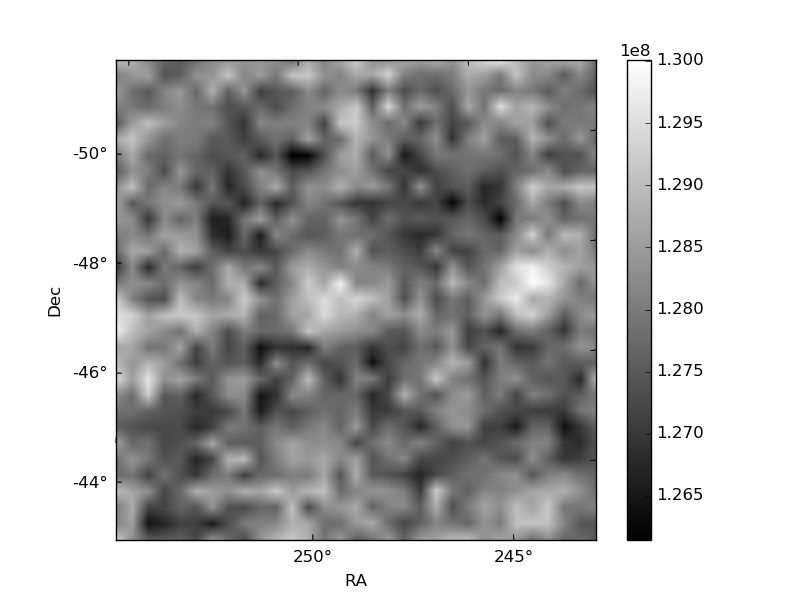
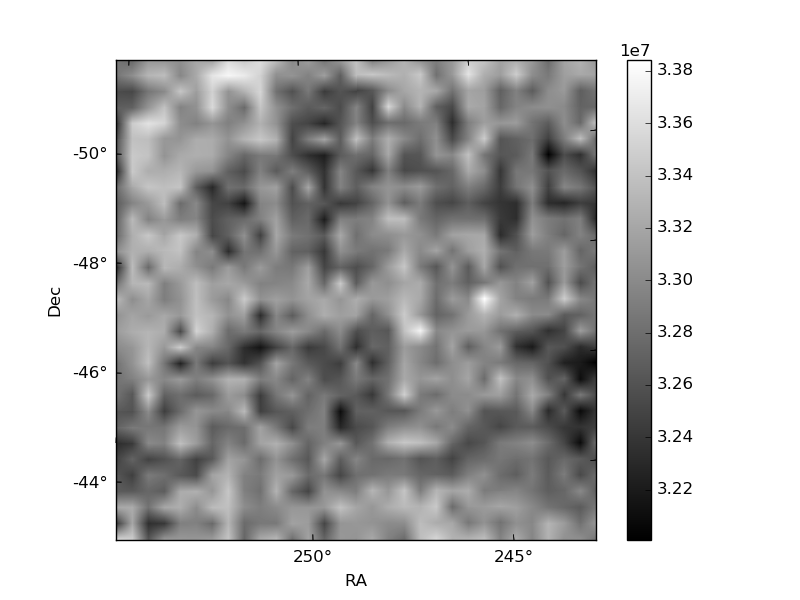
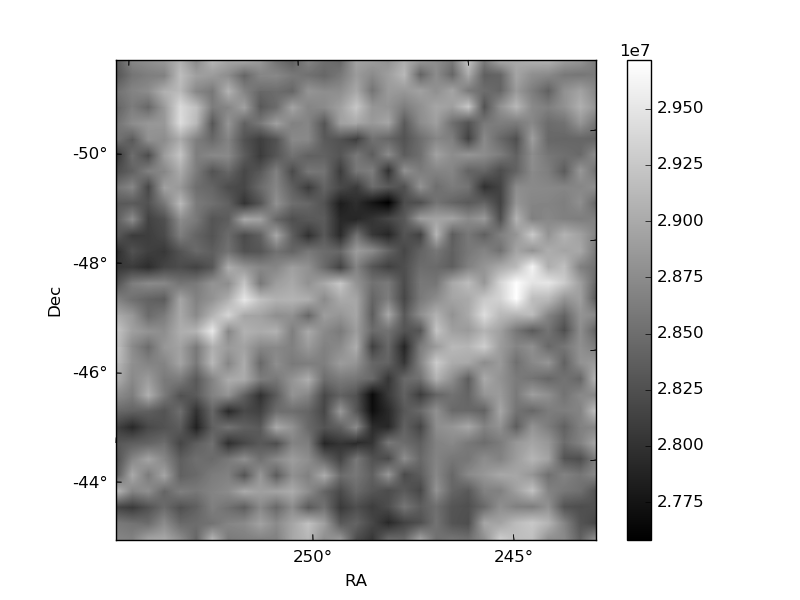
Histogram calculated using DETX and DETY for each event in the final _common_clean file
| Quadrant A | 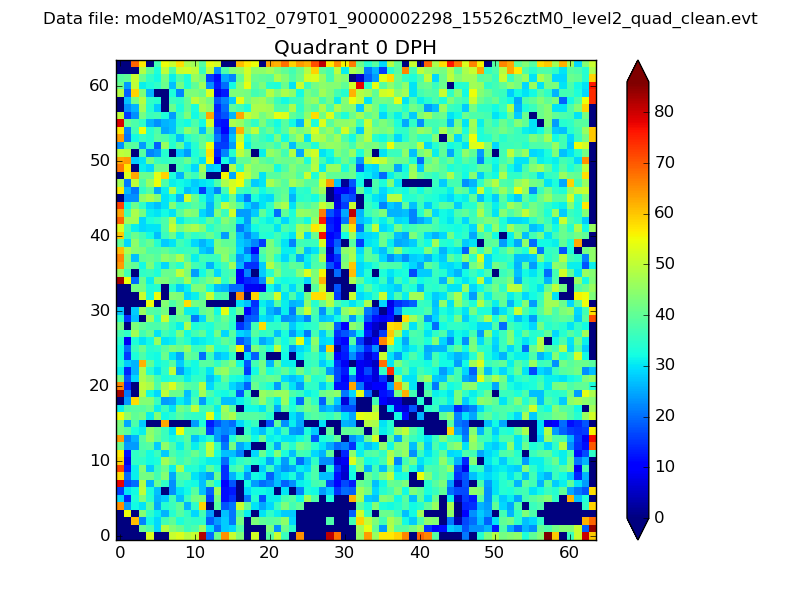 |
 |
Quadrant B |
|---|---|---|---|
| Quadrant D | 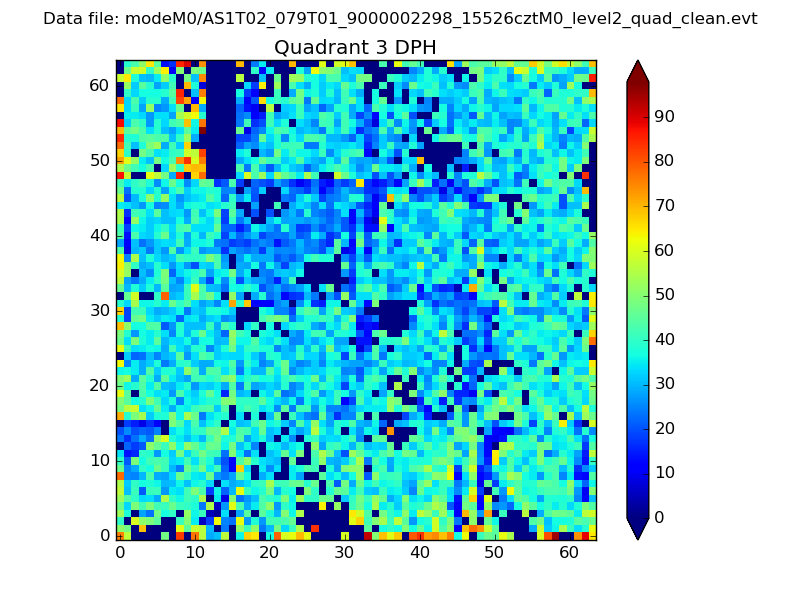 |
 |
Quadrant C |
| Plot type | Count rate plots | Images |
|---|---|---|
| Comparison with Poisson distribution Blue bars denote a histogram of data divided into 1 sec bins. Red curve is a Poisson curve with rate = median count rate of data. |
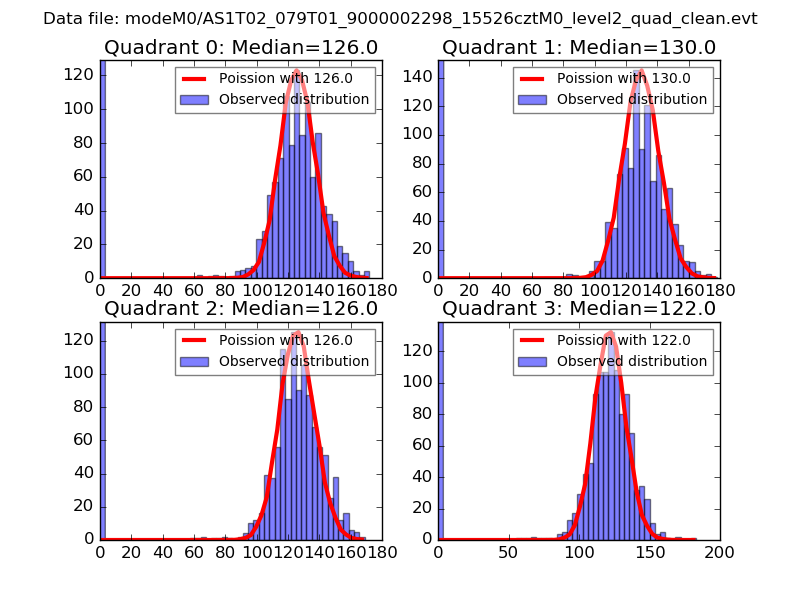 |
 |
| Quadrant-wise count rates Data is divided into 100 sec bins |
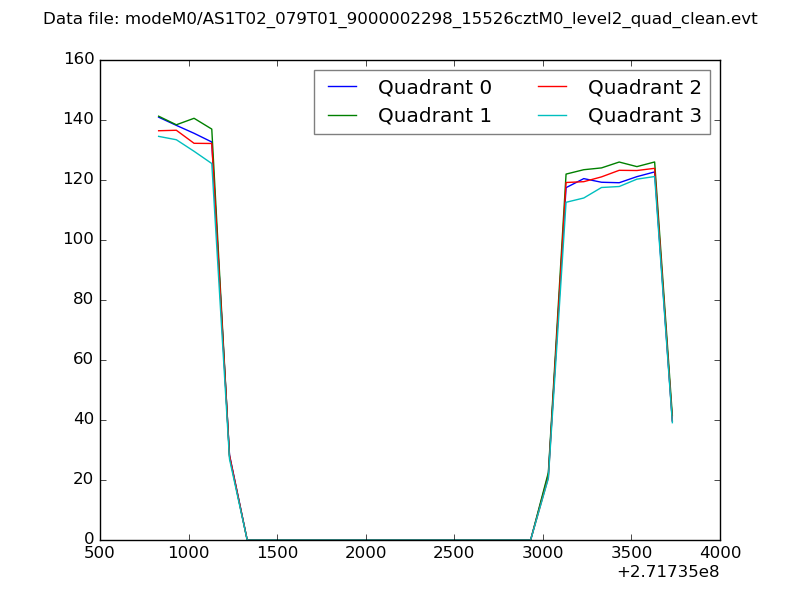 |
|
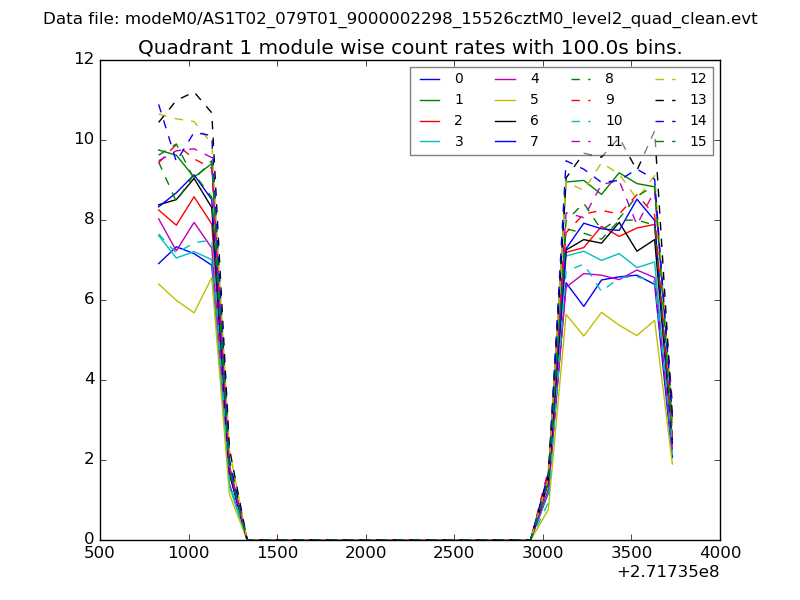
| Module-wise count rates for Quadrant A Data is divided into 100 sec bins |
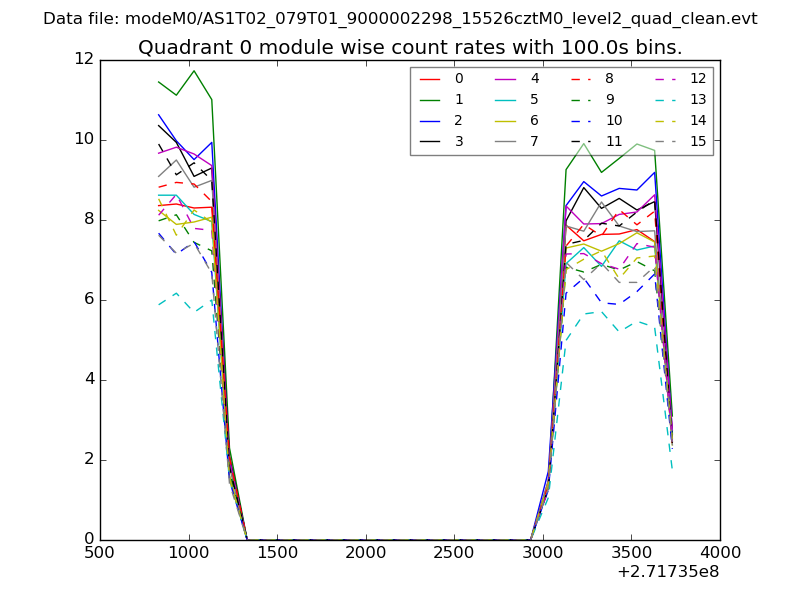 |
 |
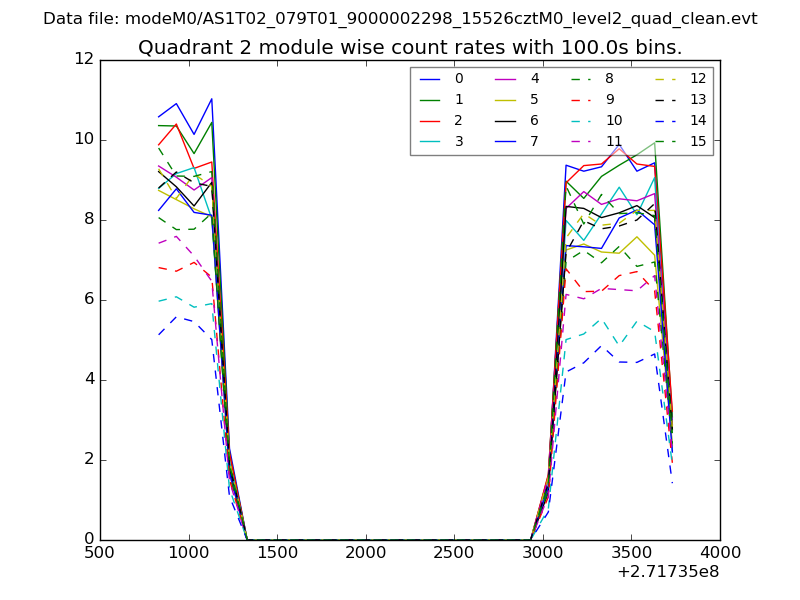
| Module-wise count rates for Quadrant B Data is divided into 100 sec bins |
 |
 |
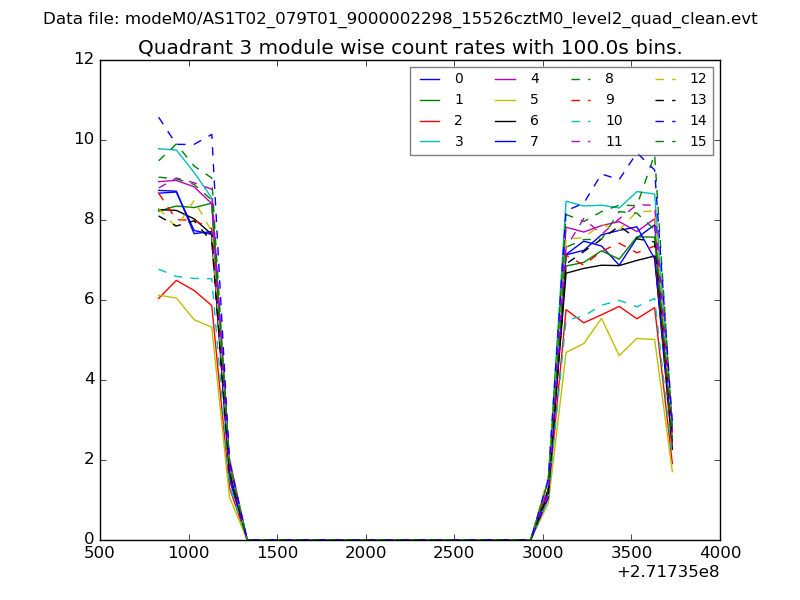
| Module-wise count rates for Quadrant C Data is divided into 100 sec bins |
 |
 |
| Module-wise count rates for Quadrant D Data is divided into 100 sec bins |
 |
 |
| Parameter | Plot |
|---|---|
| CZT HV Monitor | 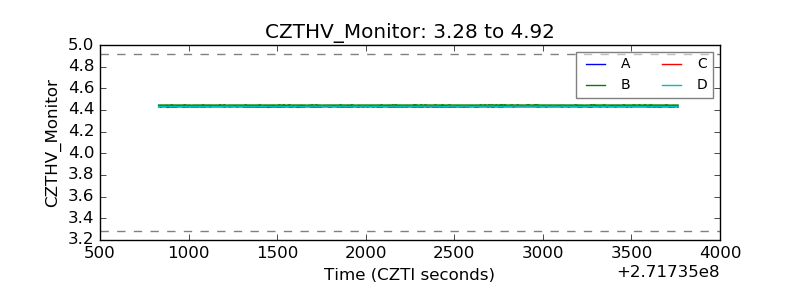 |
| D_VDD | 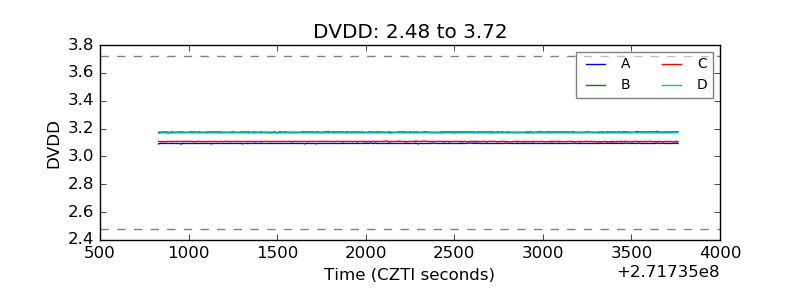 |
| Temperature 1 | 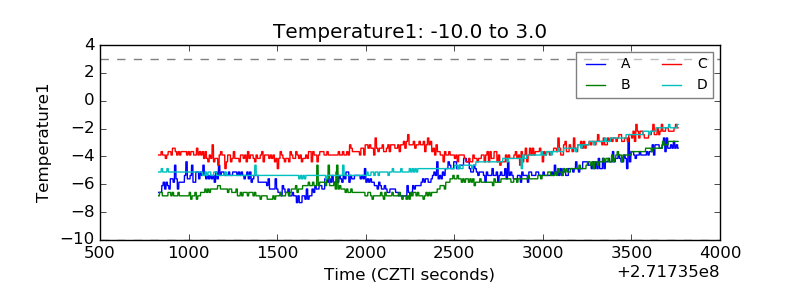 |
| Veto HV Monitor | 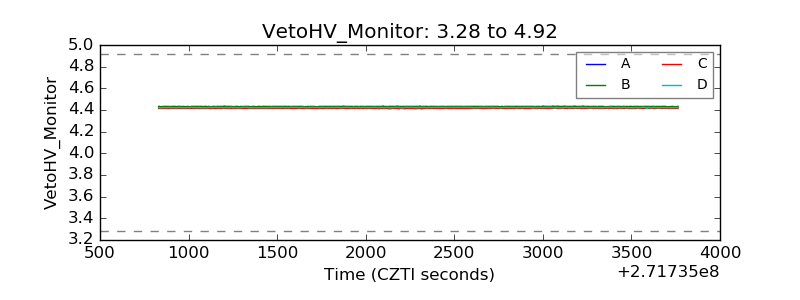 |
| Veto LLD | 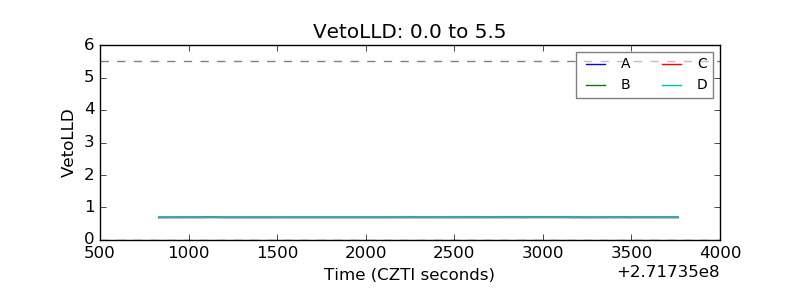 |
| Alpha Counter | 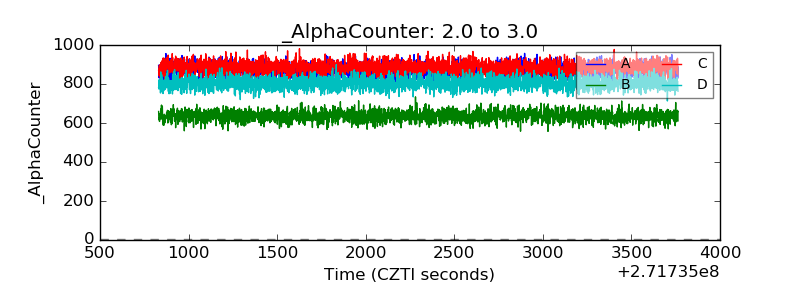 |
| _CPM_Rate | 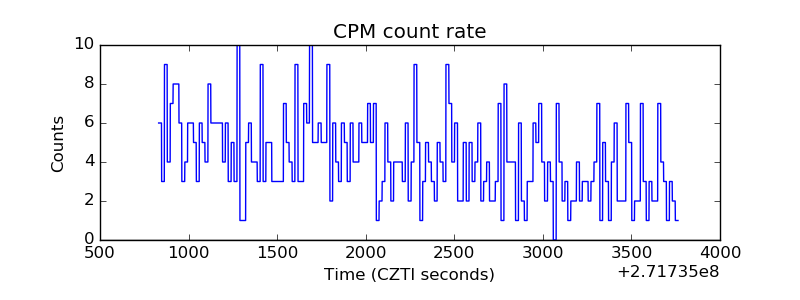 |
| CZT Counter | 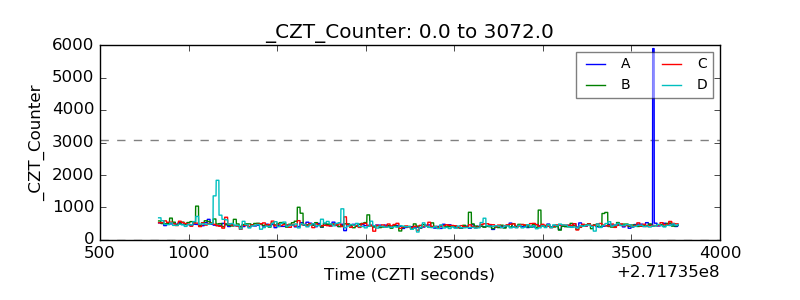 |
| +2.5 Volts monitor | 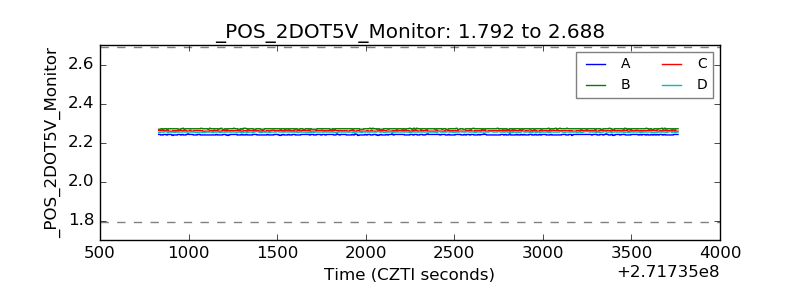 |
| +5 Volts monitor |  |
| _ROLL_ROT | 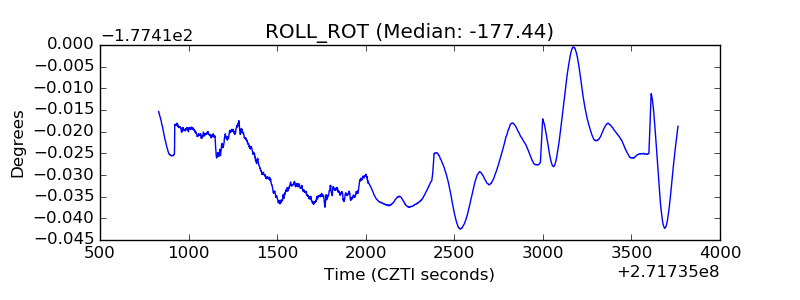 |
| _Roll_DEC | 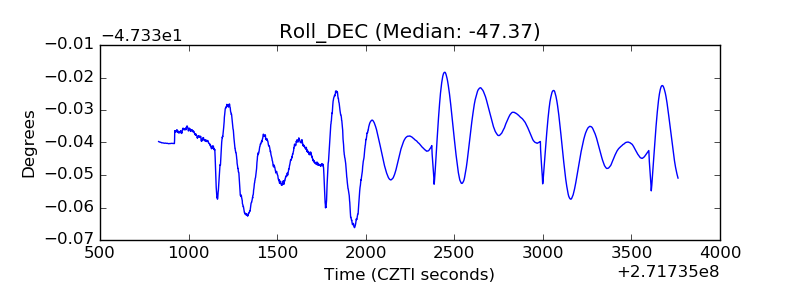 |
| _Roll_RA |  |
| Veto Counter | 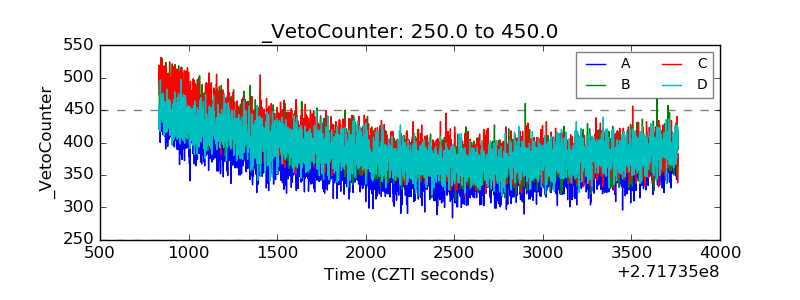 |