| Param | Original file | Final file |
|---|---|---|
| Filename | modeM0/AS1G08_058T09_9000002300_15528cztM0_level2.evt | modeM0/AS1G08_058T09_9000002300_15528cztM0_level2_quad_clean.evt |
| Size (bytes) | 454,821,120 | 94,227,840 |
| Size | 433.8 MB | 89.9 MB |
| Events in quadrant A | 3,264,180 | 613,160 |
| Events in quadrant B | 3,339,365 | 618,666 |
| Events in quadrant C | 3,242,484 | 583,561 |
| Events in quadrant D | 3,483,241 | 581,627 |
| Mode M0 | |||
|---|---|---|---|
| Quadrant | BADHDUFLAG | Total packets | Discarded packets |
| A | 0 | 13589 | 3 |
| B | 0 | 13841 | 2 |
| C | 0 | 13610 | 2 |
| D | 0 | 14613 | 2 |
| Mode M9 | |||
|---|---|---|---|
| Quadrant | BADHDUFLAG | Total packets | Discarded packets |
| A | 0 | 15 | 0 |
| B | 0 | 15 | 0 |
| C | 0 | 15 | 0 |
| D | 0 | 16 | 0 |
| Mode SS | |||
|---|---|---|---|
| Quadrant | BADHDUFLAG | Total packets | Discarded packets |
| A | 0 | 132 | 0 |
| B | 0 | 132 | 0 |
| C | 0 | 132 | 0 |
| D | 0 | 132 | 0 |
| Quadrant | Total seconds | Saturated seconds | Saturation percentage |
|---|---|---|---|
| A | 6552 | 49 | 0.747863% |
| B | 6552 | 70 | 1.068376% |
| C | 6552 | 69 | 1.053114% |
| D | 6552 | 35 | 0.534188% |
Noise dominated data is calculated using 1-second bins in cleaned event files. If a bin has >2000 counts, and if more than 50% of those come from <1% of pixels, then it is considered to be noise-dominated and hence unusable.
| Quadrant | # 1 sec bins | Bins with >0 counts | Bins with >2000 counts | High rate bins dominated by noise | Noise dominated (total time) | Noise dominated (detector-on time) | Marked lightcurve |
|---|---|---|---|---|---|---|---|
| A | 7718 | 6553 | 0 | 0 | 0.00% | 0.00% | 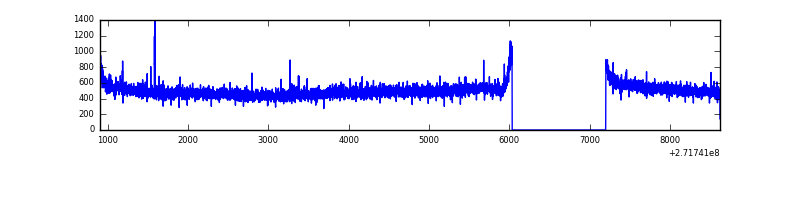 |
| B | 7718 | 6553 | 5 | 5 | 0.06% | 0.08% | 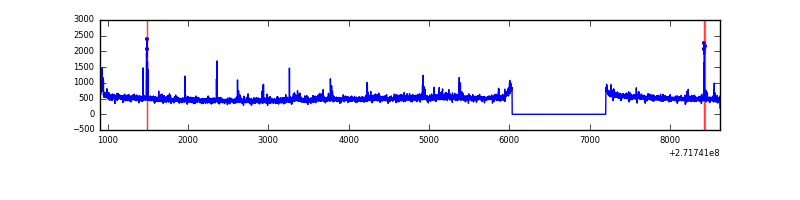 |
| C | 7718 | 6553 | 0 | 0 | 0.00% | 0.00% | 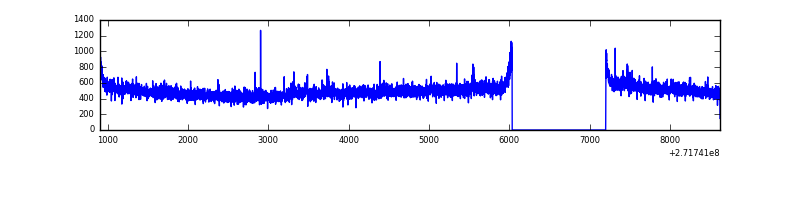 |
| D | 7718 | 6554 | 3 | 3 | 0.04% | 0.05% | 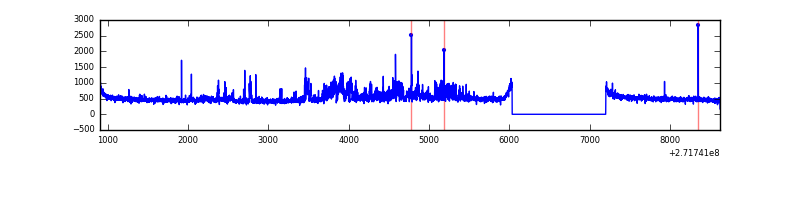 |
Top three noisy pixels from each quadrant. If the there are fewer than three noisy pixels in the level2.evt file, extra rows are filled as -1
| Pixel properties | Quadrant properties | ||||||
|---|---|---|---|---|---|---|---|
| Quadrant | DetID | PixID | Counts | Sigma | Mean | Median | Sigma |
| A | 0 | 253 | 60857 | 359.92 | 829 | 814 | 166.8 |
| A | 9 | 143 | 12020 | 67.17 | 829 | 814 | 166.8 |
| A | 0 | 226 | 7451 | 39.78 | 829 | 814 | 166.8 |
| B | 4 | 173 | 31244 | 194.62 | 822 | 802 | 156.4 |
| B | 0 | 189 | 27751 | 172.29 | 822 | 802 | 156.4 |
| B | 15 | 222 | 26745 | 165.86 | 822 | 802 | 156.4 |
| C | 14 | 238 | 122590 | 672.2 | 781 | 787 | 181.2 |
| C | 3 | 233 | 47554 | 258.1 | 781 | 787 | 181.2 |
| C | 7 | 247 | 20558 | 109.11 | 781 | 787 | 181.2 |
| D | 12 | 110 | 308472 | 1569.71 | 804 | 782 | 196.0 |
| D | 5 | 222 | 69408 | 350.1 | 804 | 782 | 196.0 |
| D | 2 | 234 | 23652 | 116.67 | 804 | 782 | 196.0 |
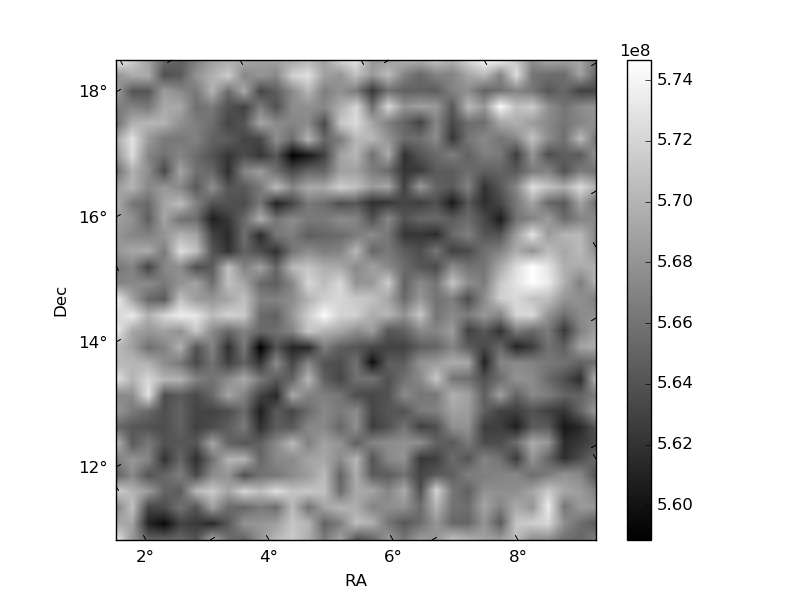
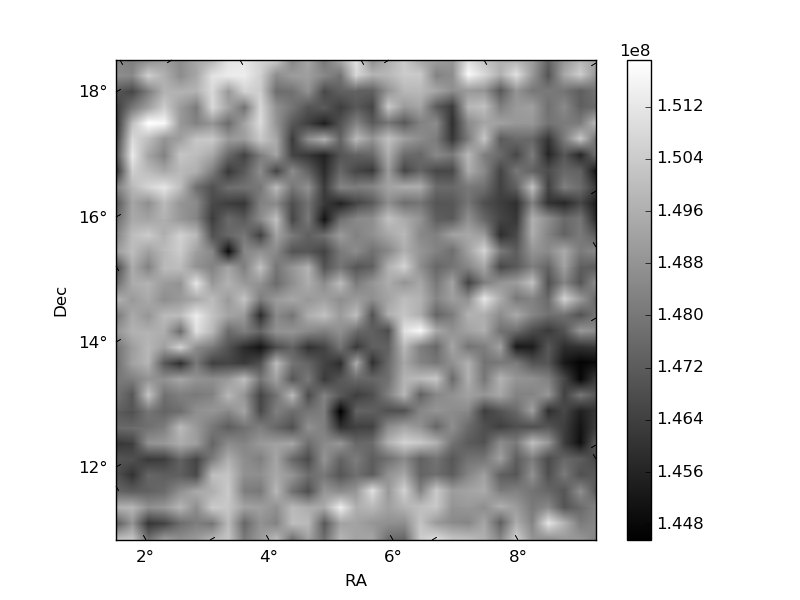
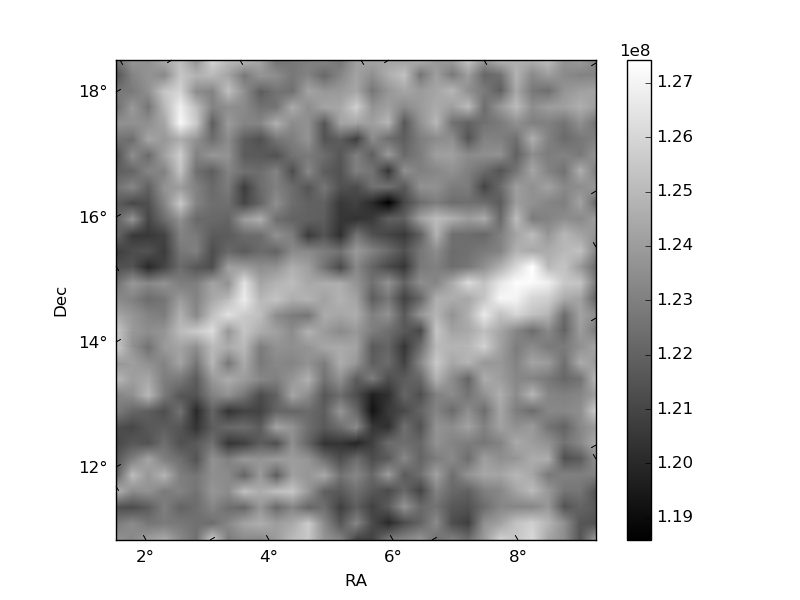
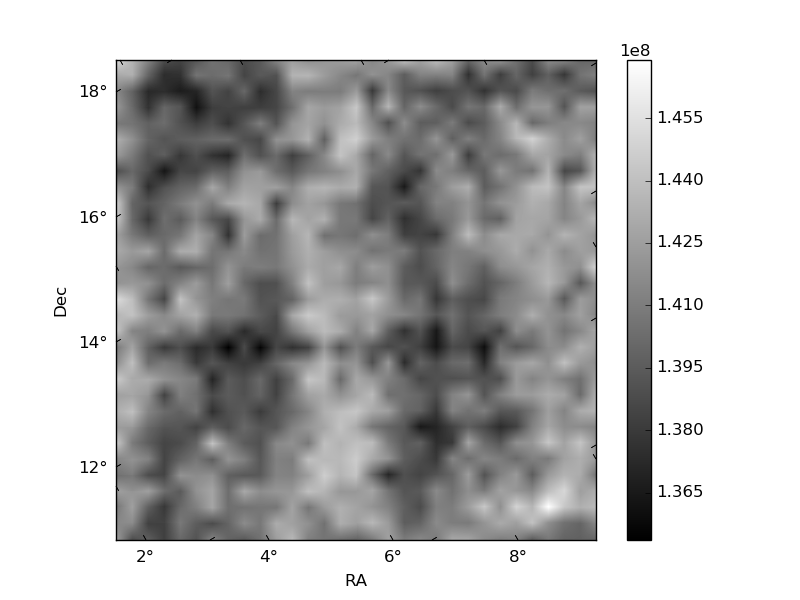
Histogram calculated using DETX and DETY for each event in the final _common_clean file
| Quadrant A | 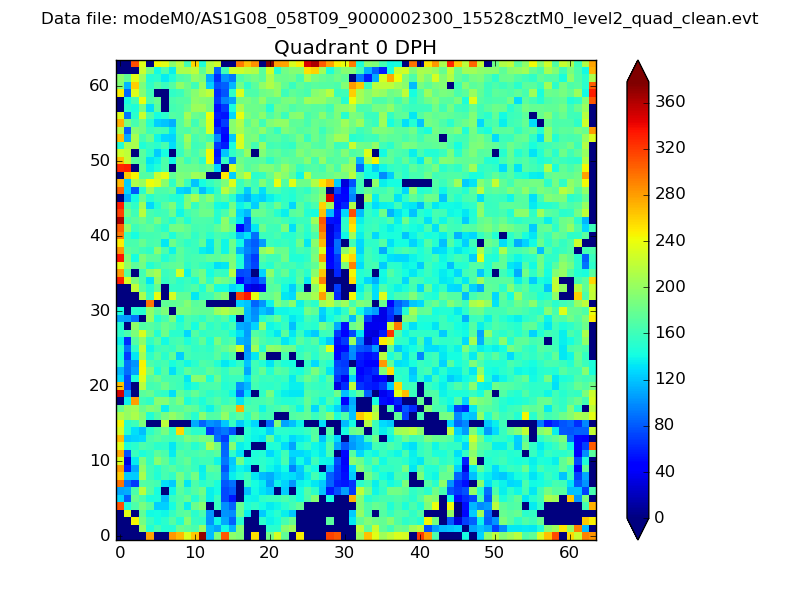 |
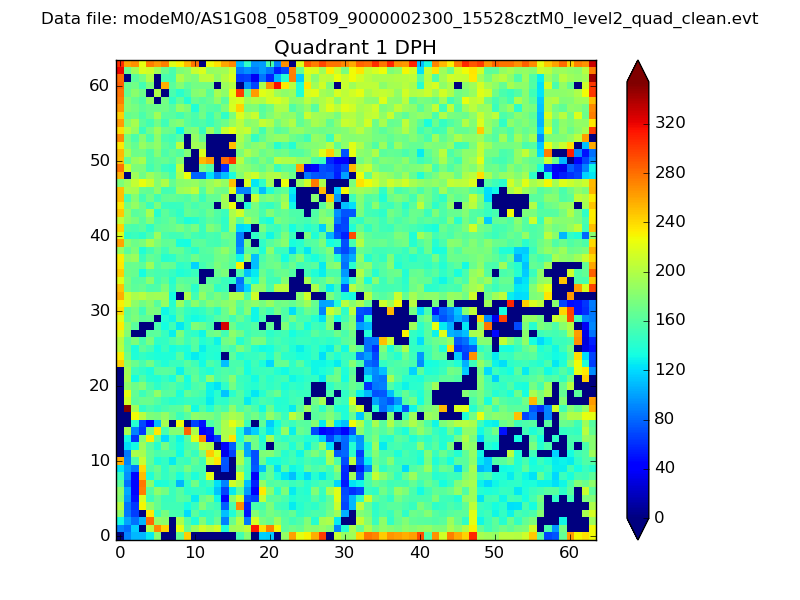 |
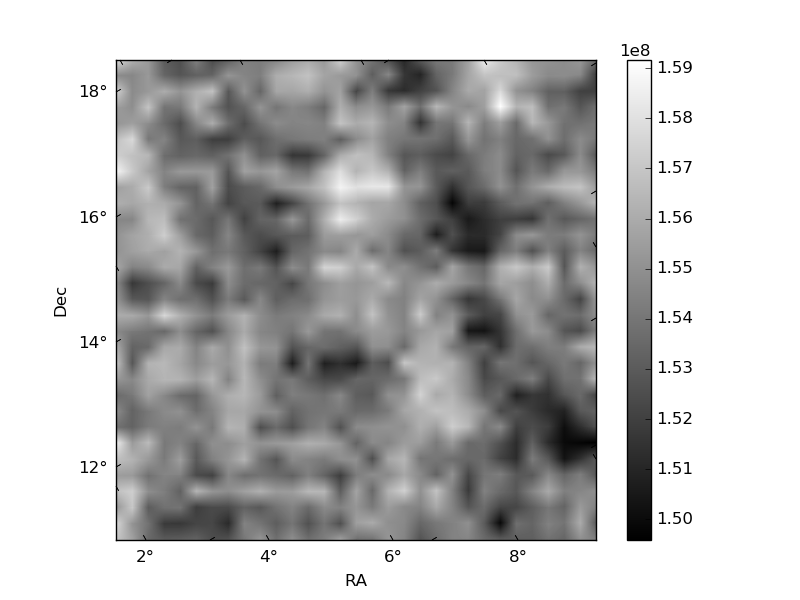
Quadrant B |
|---|---|---|---|
| Quadrant D | 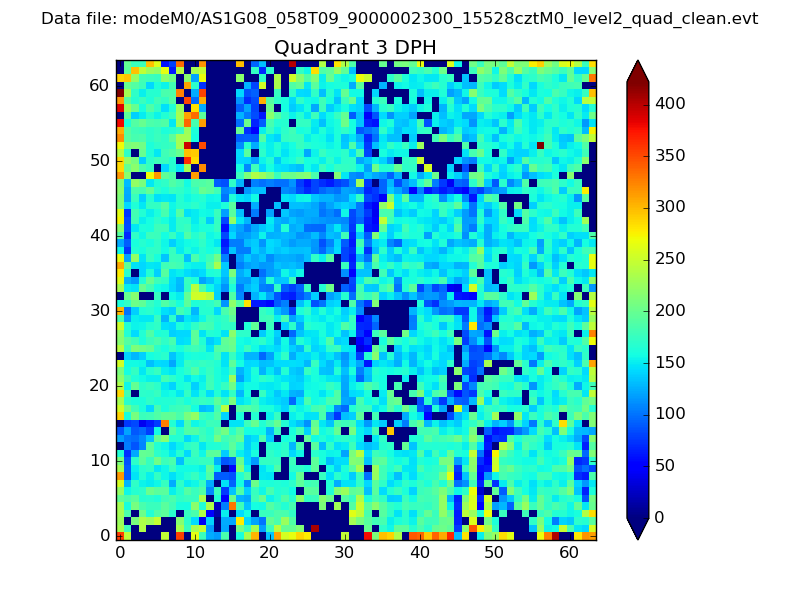 |
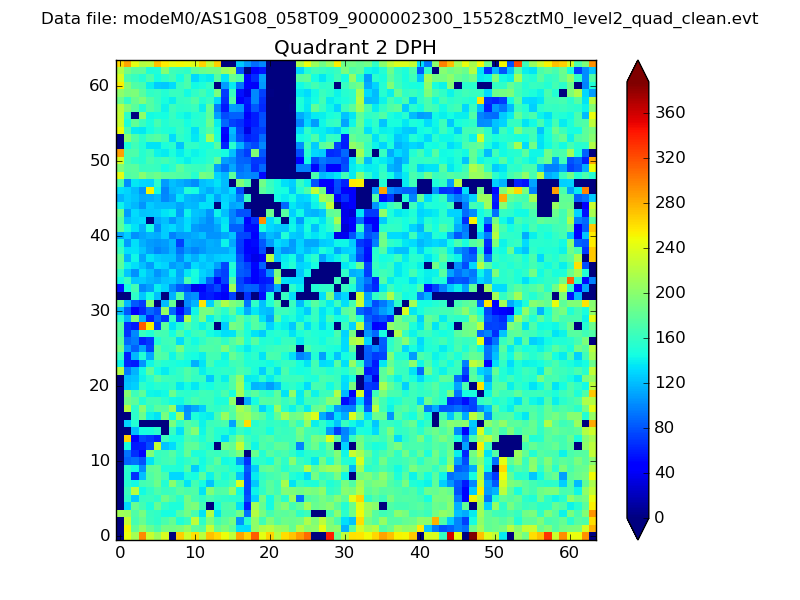 |
Quadrant C |
| Plot type | Count rate plots | Images |
|---|---|---|
| Comparison with Poisson distribution Blue bars denote a histogram of data divided into 1 sec bins. Red curve is a Poisson curve with rate = median count rate of data. |
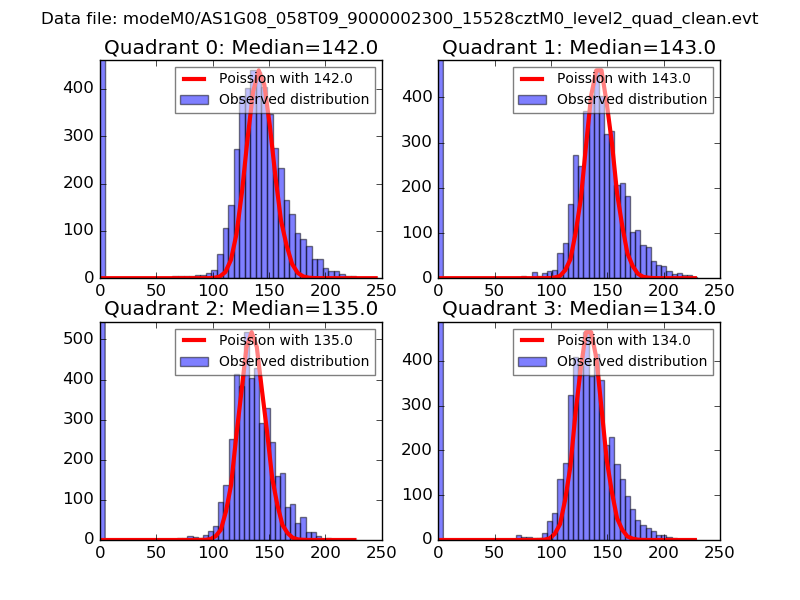 |
 |
| Quadrant-wise count rates Data is divided into 100 sec bins |
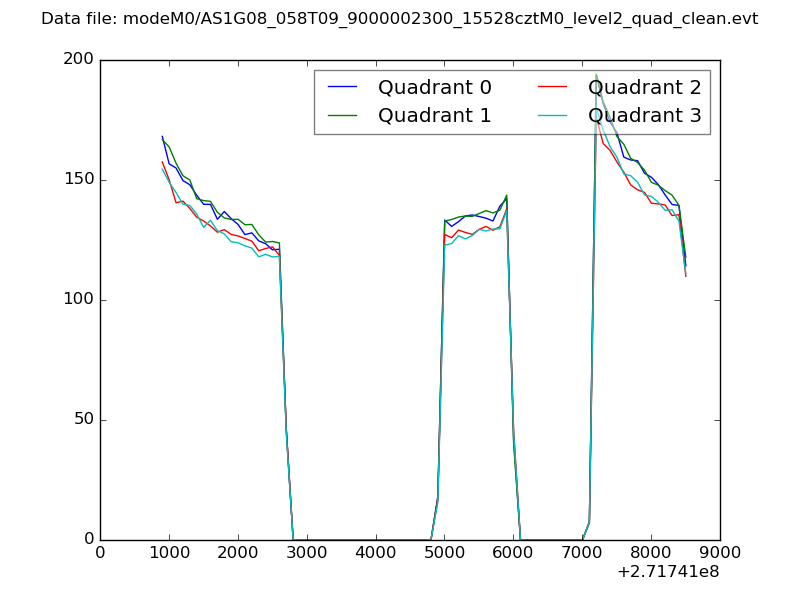 |
|
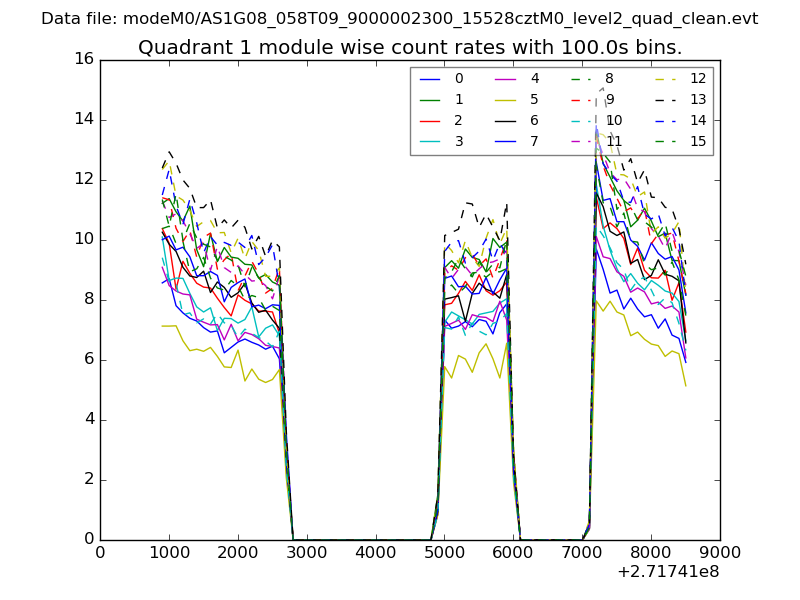
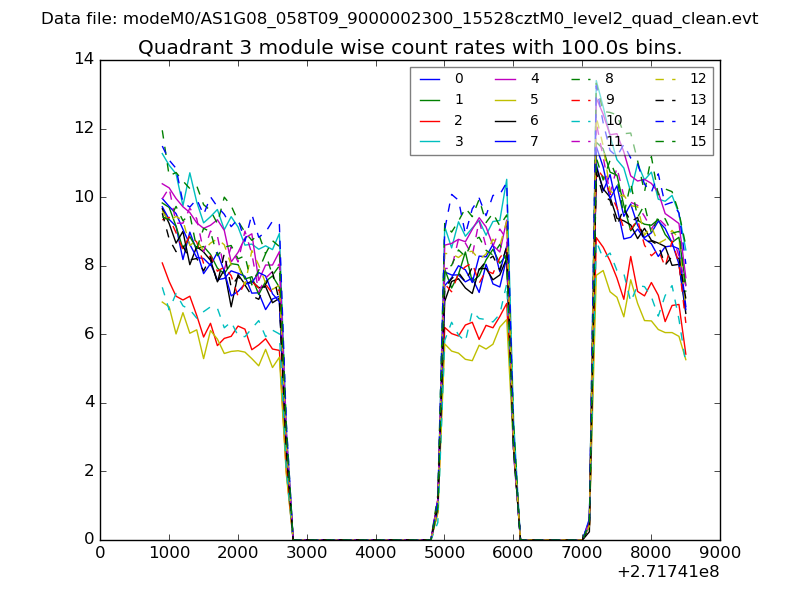
| Module-wise count rates for Quadrant A Data is divided into 100 sec bins |
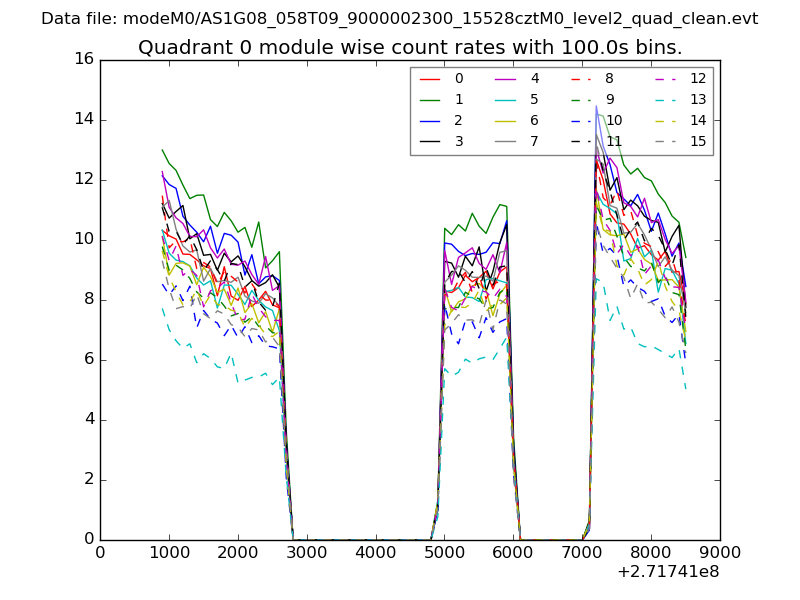 |
 |
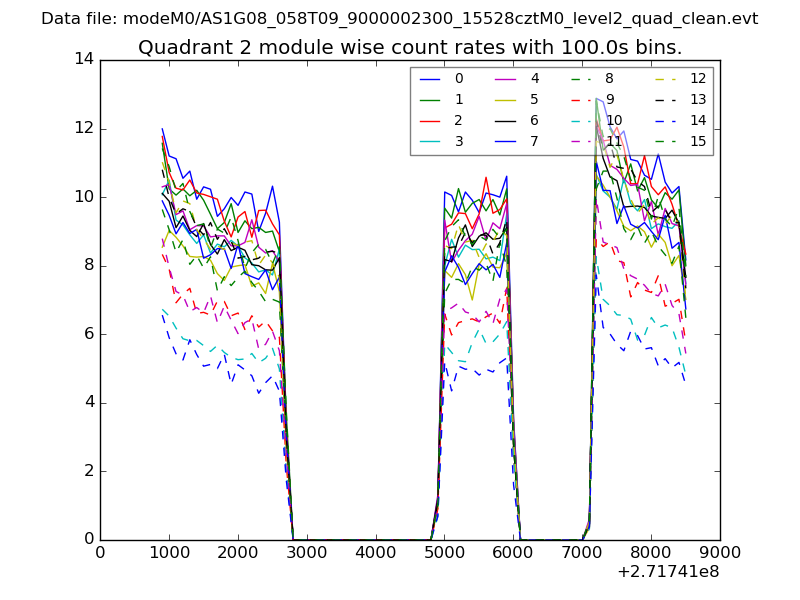
| Module-wise count rates for Quadrant B Data is divided into 100 sec bins |
 |
 |
| Module-wise count rates for Quadrant C Data is divided into 100 sec bins |
 |
 |
| Module-wise count rates for Quadrant D Data is divided into 100 sec bins |
 |
 |
| Parameter | Plot |
|---|---|
| CZT HV Monitor | 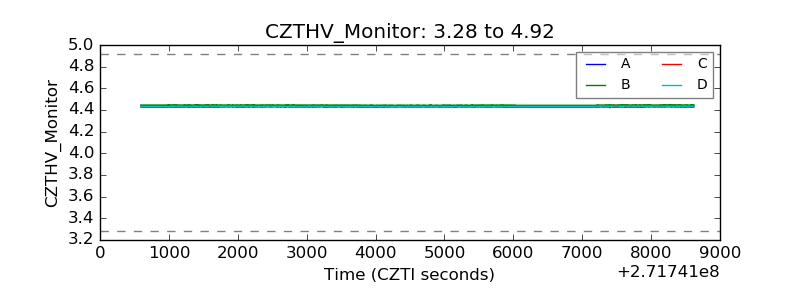 |
| D_VDD | 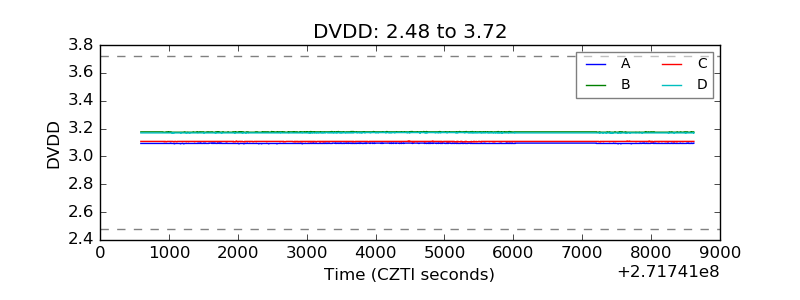 |
| Temperature 1 | 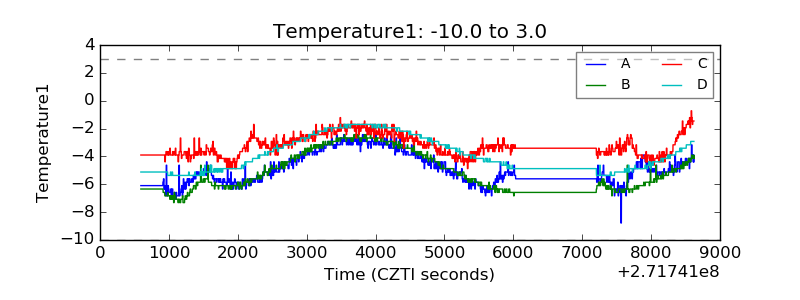 |
| Veto HV Monitor | 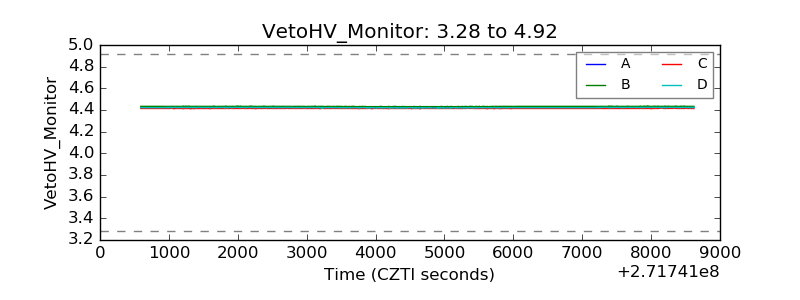 |
| Veto LLD | 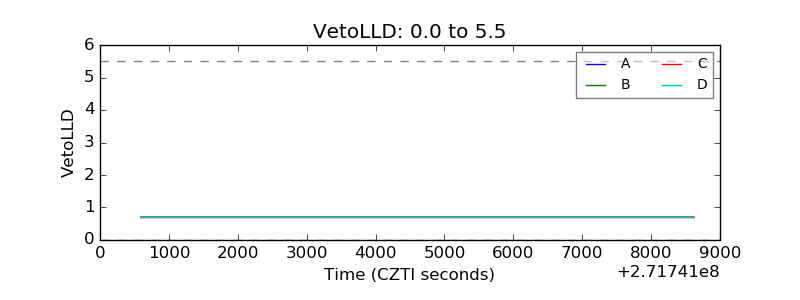 |
| Alpha Counter | 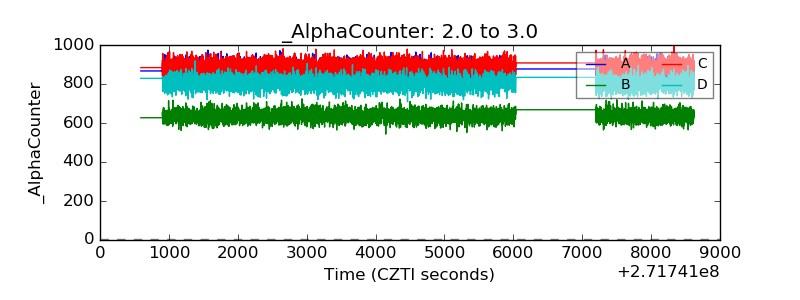 |
| _CPM_Rate | 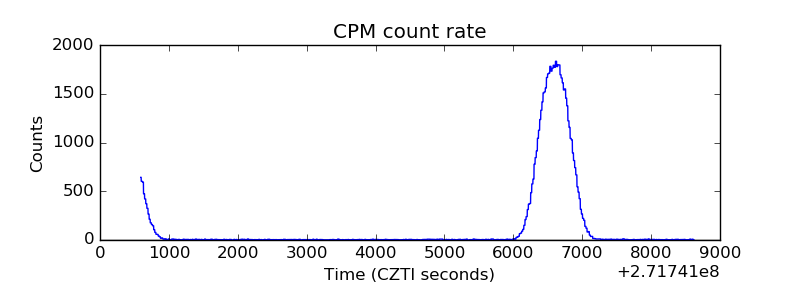 |
| CZT Counter | 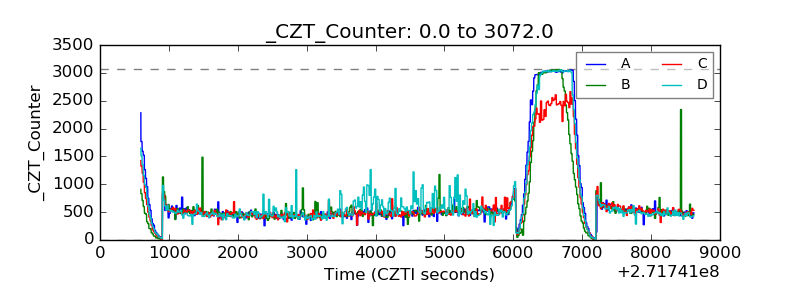 |
| +2.5 Volts monitor |  |
| +5 Volts monitor |  |
| _ROLL_ROT | 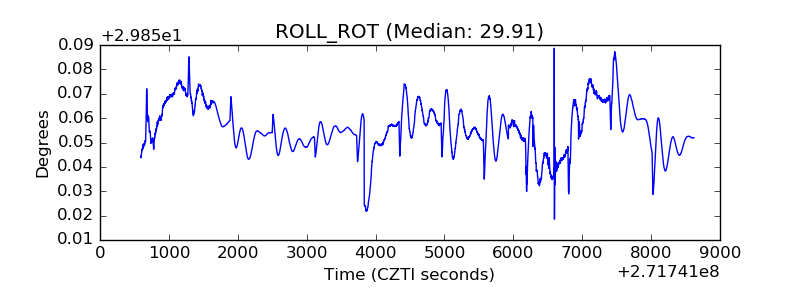 |
| _Roll_DEC | 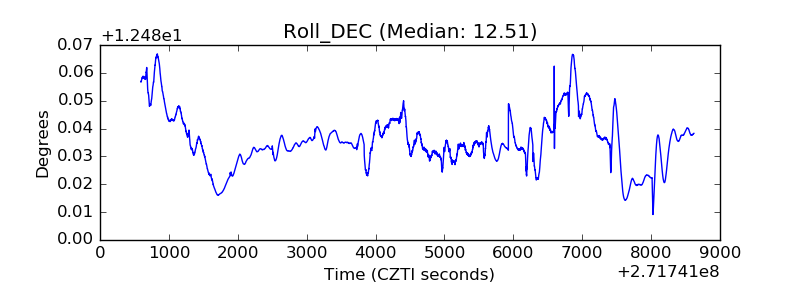 |
| _Roll_RA | 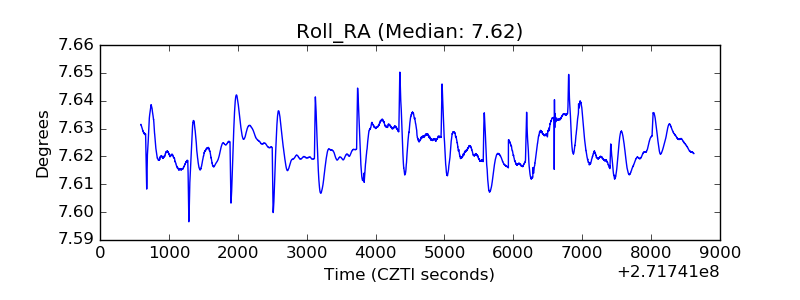 |
| Veto Counter | 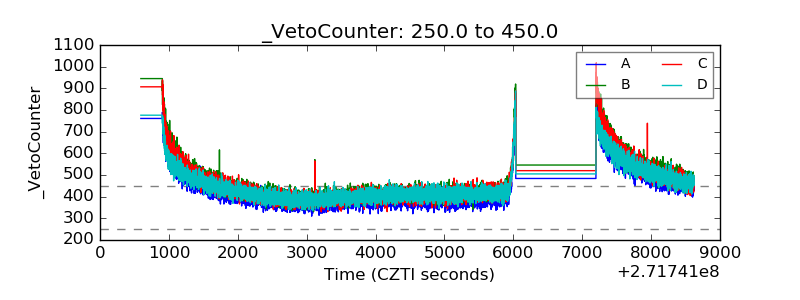 |