| Param | Original file | Final file |
|---|---|---|
| Filename | modeM0/AS1G08_058T09_9000002300_15529cztM0_level2.evt | modeM0/AS1G08_058T09_9000002300_15529cztM0_level2_quad_clean.evt |
| Size (bytes) | 514,903,680 | 89,398,080 |
| Size | 491.1 MB | 85.3 MB |
| Events in quadrant A | 3,362,174 | 583,477 |
| Events in quadrant B | 3,506,791 | 586,613 |
| Events in quadrant C | 3,429,295 | 549,638 |
| Events in quadrant D | 4,861,570 | 540,884 |
| Mode M0 | |||
|---|---|---|---|
| Quadrant | BADHDUFLAG | Total packets | Discarded packets |
| A | 0 | 13735 | 3 |
| B | 0 | 14214 | 2 |
| C | 0 | 13805 | 2 |
| D | 0 | 18604 | 2 |
| Mode M9 | |||
|---|---|---|---|
| Quadrant | BADHDUFLAG | Total packets | Discarded packets |
| A | 0 | 14 | 0 |
| B | 0 | 14 | 0 |
| C | 0 | 14 | 0 |
| D | 0 | 15 | 0 |
| Mode SS | |||
|---|---|---|---|
| Quadrant | BADHDUFLAG | Total packets | Discarded packets |
| A | 0 | 128 | 0 |
| B | 0 | 128 | 0 |
| C | 0 | 128 | 0 |
| D | 0 | 128 | 0 |
| Quadrant | Total seconds | Saturated seconds | Saturation percentage |
|---|---|---|---|
| A | 6408 | 53 | 0.827091% |
| B | 6408 | 74 | 1.154806% |
| C | 6408 | 65 | 1.014357% |
| D | 6408 | 385 | 6.008115% |
Noise dominated data is calculated using 1-second bins in cleaned event files. If a bin has >2000 counts, and if more than 50% of those come from <1% of pixels, then it is considered to be noise-dominated and hence unusable.
| Quadrant | # 1 sec bins | Bins with >0 counts | Bins with >2000 counts | High rate bins dominated by noise | Noise dominated (total time) | Noise dominated (detector-on time) | Marked lightcurve |
|---|---|---|---|---|---|---|---|
| A | 7674 | 6409 | 0 | 0 | 0.00% | 0.00% | 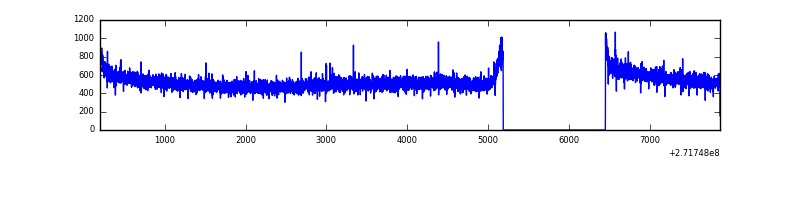 |
| B | 7674 | 6409 | 12 | 12 | 0.16% | 0.19% | 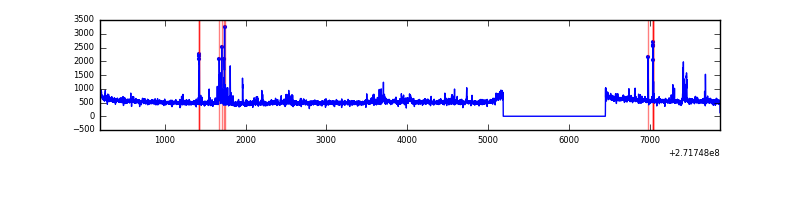 |
| C | 7674 | 6410 | 1 | 1 | 0.01% | 0.02% |  |
| D | 7674 | 6410 | 375 | 375 | 4.89% | 5.85% | 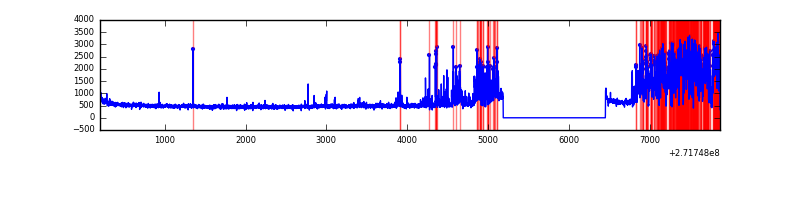 |
Top three noisy pixels from each quadrant. If the there are fewer than three noisy pixels in the level2.evt file, extra rows are filled as -1
| Pixel properties | Quadrant properties | ||||||
|---|---|---|---|---|---|---|---|
| Quadrant | DetID | PixID | Counts | Sigma | Mean | Median | Sigma |
| A | 0 | 253 | 54332 | 311.51 | 859 | 841 | 171.7 |
| A | 0 | 226 | 7761 | 40.3 | 859 | 841 | 171.7 |
| A | 12 | 194 | 6479 | 32.83 | 859 | 841 | 171.7 |
| B | 15 | 201 | 72900 | 454.88 | 844 | 826 | 158.4 |
| B | 0 | 189 | 42830 | 265.1 | 844 | 826 | 158.4 |
| B | 15 | 222 | 32292 | 198.59 | 844 | 826 | 158.4 |
| C | 3 | 233 | 172334 | 929.8 | 799 | 807 | 184.5 |
| C | 14 | 238 | 126923 | 683.64 | 799 | 807 | 184.5 |
| C | 0 | 207 | 8839 | 43.54 | 799 | 807 | 184.5 |
| D | 1 | 52 | 1276305 | 6326.39 | 821 | 796 | 201.6 |
| D | 5 | 222 | 227944 | 1126.63 | 821 | 796 | 201.6 |
| D | 12 | 221 | 193069 | 953.65 | 821 | 796 | 201.6 |
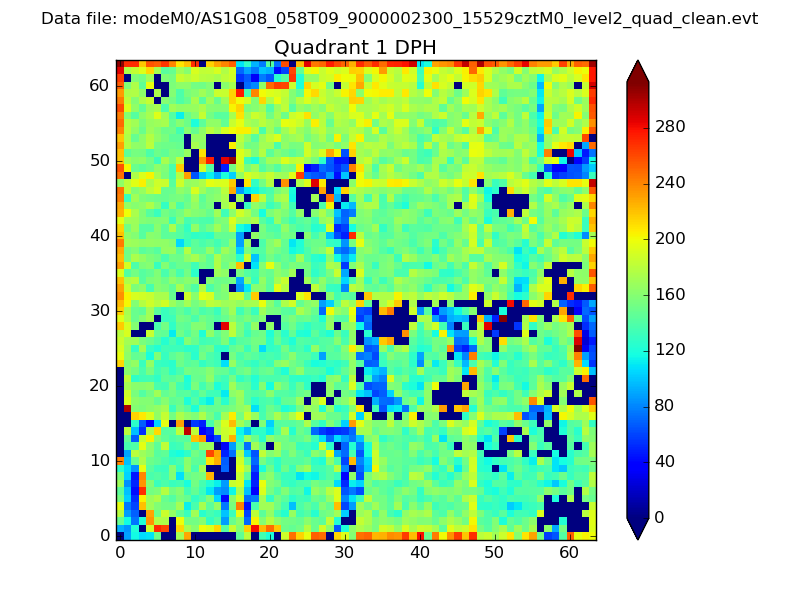
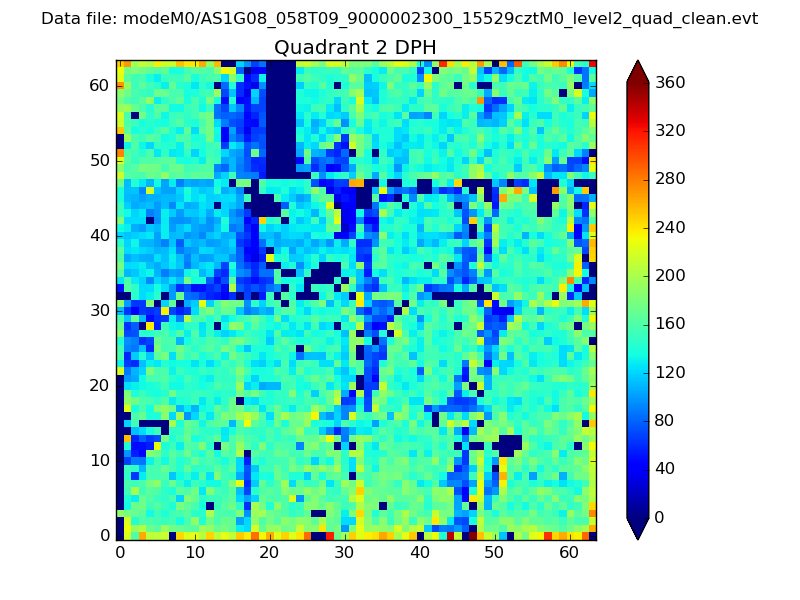
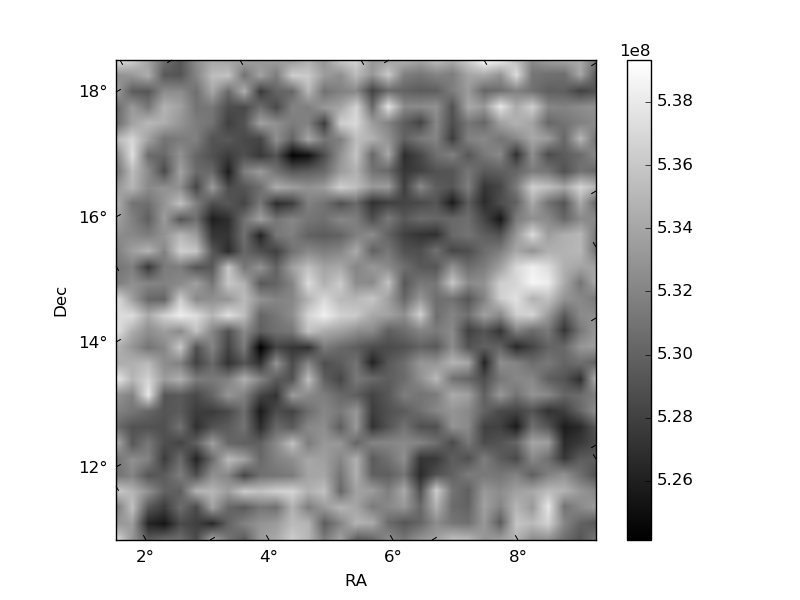
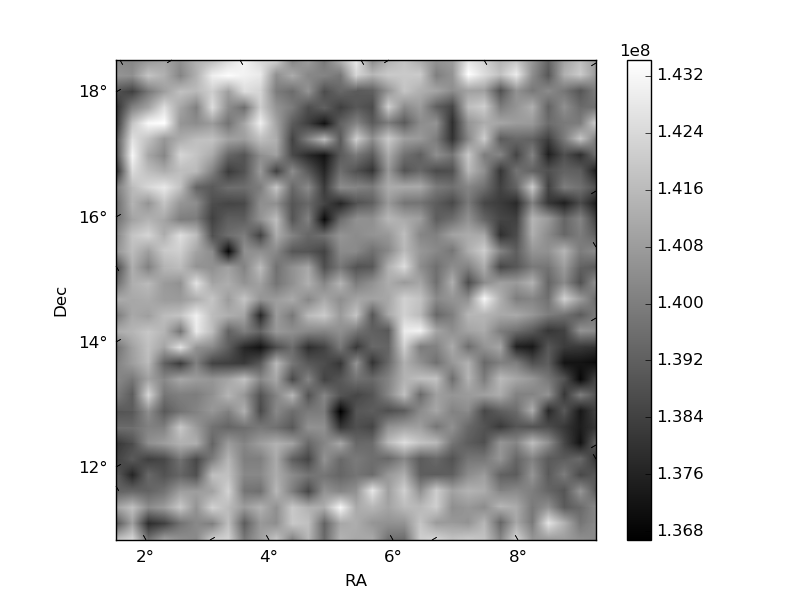
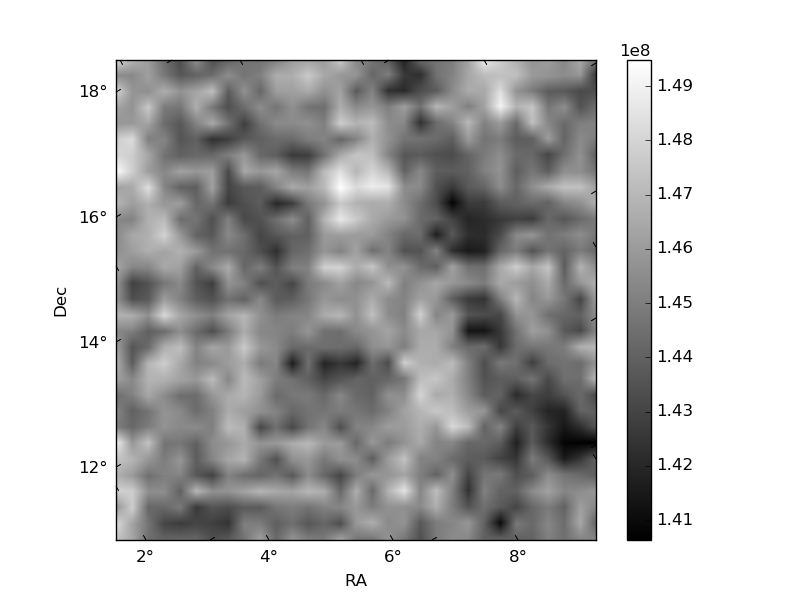
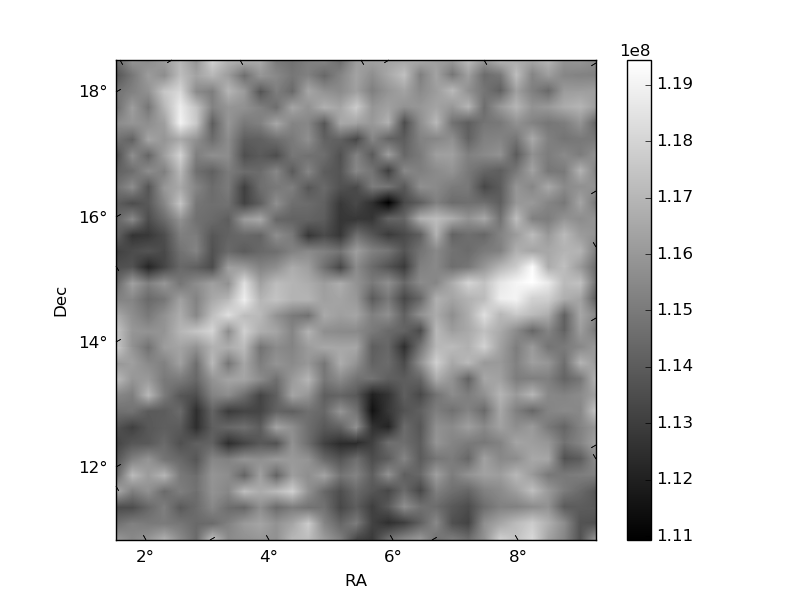
Histogram calculated using DETX and DETY for each event in the final _common_clean file
| Quadrant A | 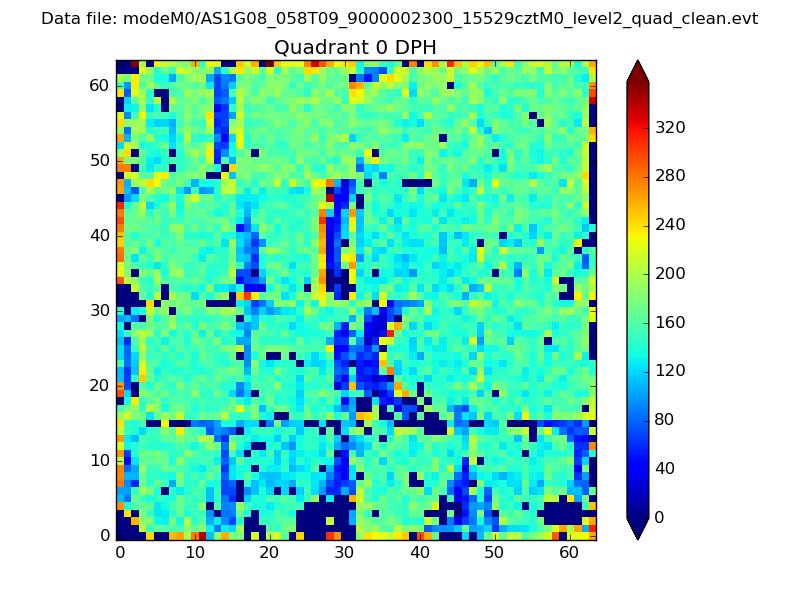 |
 |
Quadrant B |
|---|---|---|---|
| Quadrant D | 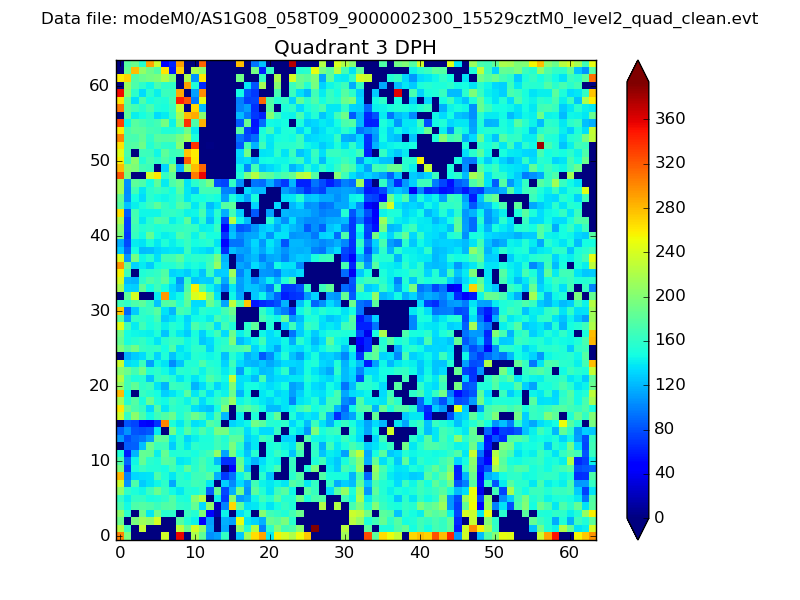 |
 |
Quadrant C |
| Plot type | Count rate plots | Images |
|---|---|---|
| Comparison with Poisson distribution Blue bars denote a histogram of data divided into 1 sec bins. Red curve is a Poisson curve with rate = median count rate of data. |
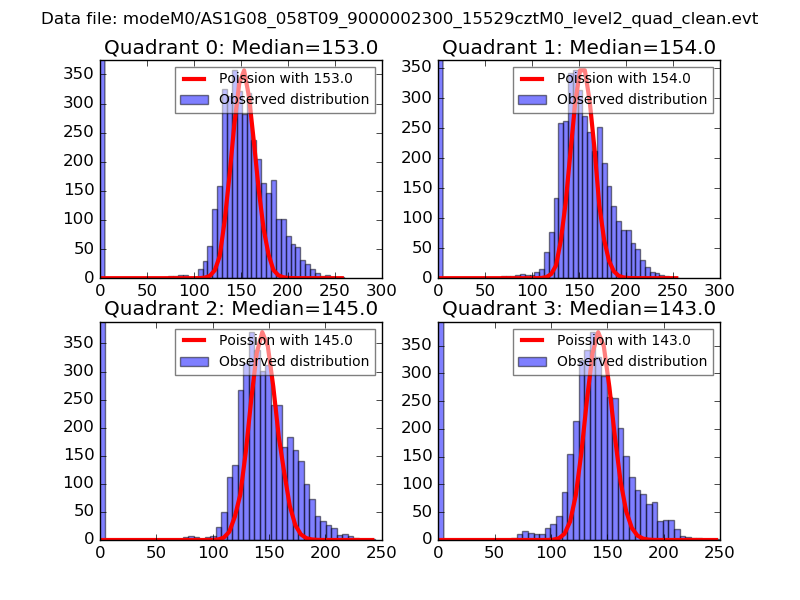 |
 |
| Quadrant-wise count rates Data is divided into 100 sec bins |
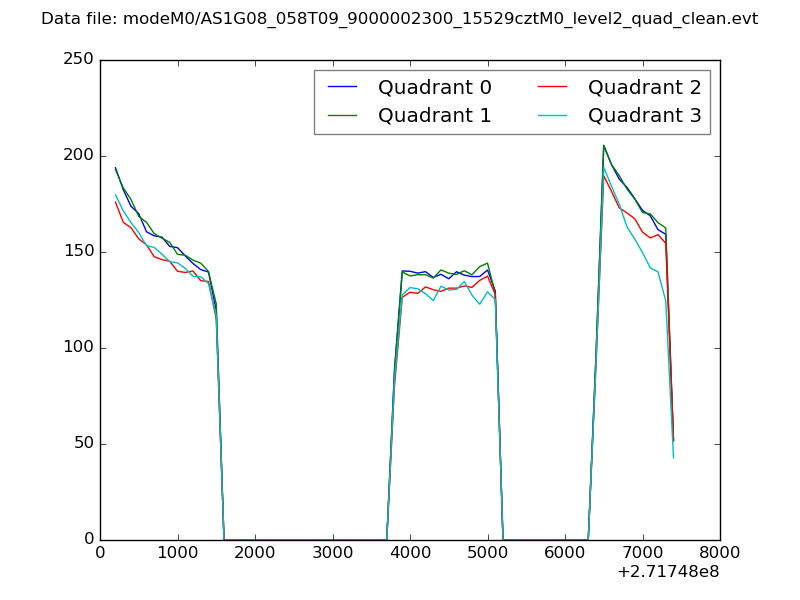 |
|
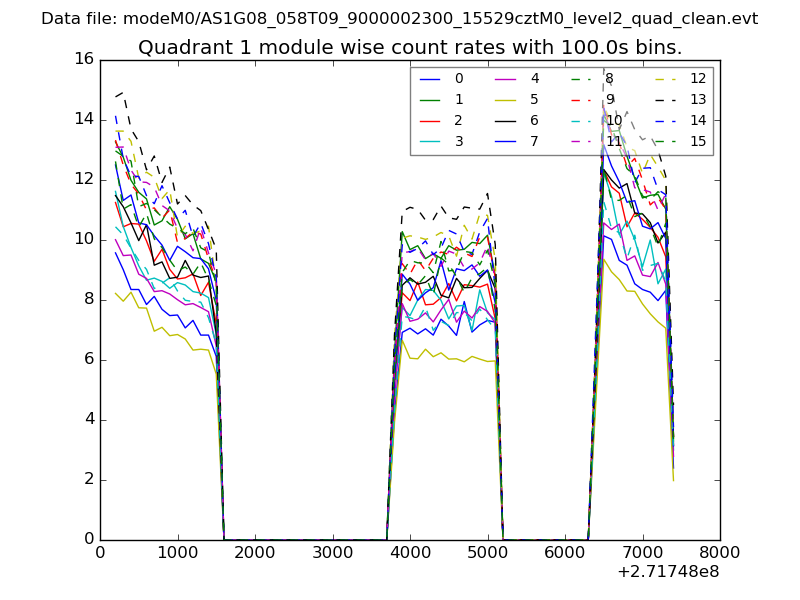
| Module-wise count rates for Quadrant A Data is divided into 100 sec bins |
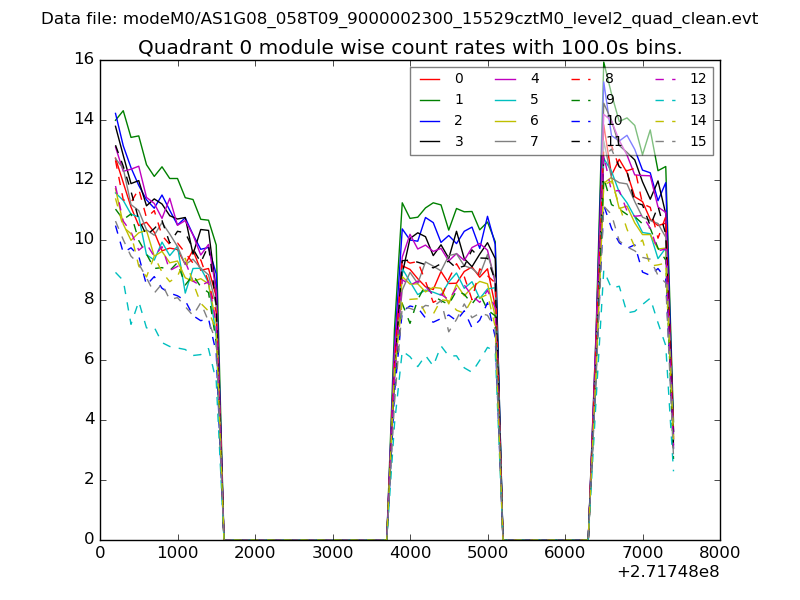 |
 |
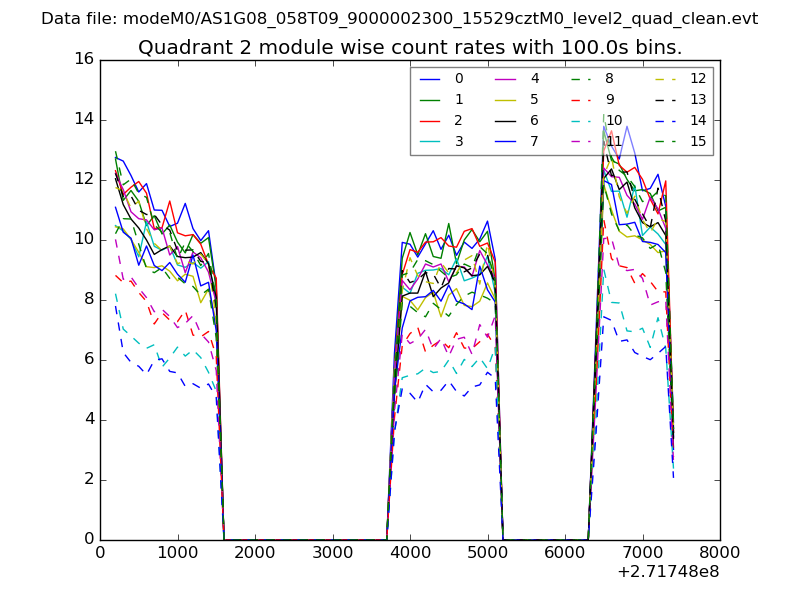
| Module-wise count rates for Quadrant B Data is divided into 100 sec bins |
 |
 |
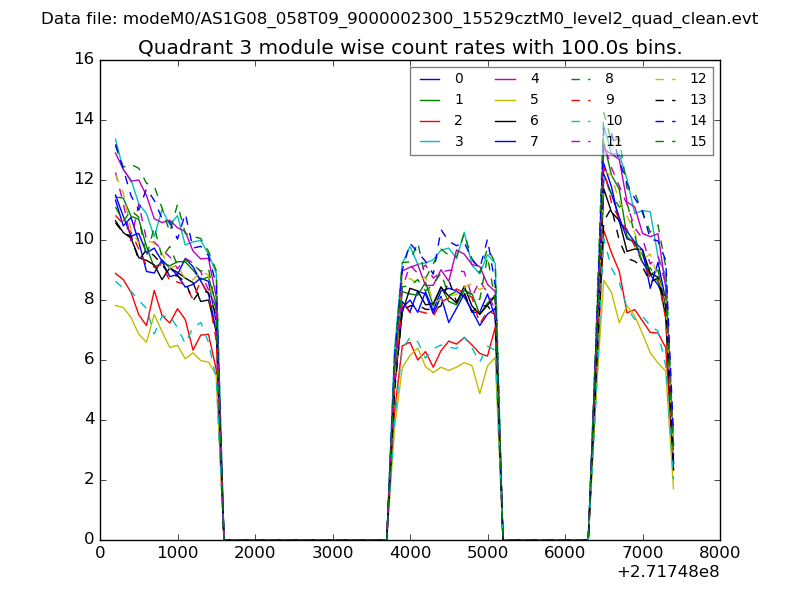
| Module-wise count rates for Quadrant C Data is divided into 100 sec bins |
 |
 |
| Module-wise count rates for Quadrant D Data is divided into 100 sec bins |
 |
 |
| Parameter | Plot |
|---|---|
| CZT HV Monitor | 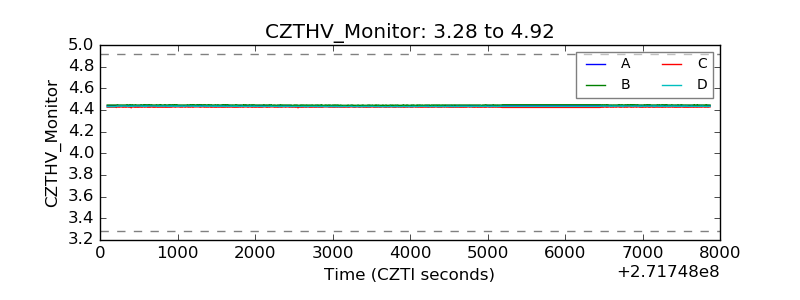 |
| D_VDD | 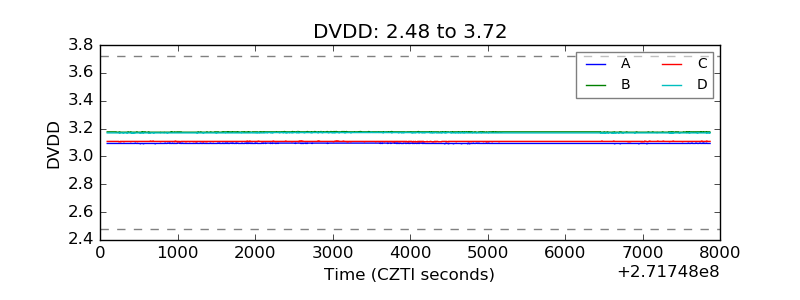 |
| Temperature 1 | 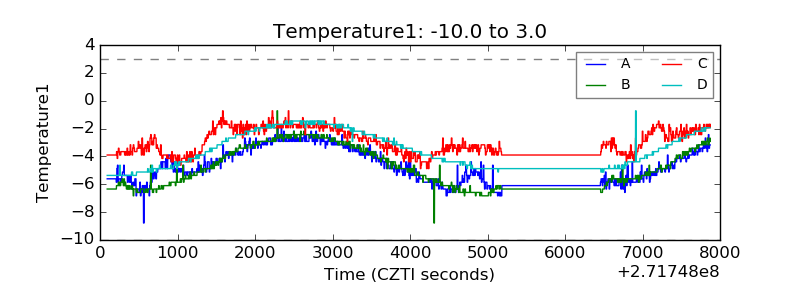 |
| Veto HV Monitor |  |
| Veto LLD | 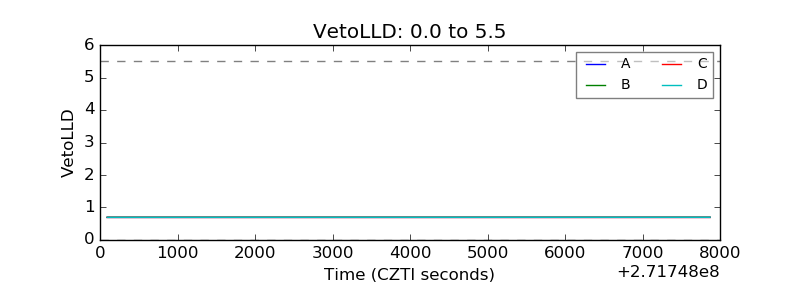 |
| Alpha Counter | 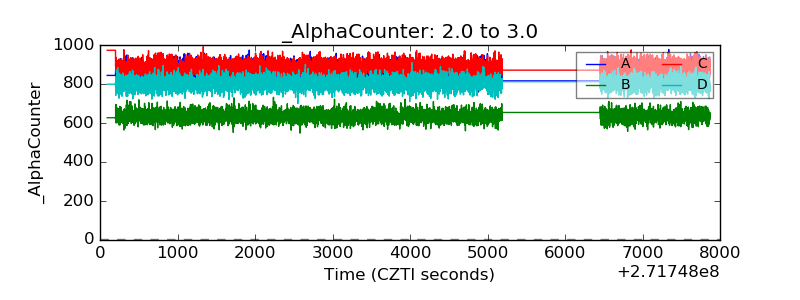 |
| _CPM_Rate | 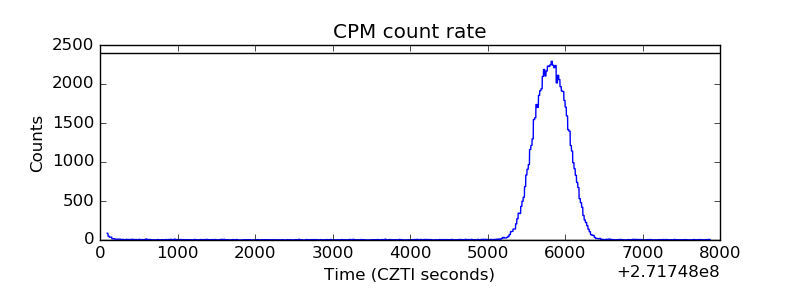 |
| CZT Counter | 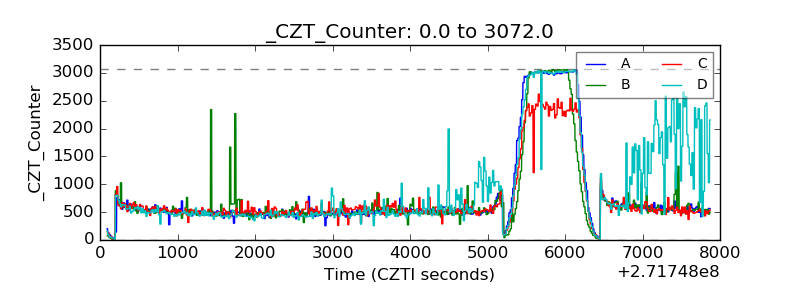 |
| +2.5 Volts monitor |  |
| +5 Volts monitor |  |
| _ROLL_ROT | 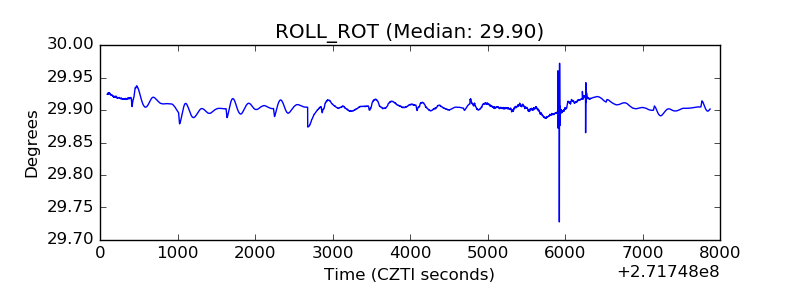 |
| _Roll_DEC | 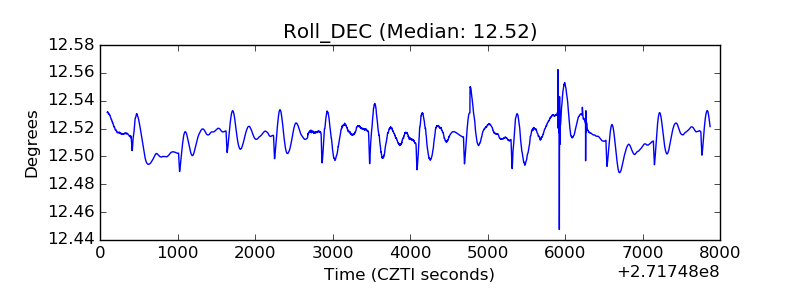 |
| _Roll_RA | 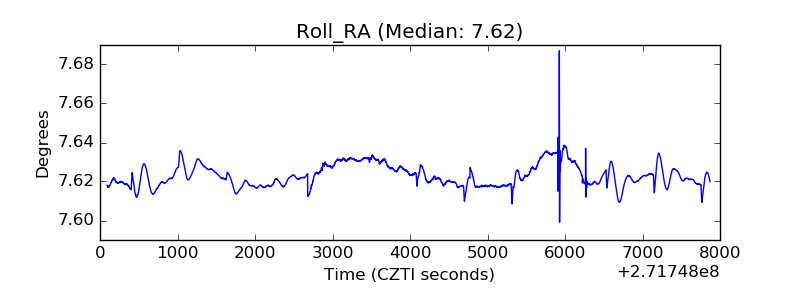 |
| Veto Counter | 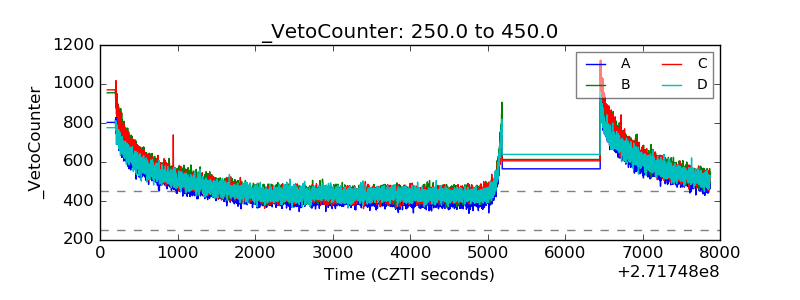 |