| Param | Original file | Final file |
|---|---|---|
| Filename | modeM0/AS1G08_058T09_9000002300_15530cztM0_level2.evt | modeM0/AS1G08_058T09_9000002300_15530cztM0_level2_quad_clean.evt |
| Size (bytes) | 611,101,440 | 81,241,920 |
| Size | 582.8 MB | 77.5 MB |
| Events in quadrant A | 3,501,786 | 520,097 |
| Events in quadrant B | 3,587,364 | 522,133 |
| Events in quadrant C | 3,465,871 | 492,001 |
| Events in quadrant D | 7,519,069 | 479,476 |
| Mode M0 | |||
|---|---|---|---|
| Quadrant | BADHDUFLAG | Total packets | Discarded packets |
| A | 0 | 14155 | 2 |
| B | 0 | 14494 | 1 |
| C | 0 | 13917 | 1 |
| D | 0 | 26554 | 1 |
| Mode M9 | |||
|---|---|---|---|
| Quadrant | BADHDUFLAG | Total packets | Discarded packets |
| A | 0 | 13 | 0 |
| B | 0 | 13 | 0 |
| C | 0 | 13 | 0 |
| D | 0 | 13 | 0 |
| Mode SS | |||
|---|---|---|---|
| Quadrant | BADHDUFLAG | Total packets | Discarded packets |
| A | 0 | 130 | 0 |
| B | 0 | 130 | 0 |
| C | 0 | 130 | 0 |
| D | 0 | 130 | 0 |
| Quadrant | Total seconds | Saturated seconds | Saturation percentage |
|---|---|---|---|
| A | 6397 | 67 | 1.047366% |
| B | 6397 | 85 | 1.328748% |
| C | 6397 | 79 | 1.234954% |
| D | 6397 | 1445 | 22.588713% |
Noise dominated data is calculated using 1-second bins in cleaned event files. If a bin has >2000 counts, and if more than 50% of those come from <1% of pixels, then it is considered to be noise-dominated and hence unusable.
| Quadrant | # 1 sec bins | Bins with >0 counts | Bins with >2000 counts | High rate bins dominated by noise | Noise dominated (total time) | Noise dominated (detector-on time) | Marked lightcurve |
|---|---|---|---|---|---|---|---|
| A | 7718 | 6398 | 0 | 0 | 0.00% | 0.00% | 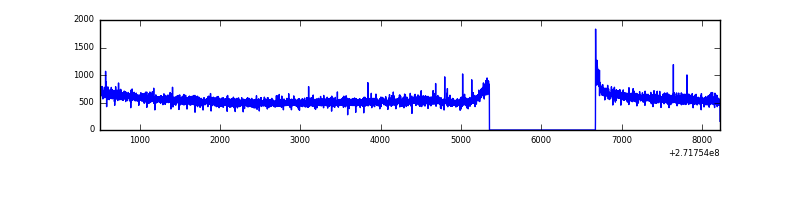 |
| B | 7718 | 6398 | 8 | 8 | 0.10% | 0.13% | 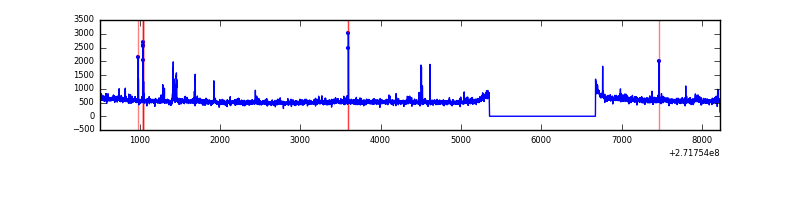 |
| C | 7718 | 6399 | 0 | 0 | 0.00% | 0.00% | 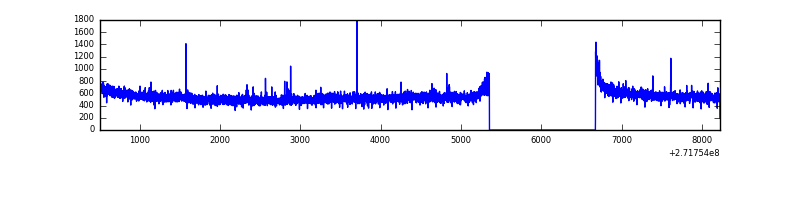 |
| D | 7718 | 6398 | 1386 | 1386 | 17.96% | 21.66% | 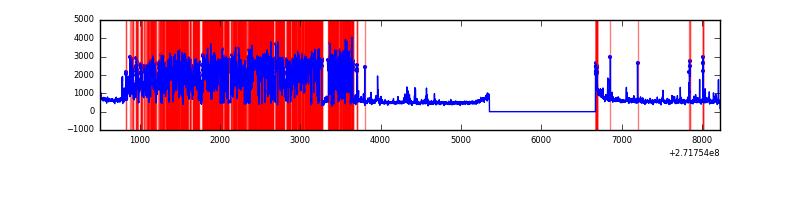 |
Top three noisy pixels from each quadrant. If the there are fewer than three noisy pixels in the level2.evt file, extra rows are filled as -1
| Pixel properties | Quadrant properties | ||||||
|---|---|---|---|---|---|---|---|
| Quadrant | DetID | PixID | Counts | Sigma | Mean | Median | Sigma |
| A | 0 | 253 | 59212 | 324.87 | 893 | 877 | 179.6 |
| A | 0 | 226 | 8040 | 39.89 | 893 | 877 | 179.6 |
| A | 12 | 194 | 6762 | 32.77 | 893 | 877 | 179.6 |
| B | 15 | 201 | 35160 | 207.7 | 875 | 858 | 165.1 |
| B | 0 | 189 | 25887 | 151.55 | 875 | 858 | 165.1 |
| B | 4 | 173 | 25048 | 146.47 | 875 | 858 | 165.1 |
| C | 14 | 238 | 132070 | 685.22 | 831 | 839 | 191.5 |
| C | 3 | 233 | 62749 | 323.26 | 831 | 839 | 191.5 |
| C | 0 | 207 | 17898 | 89.07 | 831 | 839 | 191.5 |
| D | 1 | 52 | 3971990 | 20527.29 | 796 | 772 | 193.5 |
| D | 12 | 221 | 346936 | 1789.33 | 796 | 772 | 193.5 |
| D | 5 | 222 | 125224 | 643.29 | 796 | 772 | 193.5 |
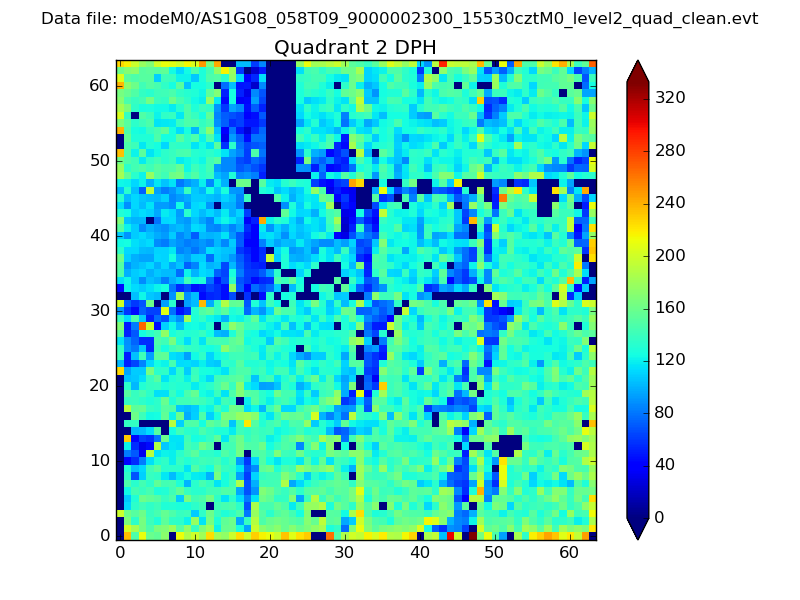
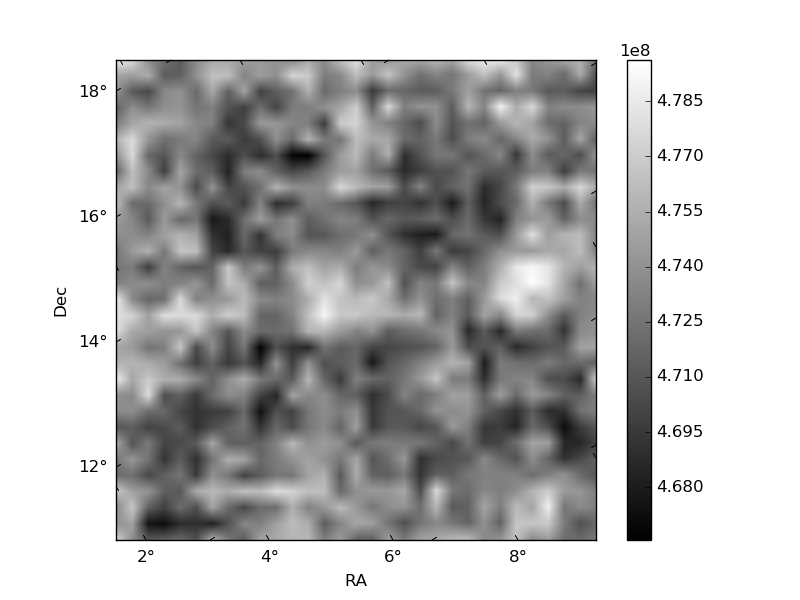
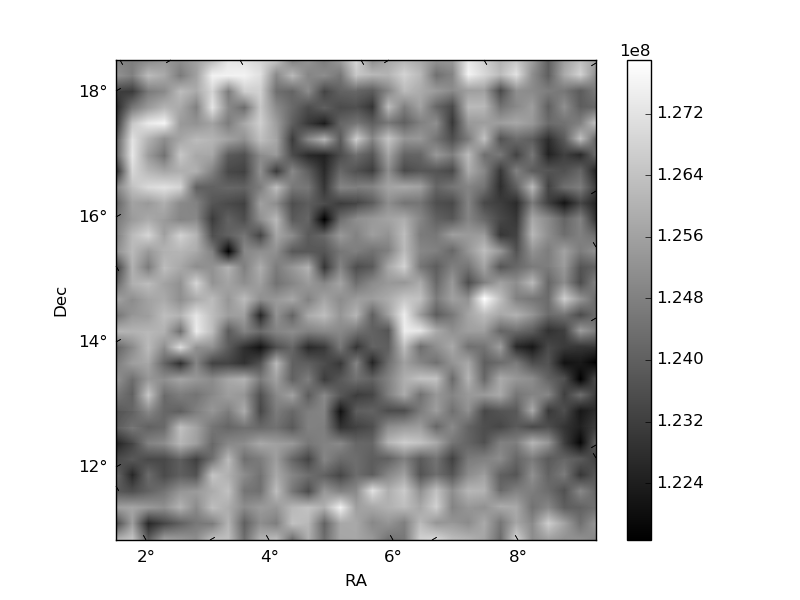
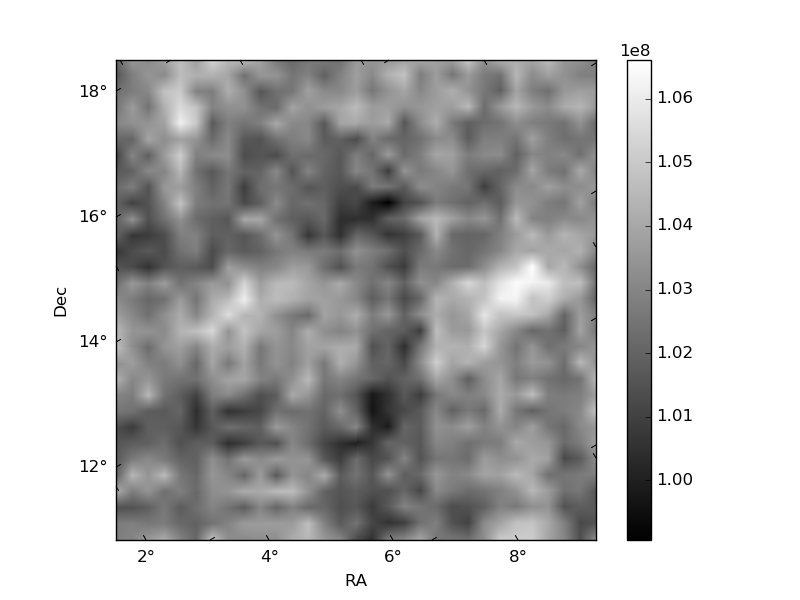
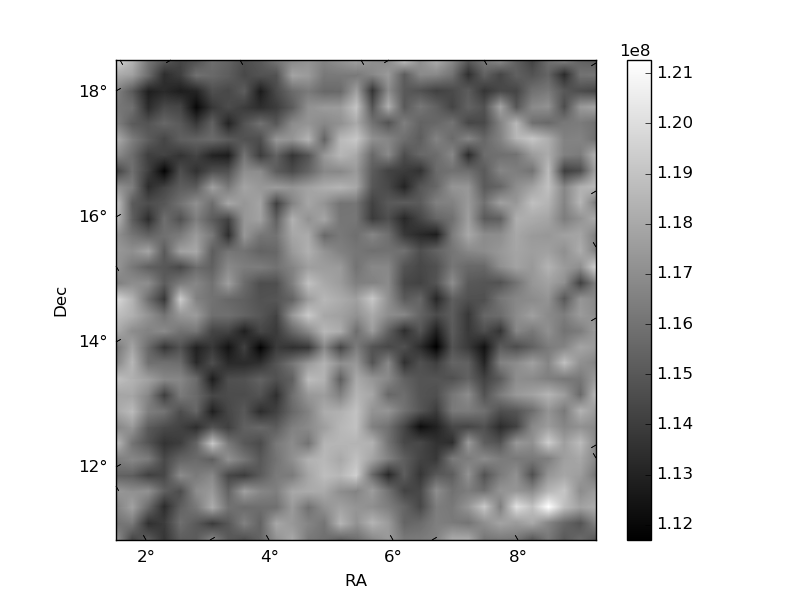
Histogram calculated using DETX and DETY for each event in the final _common_clean file
| Quadrant A | 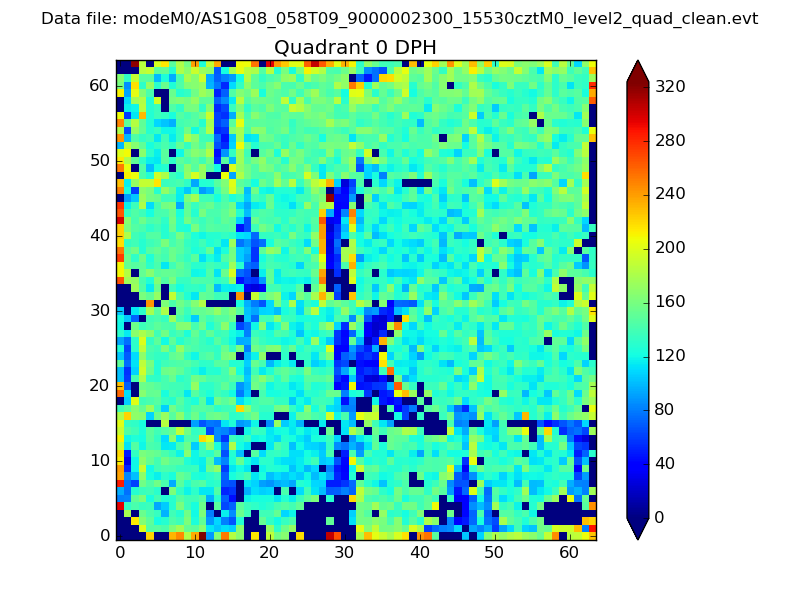 |
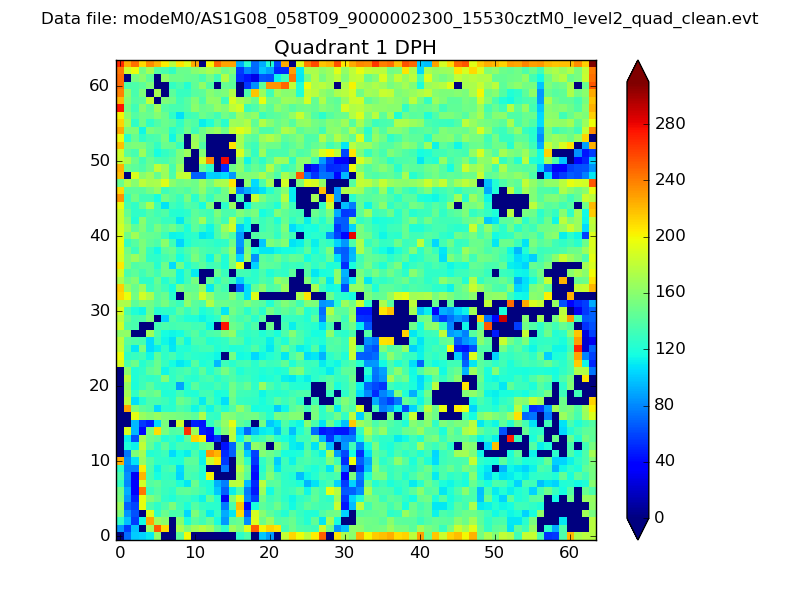 |
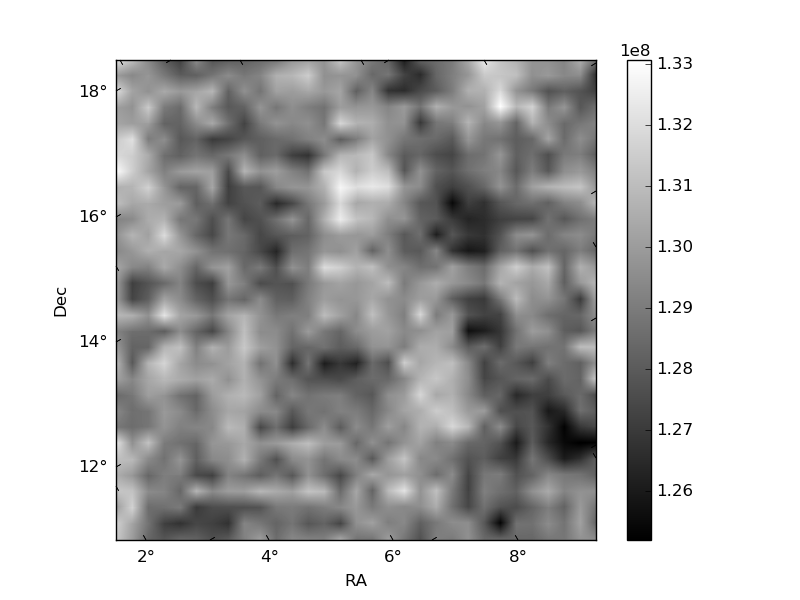
Quadrant B |
|---|---|---|---|
| Quadrant D | 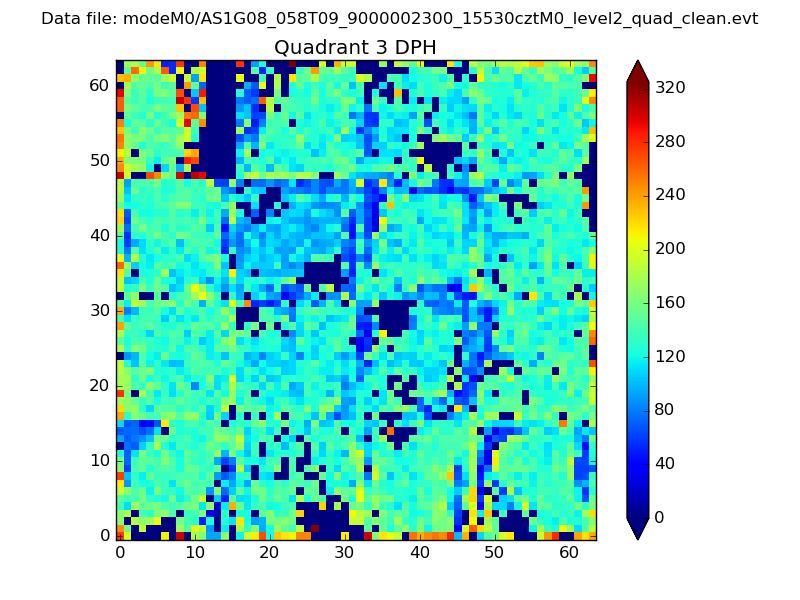 |
 |
Quadrant C |
| Plot type | Count rate plots | Images |
|---|---|---|
| Comparison with Poisson distribution Blue bars denote a histogram of data divided into 1 sec bins. Red curve is a Poisson curve with rate = median count rate of data. |
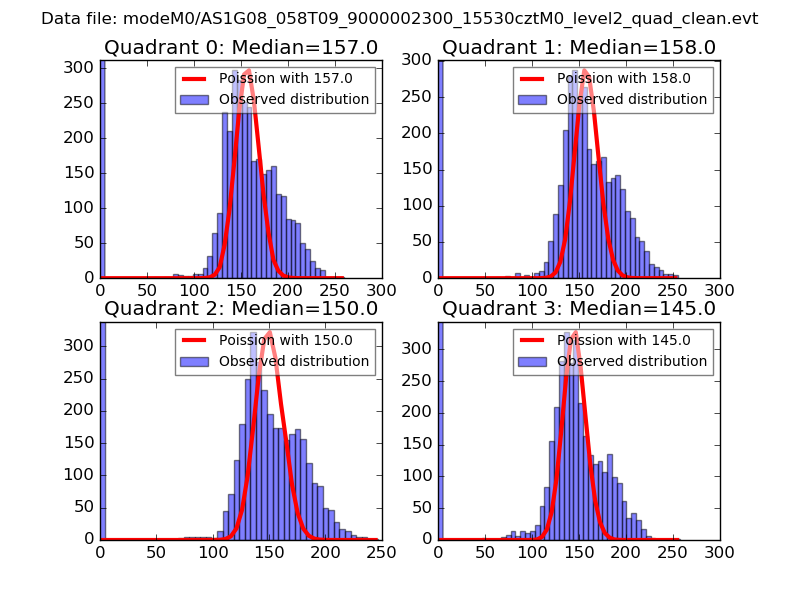 |
 |
| Quadrant-wise count rates Data is divided into 100 sec bins |
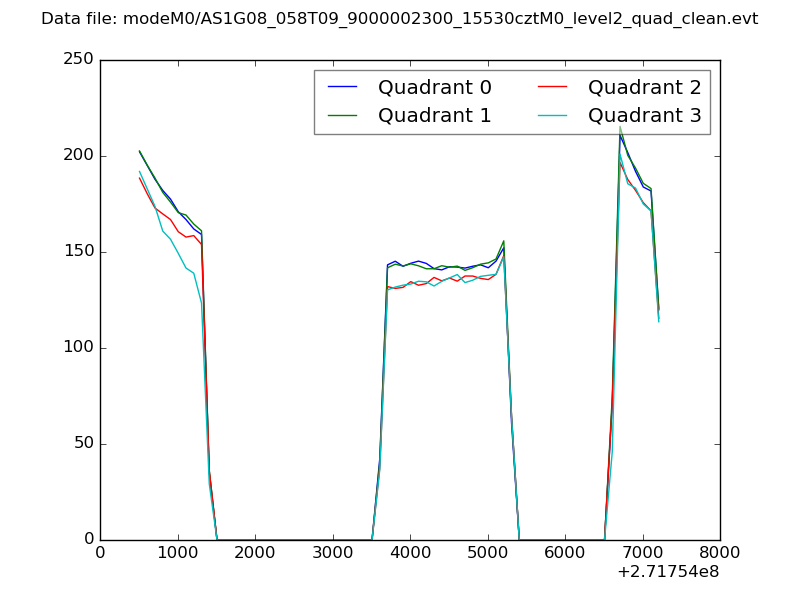 |
|
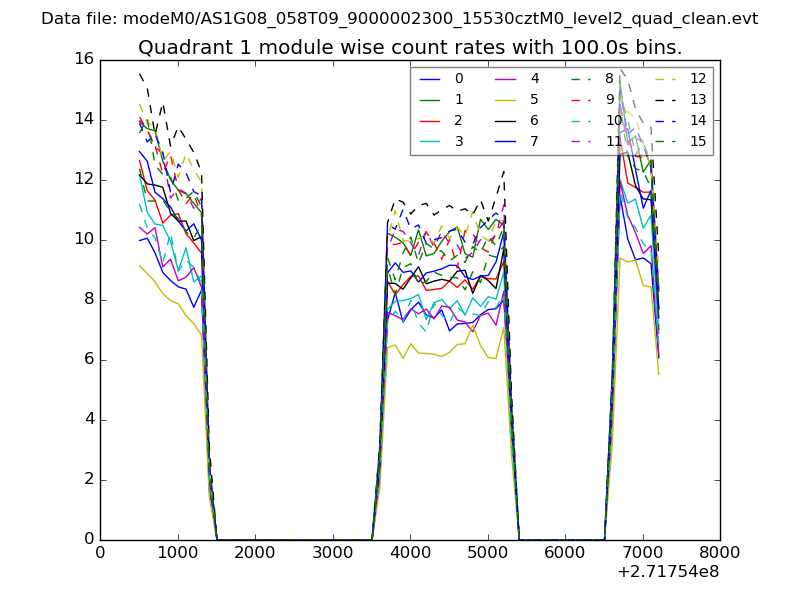
| Module-wise count rates for Quadrant A Data is divided into 100 sec bins |
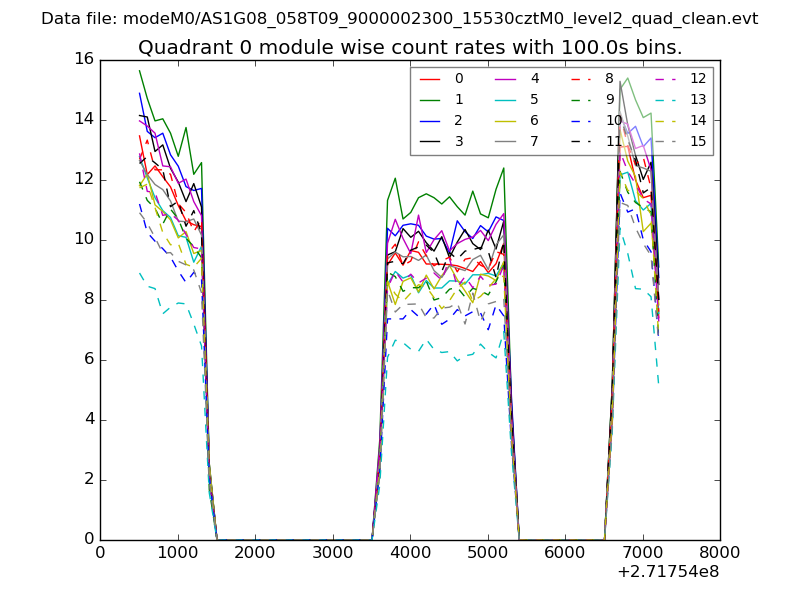 |
 |
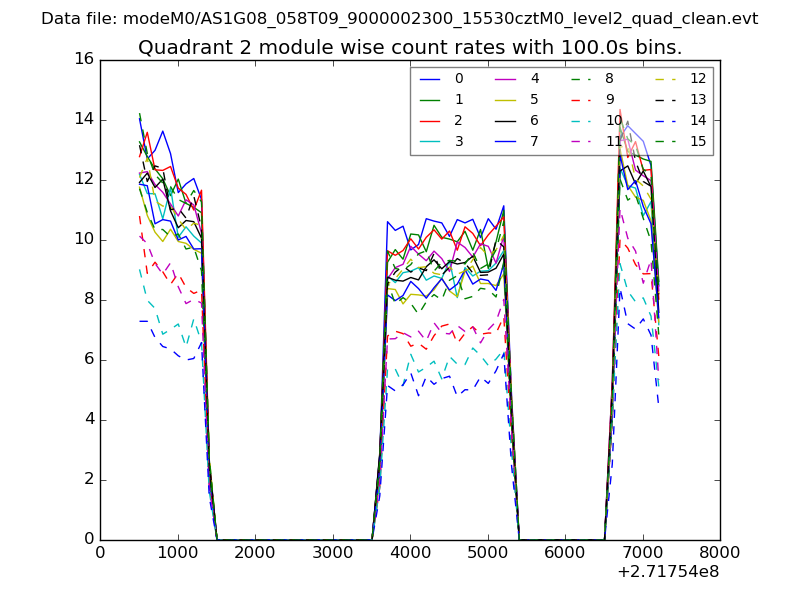
| Module-wise count rates for Quadrant B Data is divided into 100 sec bins |
 |
 |
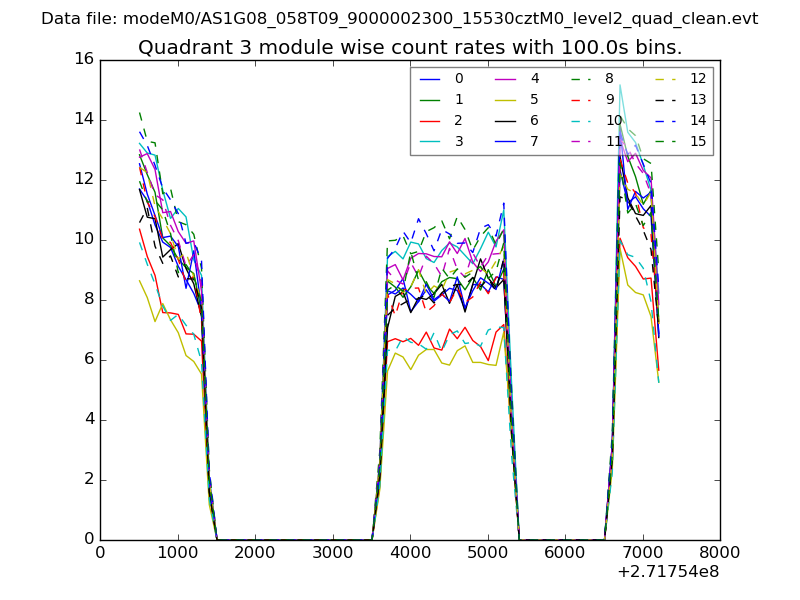
| Module-wise count rates for Quadrant C Data is divided into 100 sec bins |
 |
 |
| Module-wise count rates for Quadrant D Data is divided into 100 sec bins |
 |
 |
| Parameter | Plot |
|---|---|
| CZT HV Monitor | 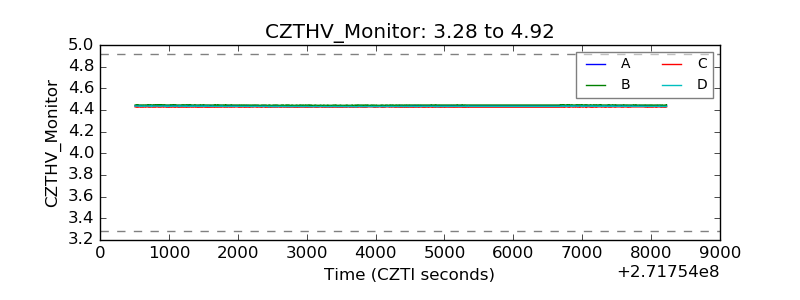 |
| D_VDD | 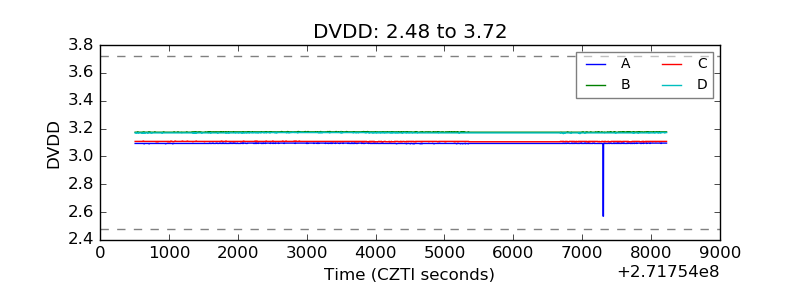 |
| Temperature 1 | 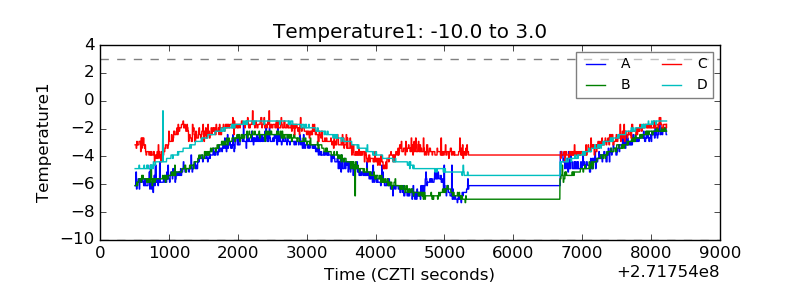 |
| Veto HV Monitor | 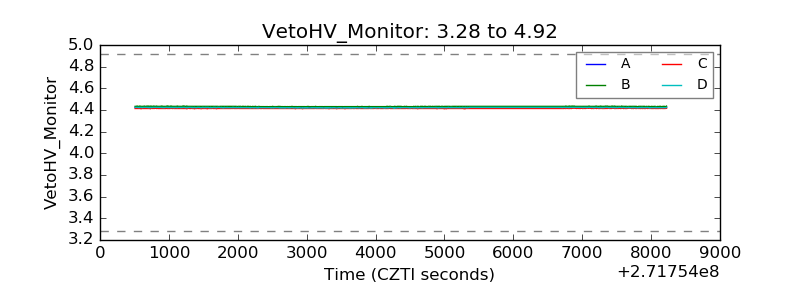 |
| Veto LLD | 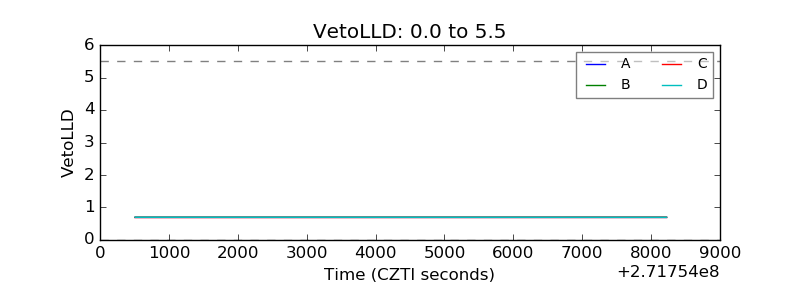 |
| Alpha Counter | 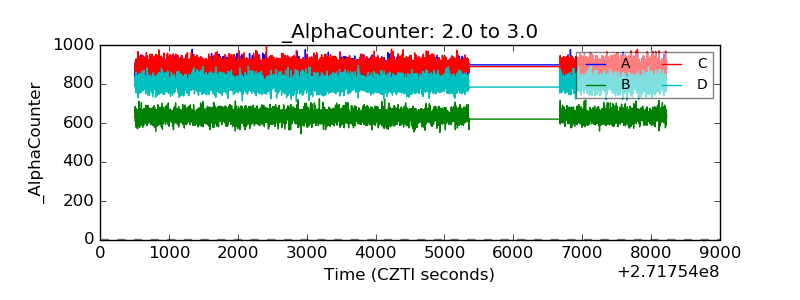 |
| _CPM_Rate | 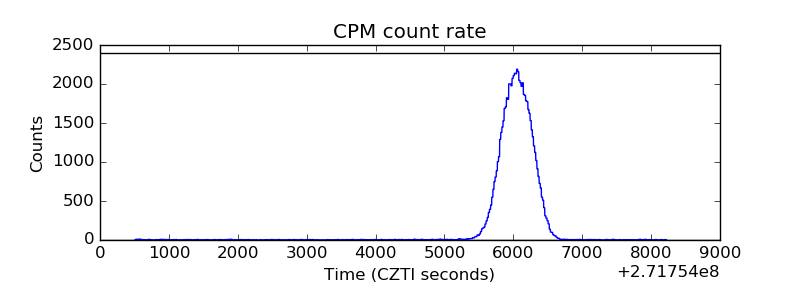 |
| CZT Counter | 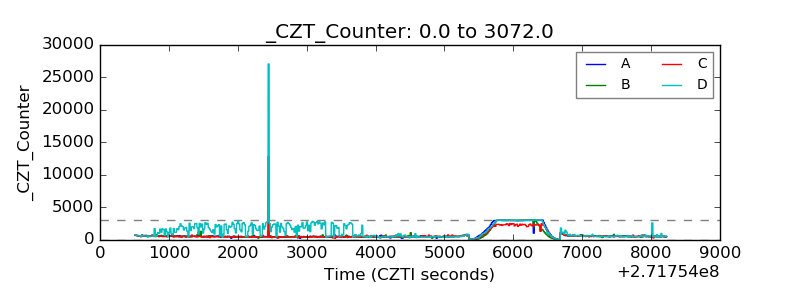 |
| +2.5 Volts monitor |  |
| +5 Volts monitor |  |
| _ROLL_ROT | 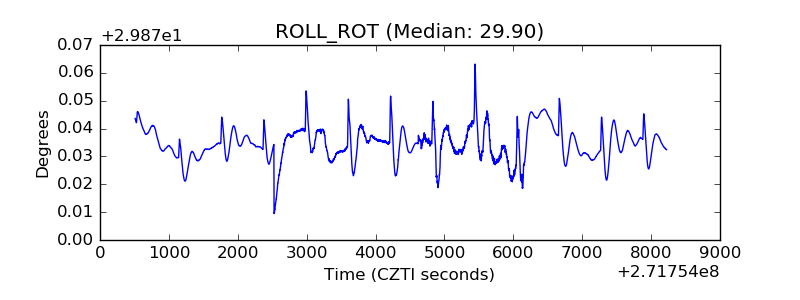 |
| _Roll_DEC | 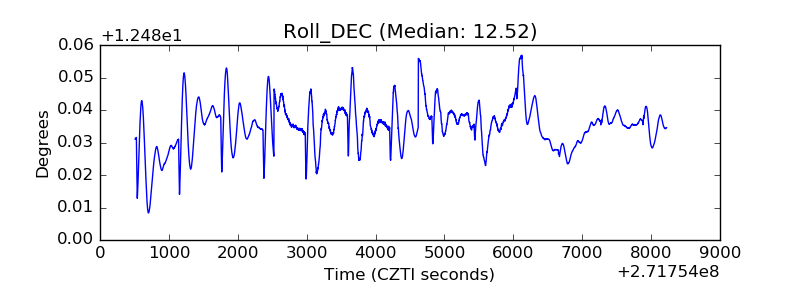 |
| _Roll_RA | 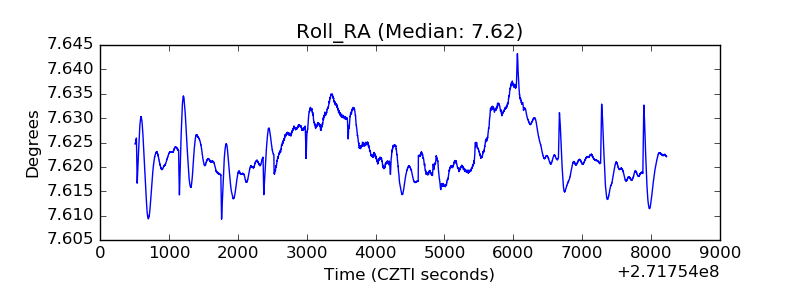 |
| Veto Counter | 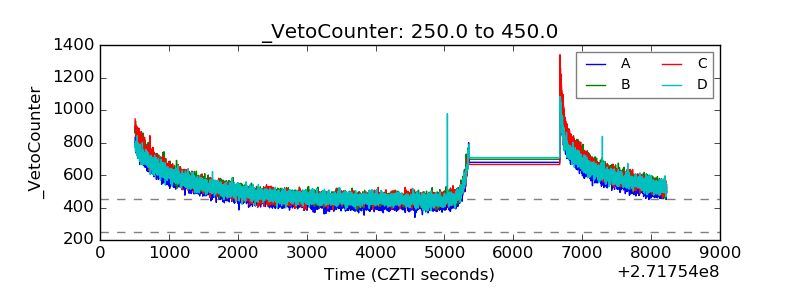 |