| Param | Original file | Final file |
|---|---|---|
| Filename | modeM0/AS1G08_058T09_9000002300_15532cztM0_level2.evt | modeM0/AS1G08_058T09_9000002300_15532cztM0_level2_quad_clean.evt |
| Size (bytes) | 488,574,720 | 65,848,320 |
| Size | 465.9 MB | 62.8 MB |
| Events in quadrant A | 3,780,567 | 393,440 |
| Events in quadrant B | 3,631,623 | 393,309 |
| Events in quadrant C | 3,450,843 | 376,974 |
| Events in quadrant D | 3,493,899 | 378,397 |
| Mode M0 | |||
|---|---|---|---|
| Quadrant | BADHDUFLAG | Total packets | Discarded packets |
| A | 0 | 15146 | 3 |
| B | 0 | 14635 | 2 |
| C | 0 | 13847 | 2 |
| D | 0 | 14255 | 2 |
| Mode M9 | |||
|---|---|---|---|
| Quadrant | BADHDUFLAG | Total packets | Discarded packets |
| A | 0 | 12 | 0 |
| B | 0 | 12 | 0 |
| C | 0 | 12 | 0 |
| D | 0 | 12 | 0 |
| Mode SS | |||
|---|---|---|---|
| Quadrant | BADHDUFLAG | Total packets | Discarded packets |
| A | 0 | 132 | 0 |
| B | 0 | 132 | 0 |
| C | 0 | 132 | 0 |
| D | 0 | 132 | 0 |
| Quadrant | Total seconds | Saturated seconds | Saturation percentage |
|---|---|---|---|
| A | 6471 | 185 | 2.858909% |
| B | 6471 | 156 | 2.410756% |
| C | 6471 | 143 | 2.209859% |
| D | 6471 | 128 | 1.978056% |
Noise dominated data is calculated using 1-second bins in cleaned event files. If a bin has >2000 counts, and if more than 50% of those come from <1% of pixels, then it is considered to be noise-dominated and hence unusable.
| Quadrant | # 1 sec bins | Bins with >0 counts | Bins with >2000 counts | High rate bins dominated by noise | Noise dominated (total time) | Noise dominated (detector-on time) | Marked lightcurve |
|---|---|---|---|---|---|---|---|
| A | 7712 | 6472 | 48 | 48 | 0.62% | 0.74% | 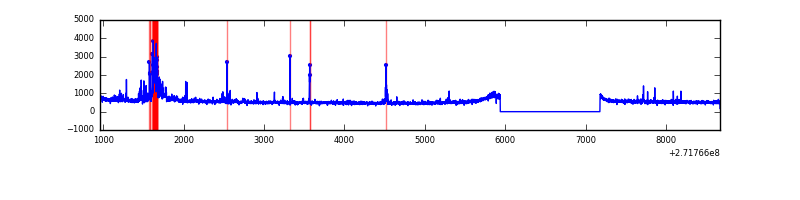 |
| B | 7712 | 6472 | 7 | 7 | 0.09% | 0.11% |  |
| C | 7712 | 6472 | 0 | 0 | 0.00% | 0.00% | 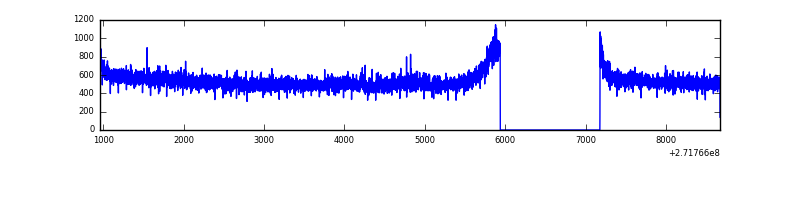 |
| D | 7712 | 6472 | 19 | 19 | 0.25% | 0.29% | 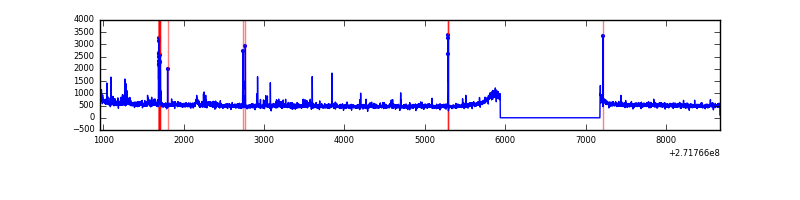 |
Top three noisy pixels from each quadrant. If the there are fewer than three noisy pixels in the level2.evt file, extra rows are filled as -1
| Pixel properties | Quadrant properties | ||||||
|---|---|---|---|---|---|---|---|
| Quadrant | DetID | PixID | Counts | Sigma | Mean | Median | Sigma |
| A | 14 | 238 | 278325 | 1574.54 | 882 | 865 | 176.2 |
| A | 7 | 16 | 43933 | 244.4 | 882 | 865 | 176.2 |
| A | 14 | 237 | 36816 | 204.02 | 882 | 865 | 176.2 |
| B | 4 | 48 | 45590 | 271.14 | 871 | 855 | 165.0 |
| B | 0 | 229 | 34328 | 202.88 | 871 | 855 | 165.0 |
| B | 15 | 201 | 31428 | 185.3 | 871 | 855 | 165.0 |
| C | 14 | 238 | 131004 | 675.68 | 835 | 841 | 192.6 |
| C | 3 | 233 | 46909 | 239.14 | 835 | 841 | 192.6 |
| C | 7 | 247 | 17401 | 85.96 | 835 | 841 | 192.6 |
| D | 12 | 221 | 86976 | 413.25 | 862 | 843 | 208.4 |
| D | 7 | 207 | 65696 | 311.15 | 862 | 843 | 208.4 |
| D | 5 | 222 | 25385 | 117.75 | 862 | 843 | 208.4 |
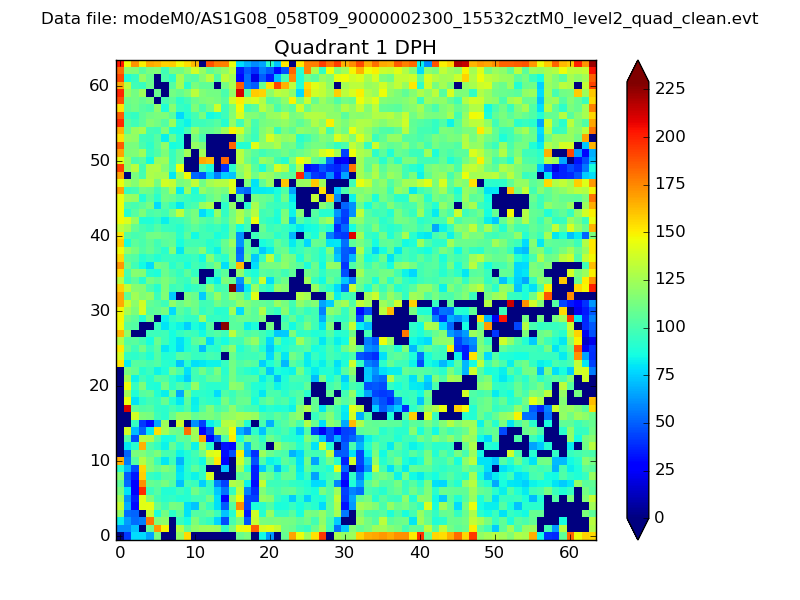
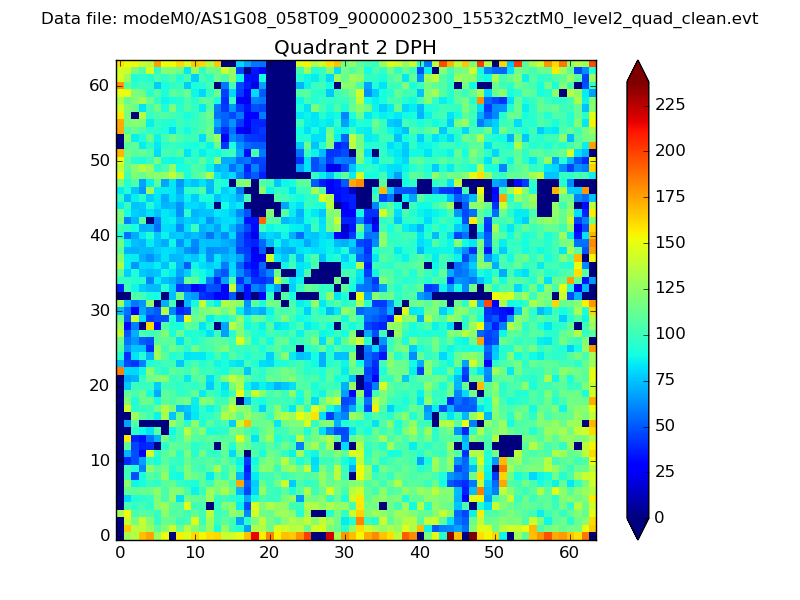
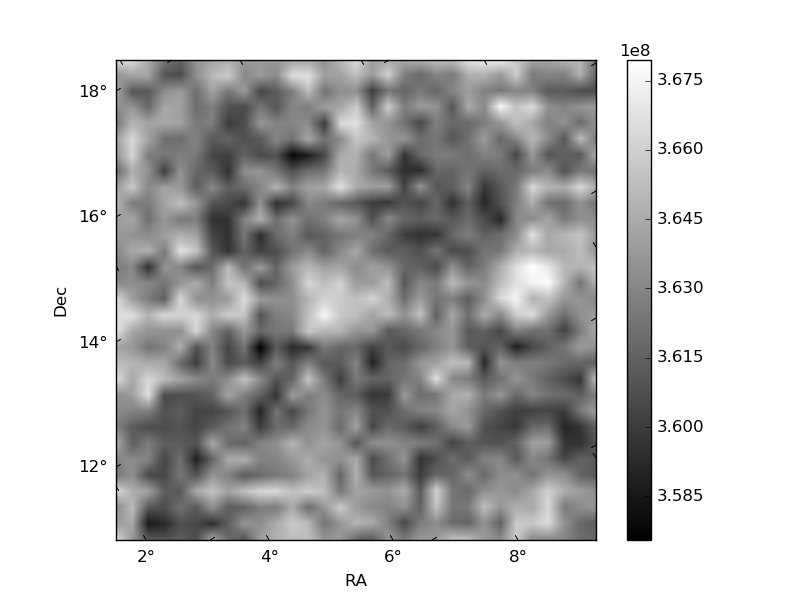
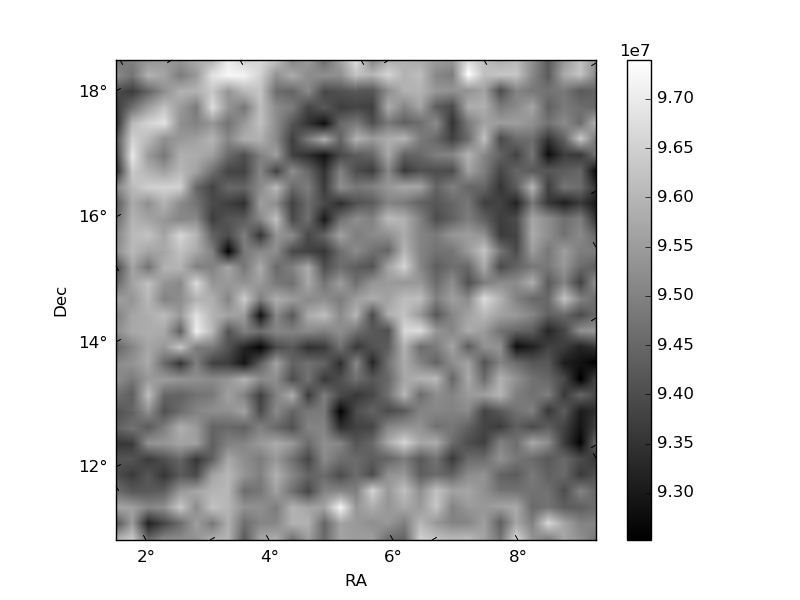
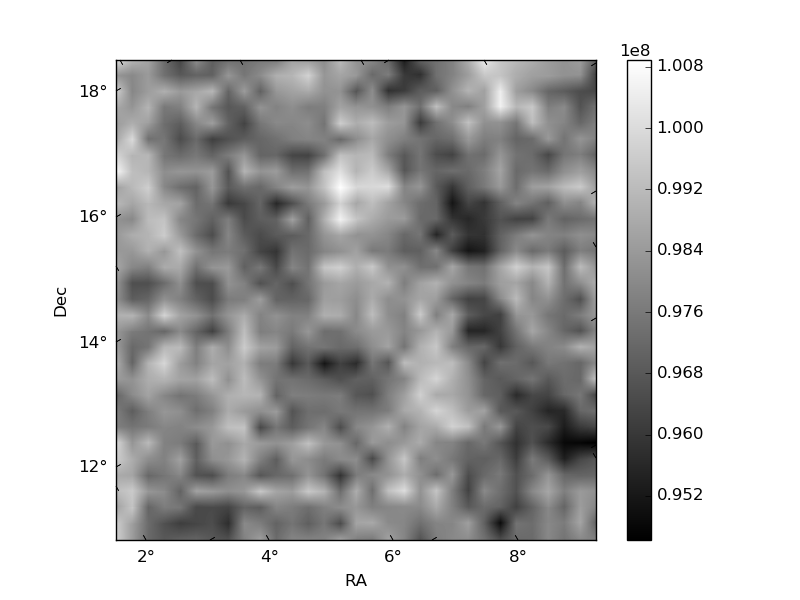
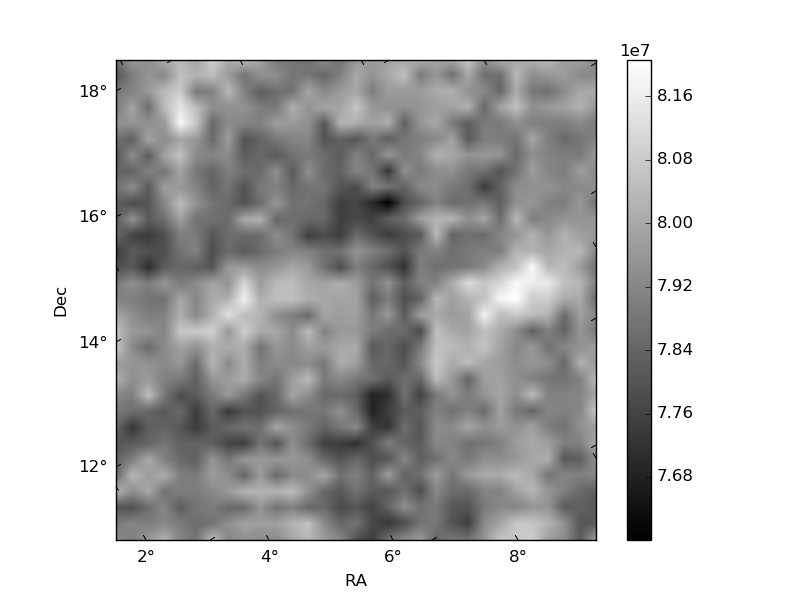
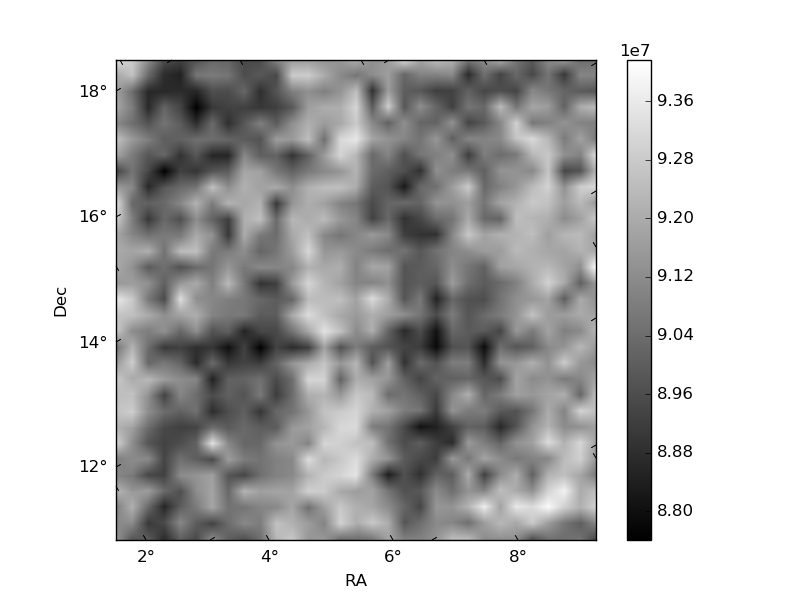
Histogram calculated using DETX and DETY for each event in the final _common_clean file
| Quadrant A | 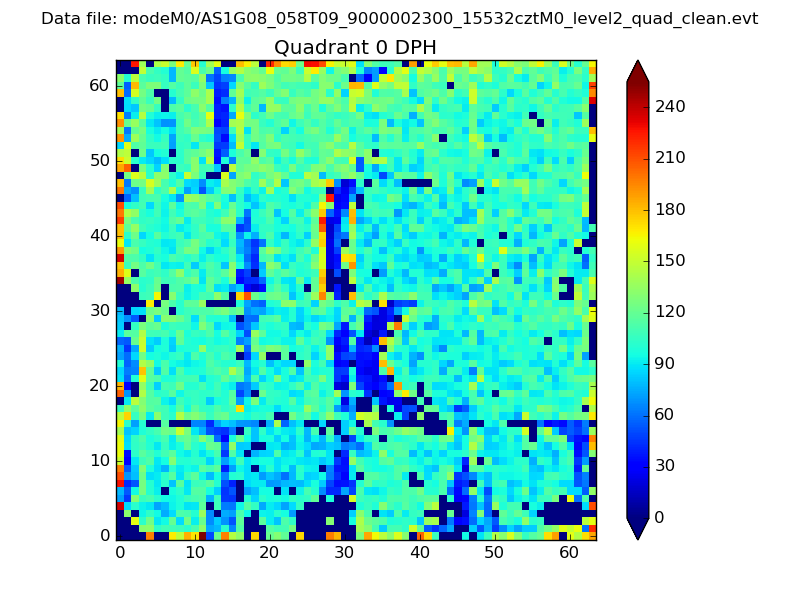 |
 |
Quadrant B |
|---|---|---|---|
| Quadrant D | 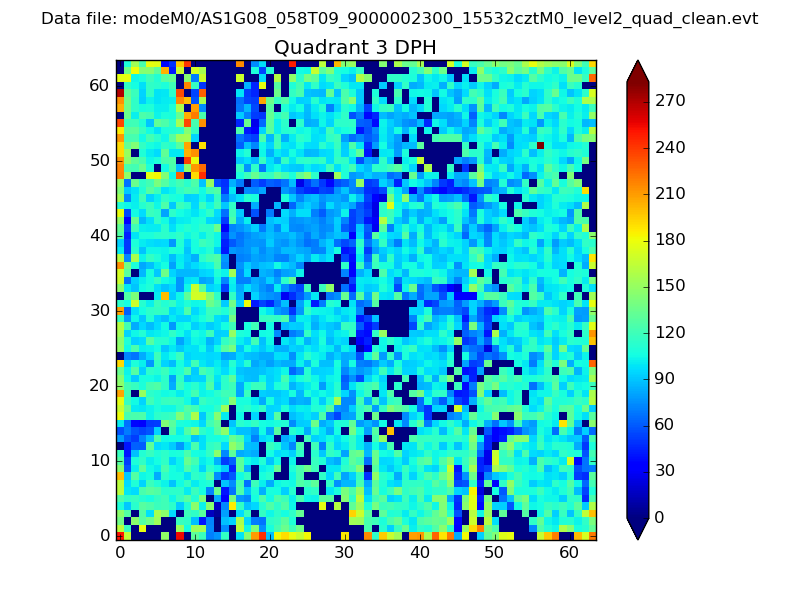 |
 |
Quadrant C |
| Plot type | Count rate plots | Images |
|---|---|---|
| Comparison with Poisson distribution Blue bars denote a histogram of data divided into 1 sec bins. Red curve is a Poisson curve with rate = median count rate of data. |
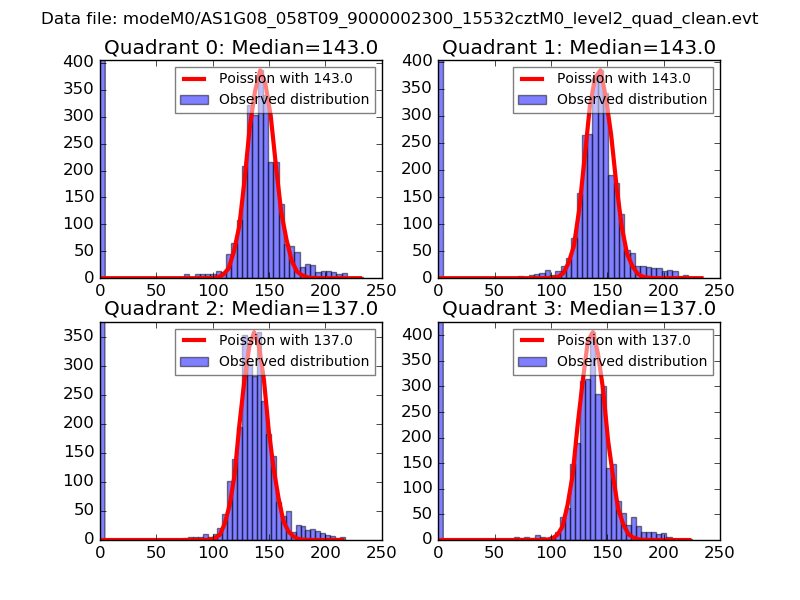 |
 |
| Quadrant-wise count rates Data is divided into 100 sec bins |
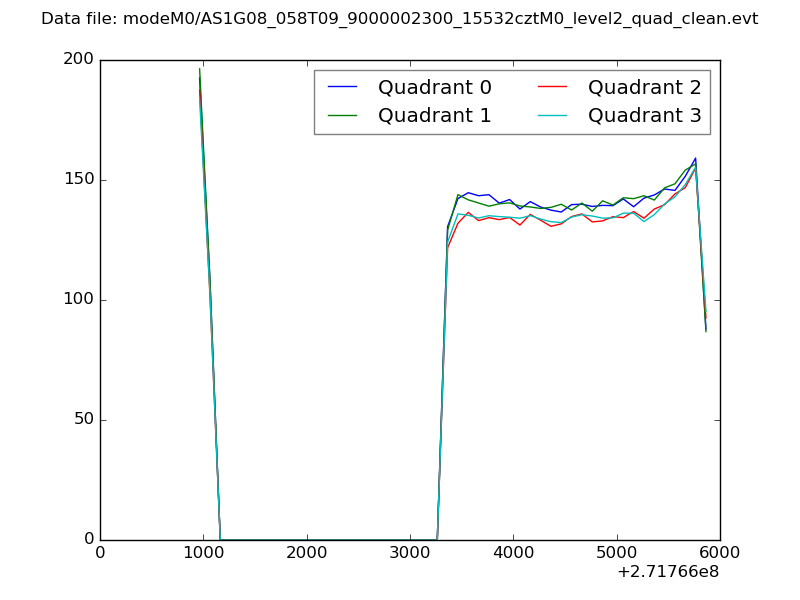 |
|
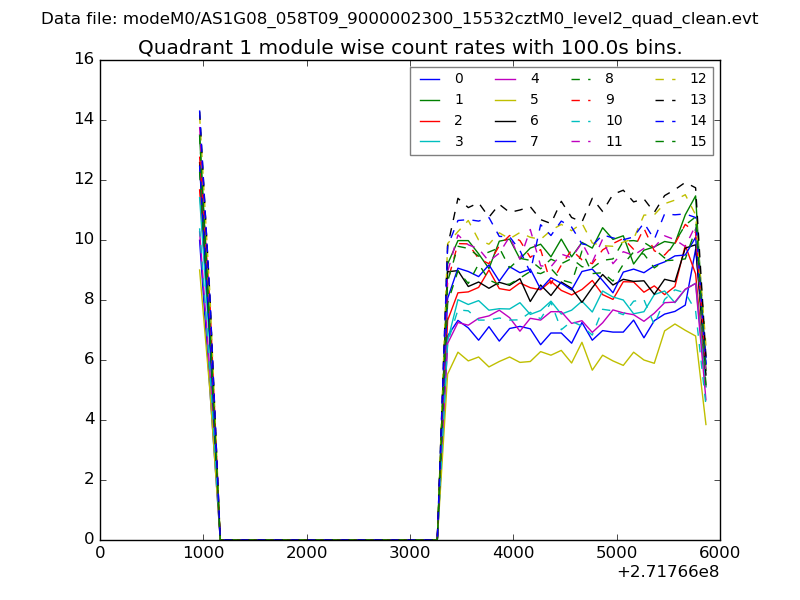
| Module-wise count rates for Quadrant A Data is divided into 100 sec bins |
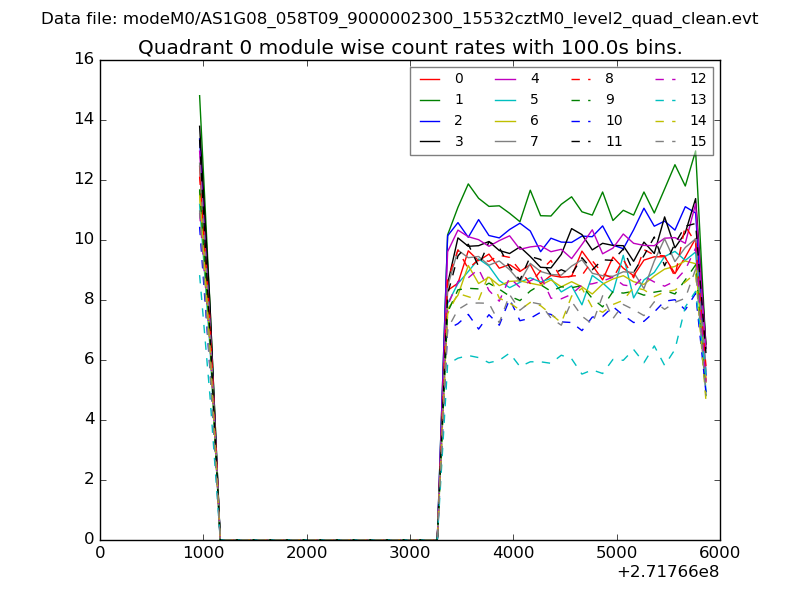 |
 |
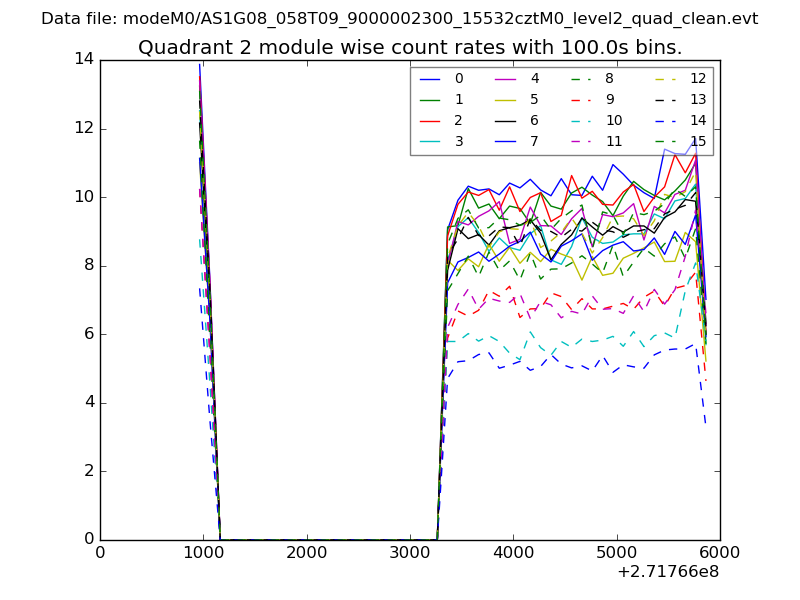
| Module-wise count rates for Quadrant B Data is divided into 100 sec bins |
 |
 |
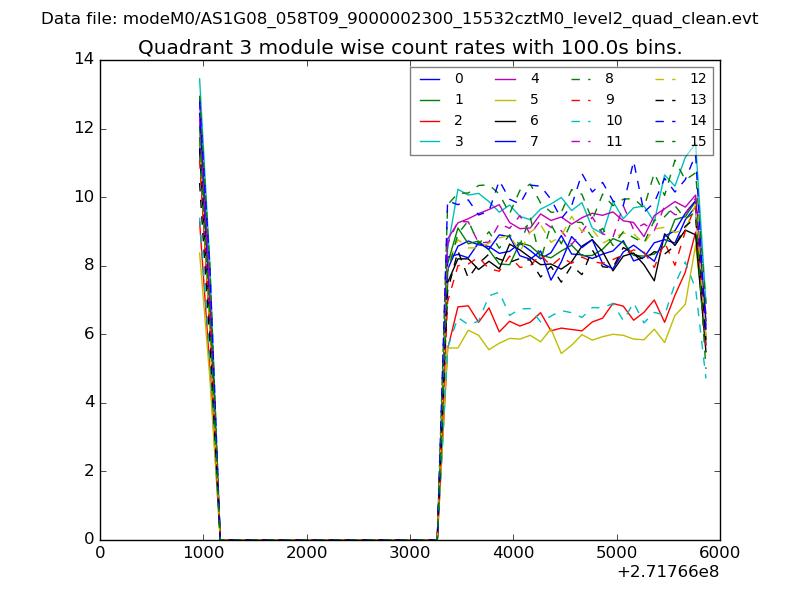
| Module-wise count rates for Quadrant C Data is divided into 100 sec bins |
 |
 |
| Module-wise count rates for Quadrant D Data is divided into 100 sec bins |
 |
 |
| Parameter | Plot |
|---|---|
| CZT HV Monitor | 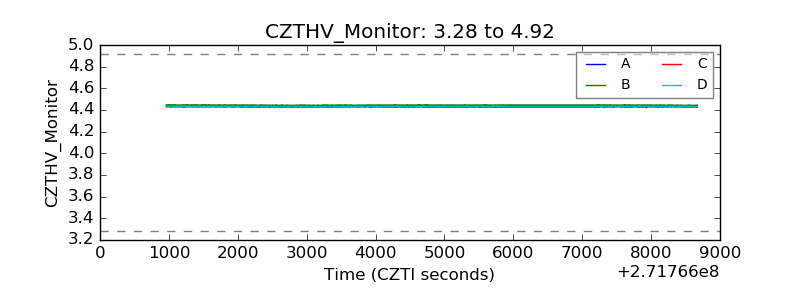 |
| D_VDD | 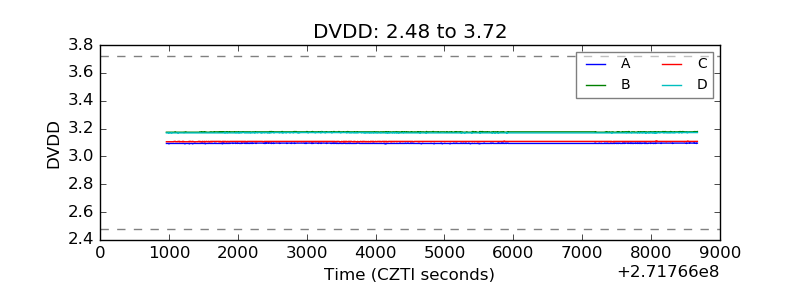 |
| Temperature 1 | 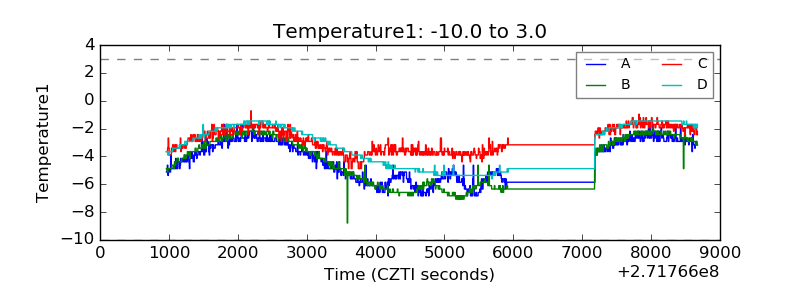 |
| Veto HV Monitor | 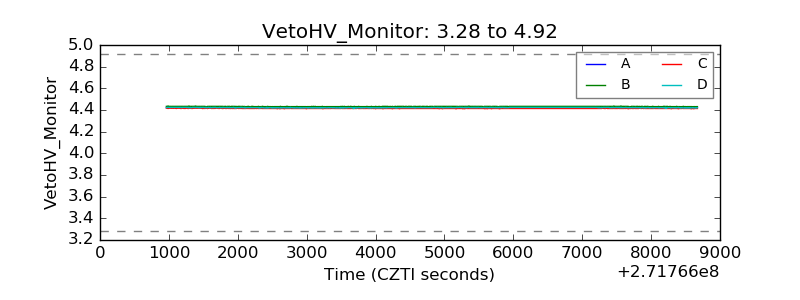 |
| Veto LLD | 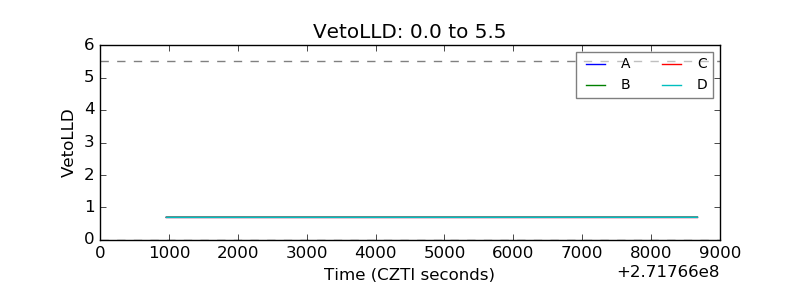 |
| Alpha Counter | 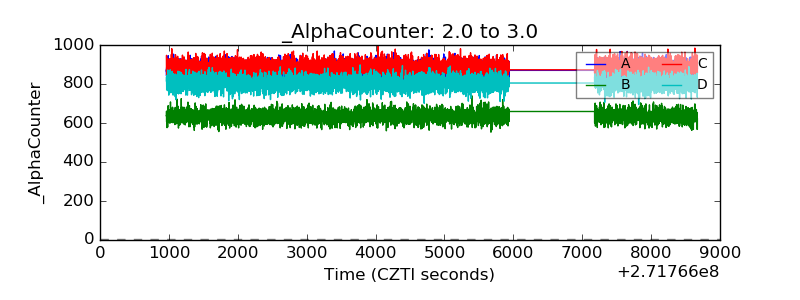 |
| _CPM_Rate | 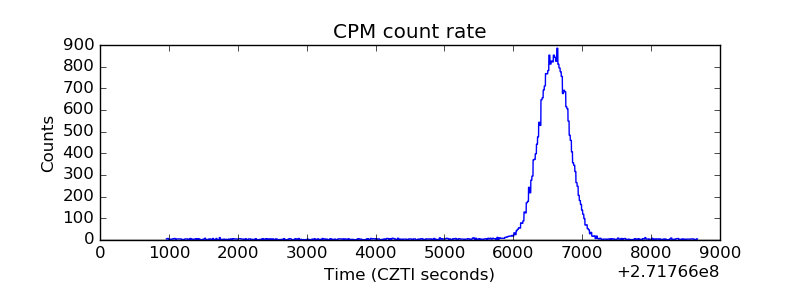 |
| CZT Counter | 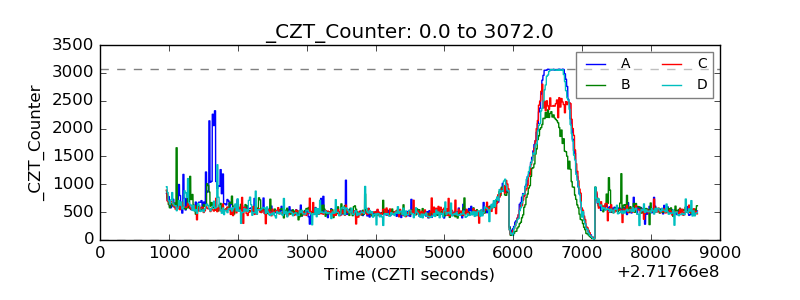 |
| +2.5 Volts monitor |  |
| +5 Volts monitor |  |
| _ROLL_ROT | 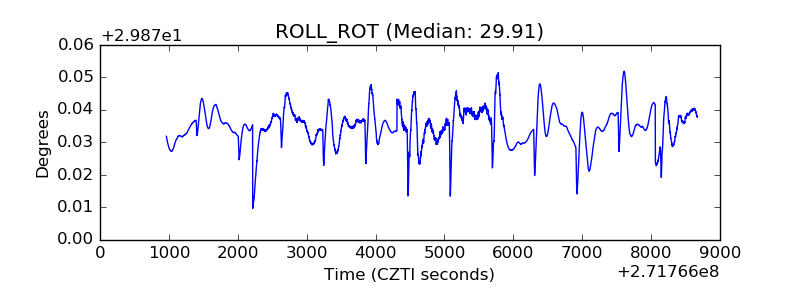 |
| _Roll_DEC | 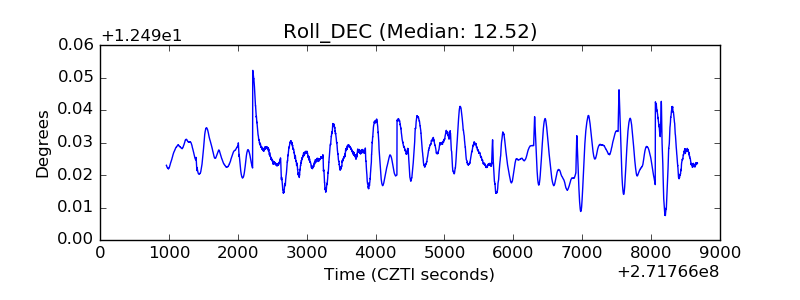 |
| _Roll_RA | 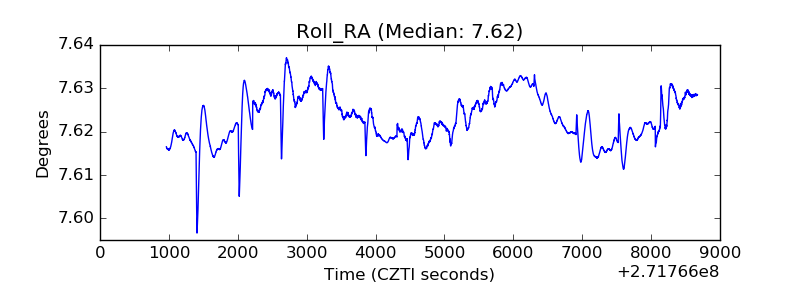 |
| Veto Counter | 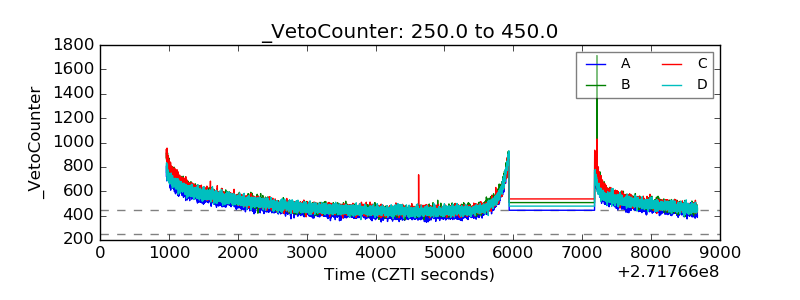 |