| Param | Original file | Final file |
|---|---|---|
| Filename | modeM0/AS1G08_058T09_9000002300_15533cztM0_level2.evt | modeM0/AS1G08_058T09_9000002300_15533cztM0_level2_quad_clean.evt |
| Size (bytes) | 479,160,000 | 71,254,080 |
| Size | 457.0 MB | 68.0 MB |
| Events in quadrant A | 3,371,095 | 432,113 |
| Events in quadrant B | 3,525,634 | 433,404 |
| Events in quadrant C | 3,448,439 | 415,430 |
| Events in quadrant D | 3,718,814 | 417,214 |
| Mode M0 | |||
|---|---|---|---|
| Quadrant | BADHDUFLAG | Total packets | Discarded packets |
| A | 0 | 13916 | 3 |
| B | 0 | 14395 | 2 |
| C | 0 | 14062 | 2 |
| D | 0 | 15137 | 2 |
| Mode M9 | |||
|---|---|---|---|
| Quadrant | BADHDUFLAG | Total packets | Discarded packets |
| A | 0 | 15 | 0 |
| B | 0 | 15 | 0 |
| C | 0 | 15 | 0 |
| D | 0 | 16 | 0 |
| Mode SS | |||
|---|---|---|---|
| Quadrant | BADHDUFLAG | Total packets | Discarded packets |
| A | 0 | 134 | 0 |
| B | 0 | 134 | 0 |
| C | 0 | 134 | 0 |
| D | 0 | 134 | 0 |
| Quadrant | Total seconds | Saturated seconds | Saturation percentage |
|---|---|---|---|
| A | 6591 | 103 | 1.562737% |
| B | 6591 | 123 | 1.866181% |
| C | 6591 | 124 | 1.881353% |
| D | 6591 | 265 | 4.020634% |
Noise dominated data is calculated using 1-second bins in cleaned event files. If a bin has >2000 counts, and if more than 50% of those come from <1% of pixels, then it is considered to be noise-dominated and hence unusable.
| Quadrant | # 1 sec bins | Bins with >0 counts | Bins with >2000 counts | High rate bins dominated by noise | Noise dominated (total time) | Noise dominated (detector-on time) | Marked lightcurve |
|---|---|---|---|---|---|---|---|
| A | 7592 | 6593 | 0 | 0 | 0.00% | 0.00% | 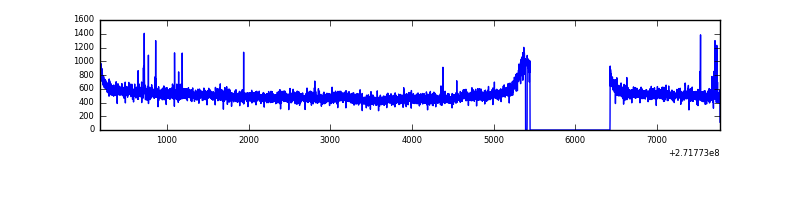 |
| B | 7592 | 6593 | 1 | 1 | 0.01% | 0.02% | 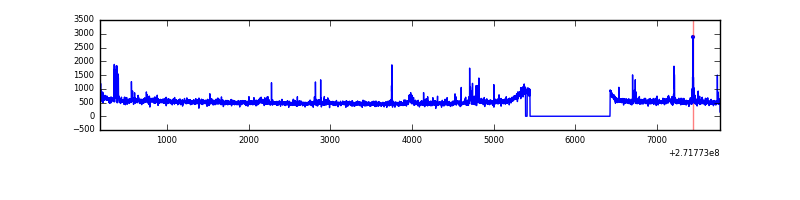 |
| C | 7592 | 6593 | 0 | 0 | 0.00% | 0.00% | 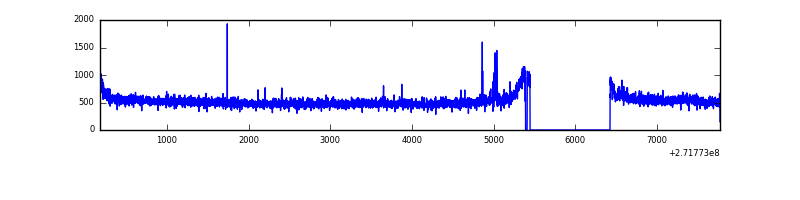 |
| D | 7592 | 6593 | 162 | 162 | 2.13% | 2.46% | 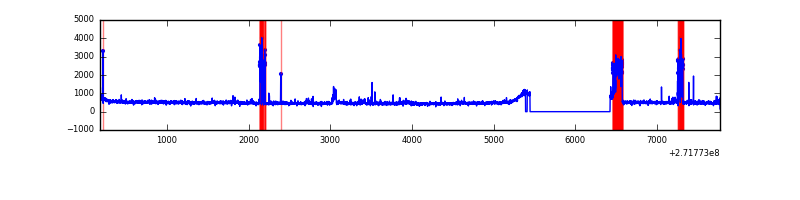 |
Top three noisy pixels from each quadrant. If the there are fewer than three noisy pixels in the level2.evt file, extra rows are filled as -1
| Pixel properties | Quadrant properties | ||||||
|---|---|---|---|---|---|---|---|
| Quadrant | DetID | PixID | Counts | Sigma | Mean | Median | Sigma |
| A | 0 | 253 | 34891 | 196.27 | 861 | 843 | 173.5 |
| A | 7 | 16 | 16039 | 87.6 | 861 | 843 | 173.5 |
| A | 0 | 226 | 7523 | 38.51 | 861 | 843 | 173.5 |
| B | 4 | 48 | 47215 | 282.67 | 853 | 835 | 164.1 |
| B | 0 | 197 | 22797 | 133.85 | 853 | 835 | 164.1 |
| B | 0 | 189 | 21656 | 126.9 | 853 | 835 | 164.1 |
| C | 14 | 238 | 124677 | 651.72 | 816 | 822 | 190.0 |
| C | 3 | 233 | 111321 | 581.44 | 816 | 822 | 190.0 |
| C | 9 | 54 | 10845 | 52.74 | 816 | 822 | 190.0 |
| D | 1 | 52 | 377875 | 1848.35 | 829 | 805 | 204.0 |
| D | 13 | 172 | 103289 | 502.36 | 829 | 805 | 204.0 |
| D | 5 | 222 | 76461 | 370.86 | 829 | 805 | 204.0 |
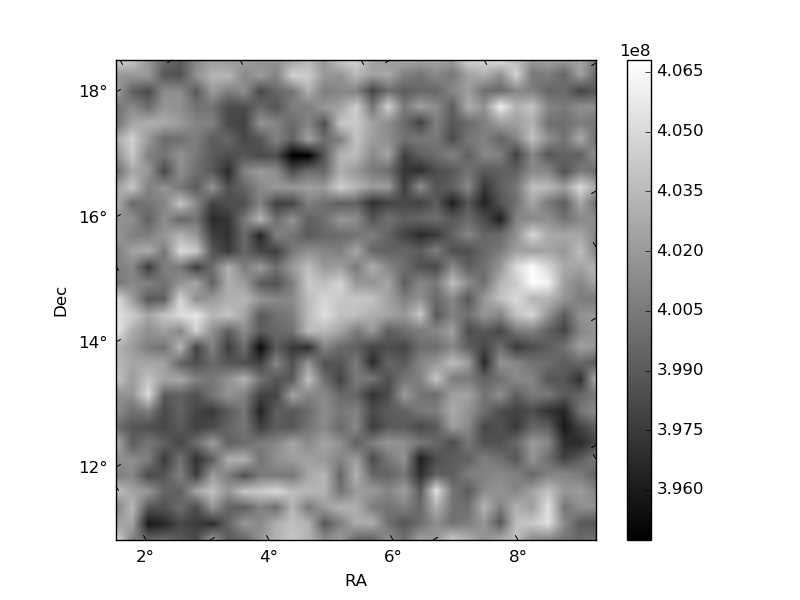
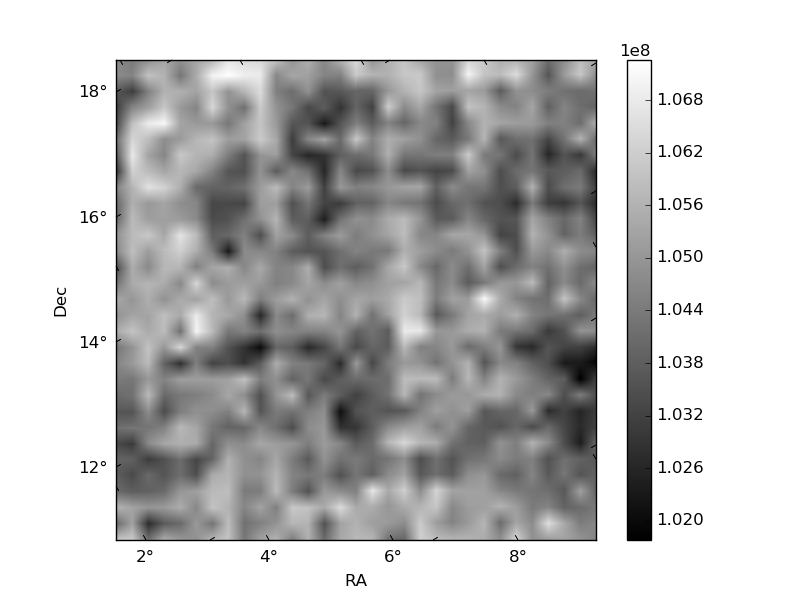
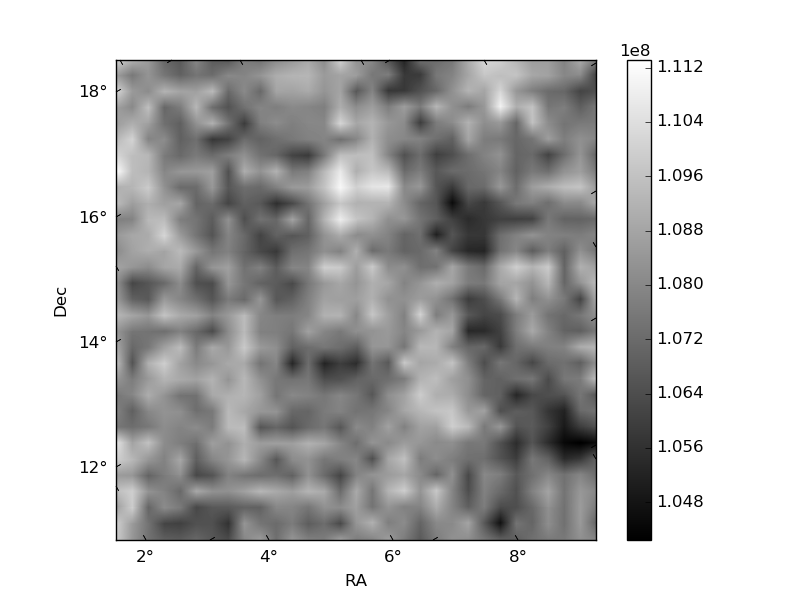
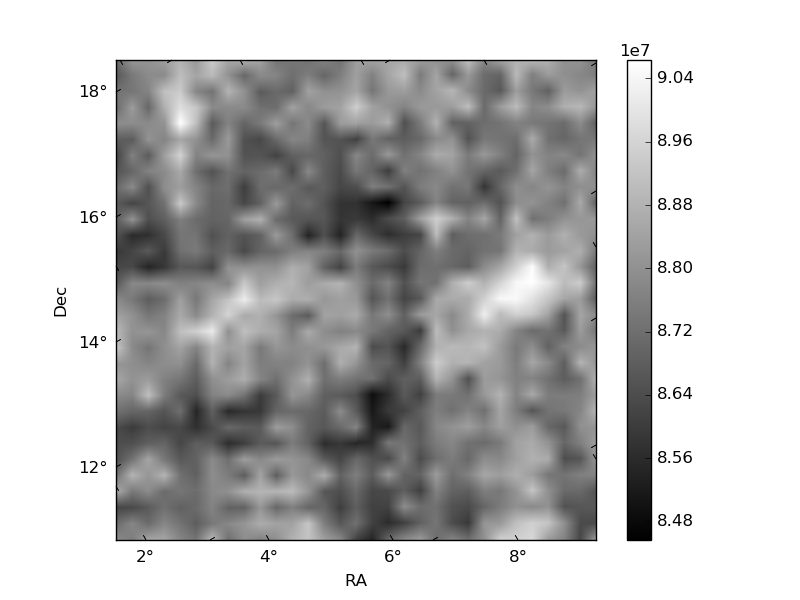
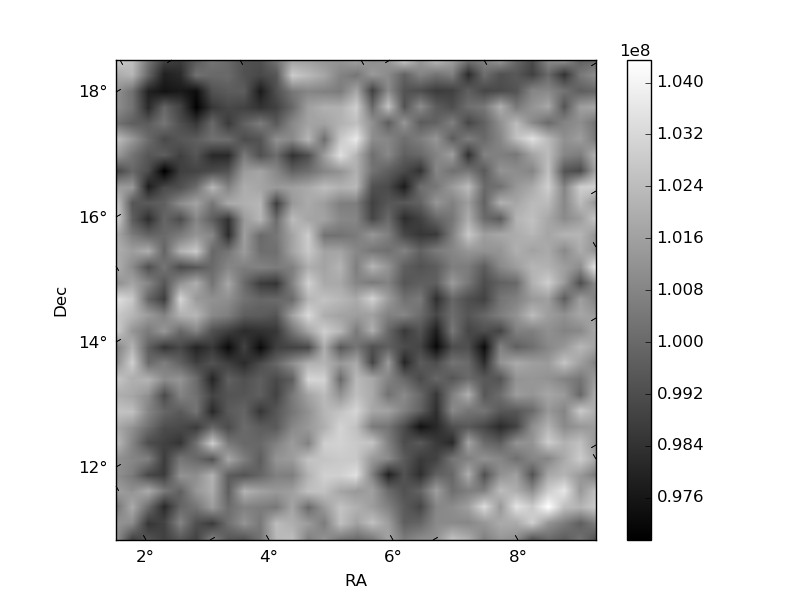
Histogram calculated using DETX and DETY for each event in the final _common_clean file
| Quadrant A | 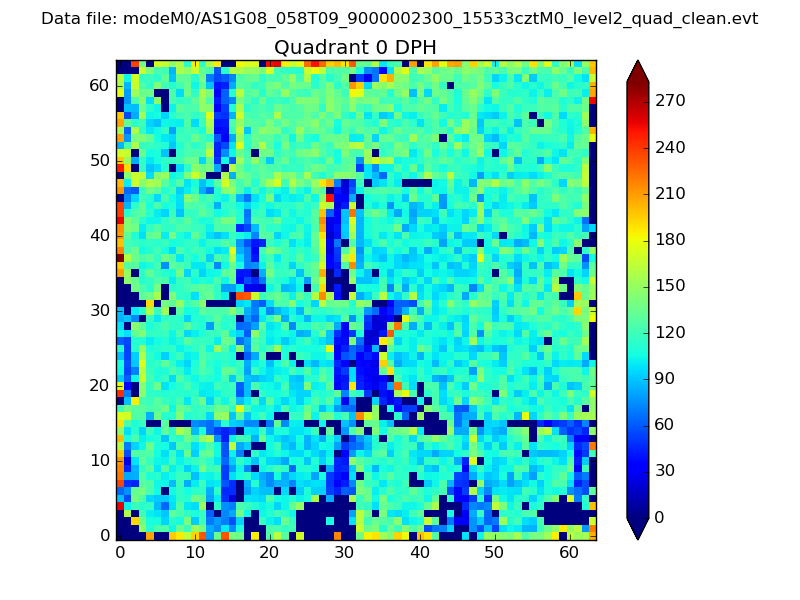 |
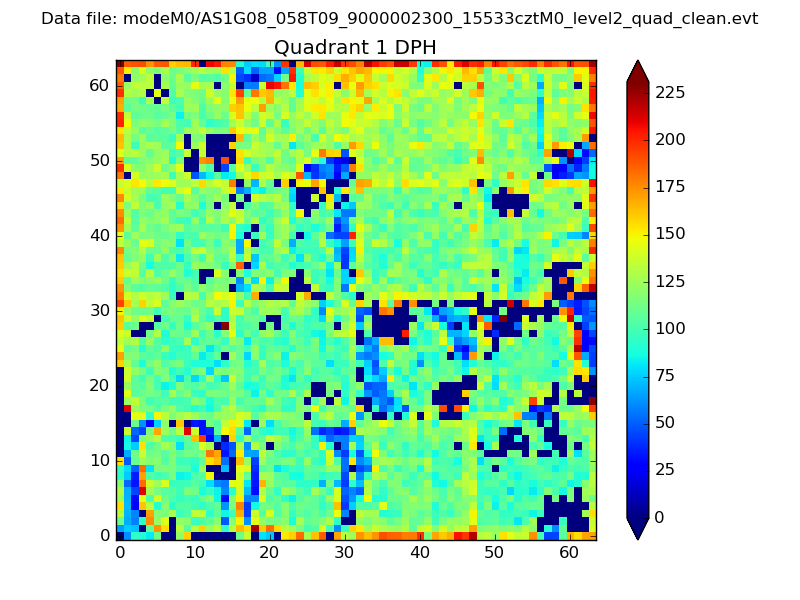 |
Quadrant B |
|---|---|---|---|
| Quadrant D | 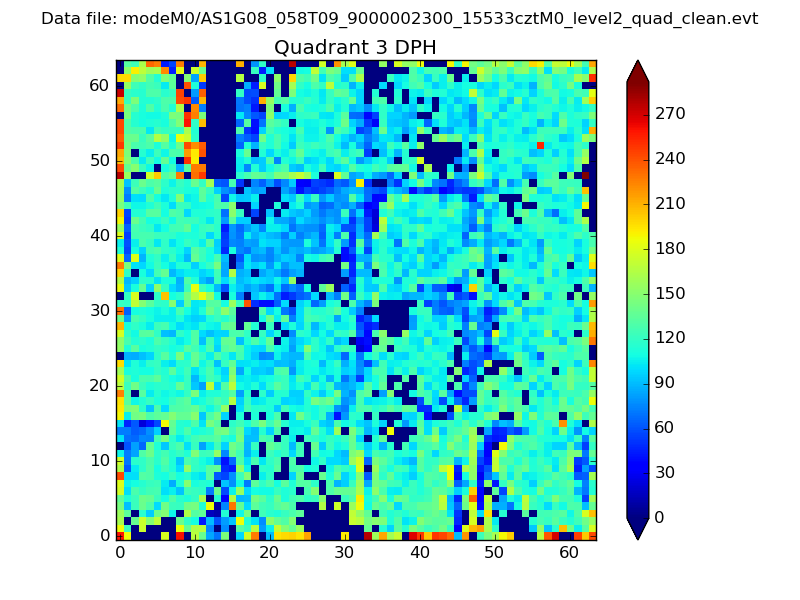 |
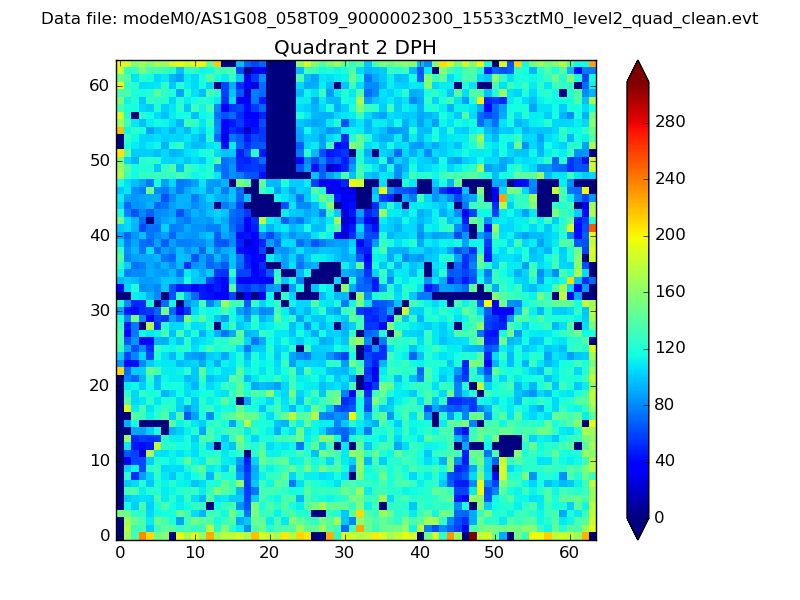 |
Quadrant C |
| Plot type | Count rate plots | Images |
|---|---|---|
| Comparison with Poisson distribution Blue bars denote a histogram of data divided into 1 sec bins. Red curve is a Poisson curve with rate = median count rate of data. |
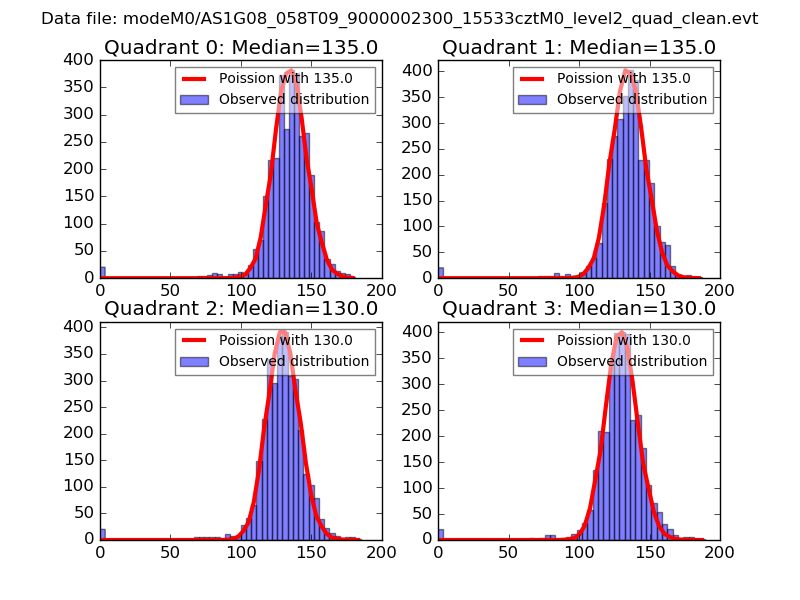 |
 |
| Quadrant-wise count rates Data is divided into 100 sec bins |
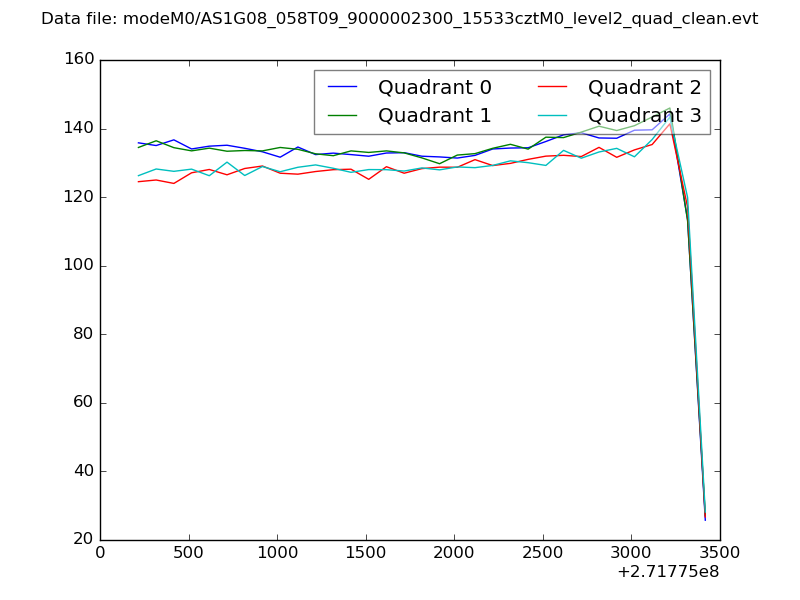 |
|
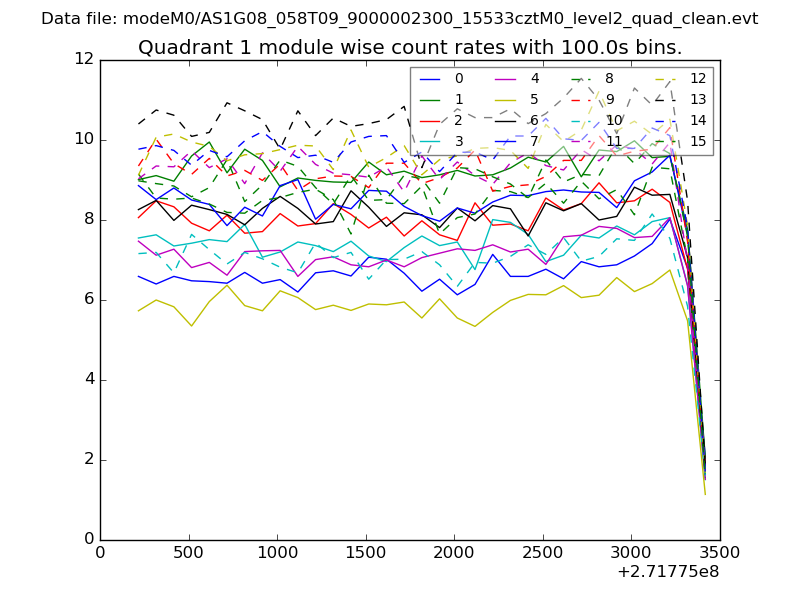
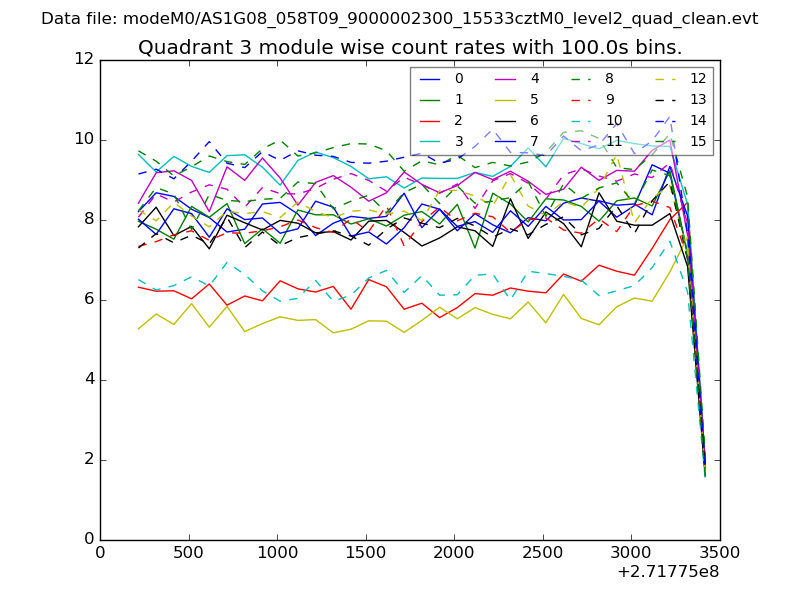
| Module-wise count rates for Quadrant A Data is divided into 100 sec bins |
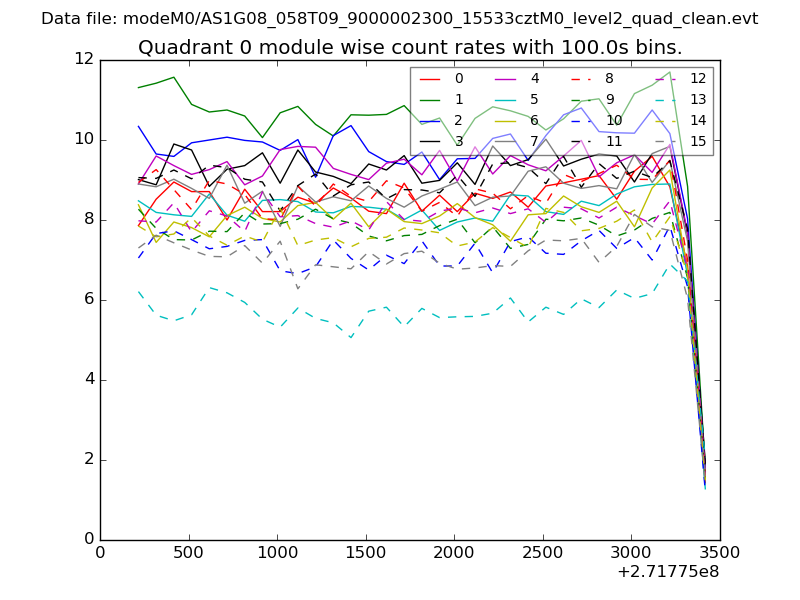 |
 |
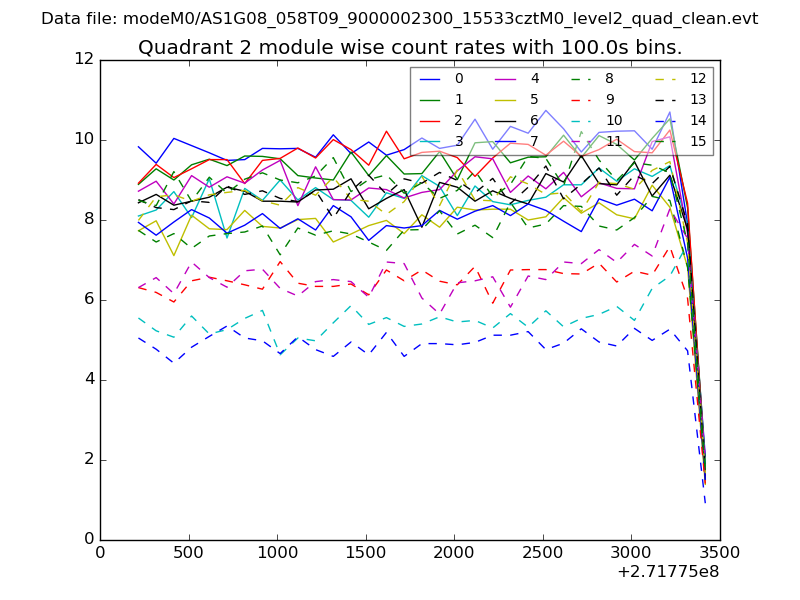
| Module-wise count rates for Quadrant B Data is divided into 100 sec bins |
 |
 |
| Module-wise count rates for Quadrant C Data is divided into 100 sec bins |
 |
 |
| Module-wise count rates for Quadrant D Data is divided into 100 sec bins |
 |
 |
| Parameter | Plot |
|---|---|
| CZT HV Monitor | 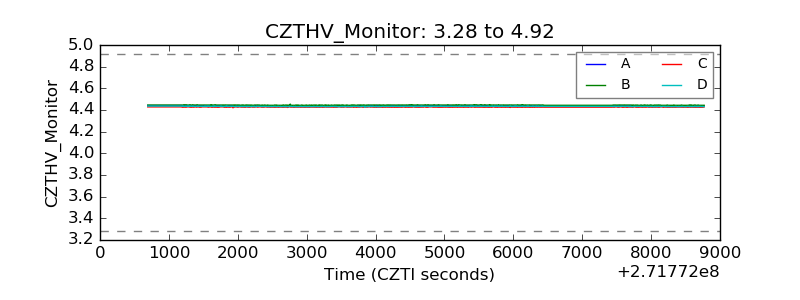 |
| D_VDD | 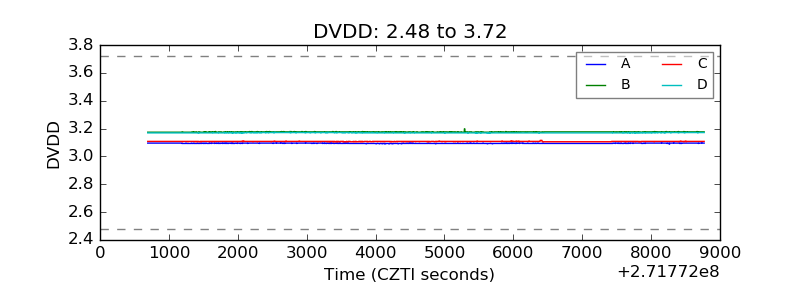 |
| Temperature 1 | 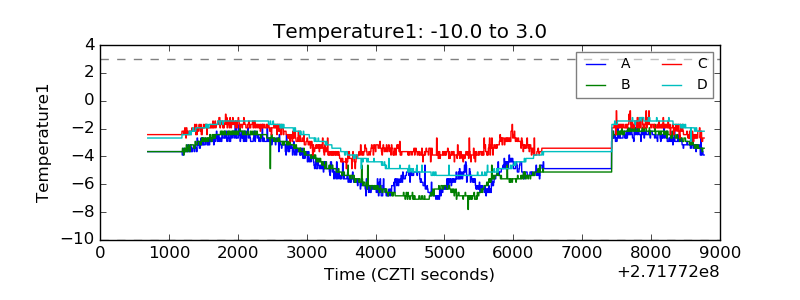 |
| Veto HV Monitor |  |
| Veto LLD | 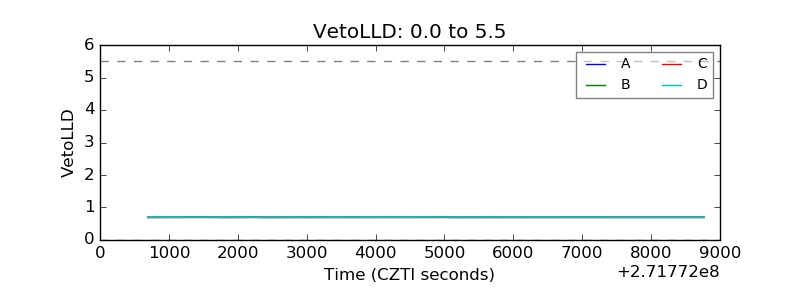 |
| Alpha Counter | 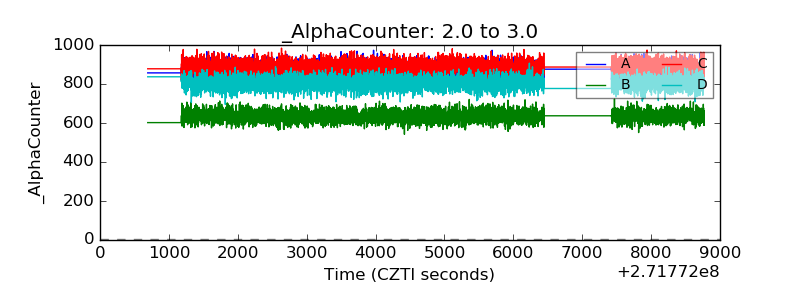 |
| _CPM_Rate | 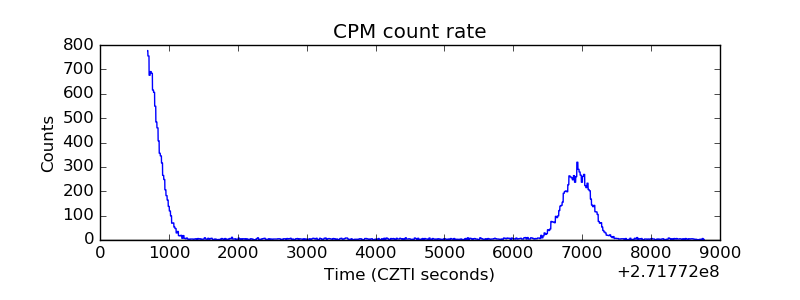 |
| CZT Counter | 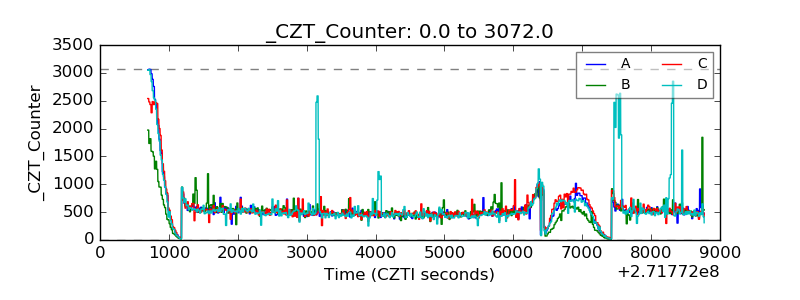 |
| +2.5 Volts monitor |  |
| +5 Volts monitor |  |
| _ROLL_ROT | 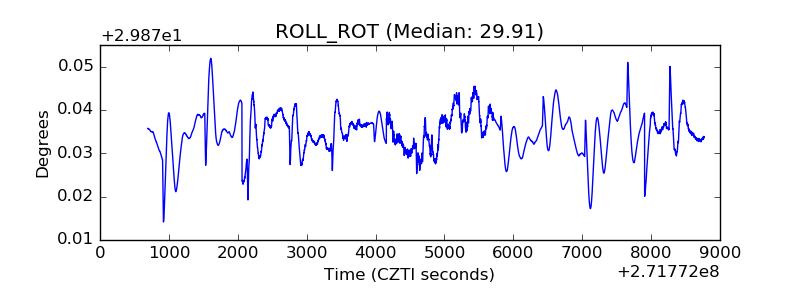 |
| _Roll_DEC | 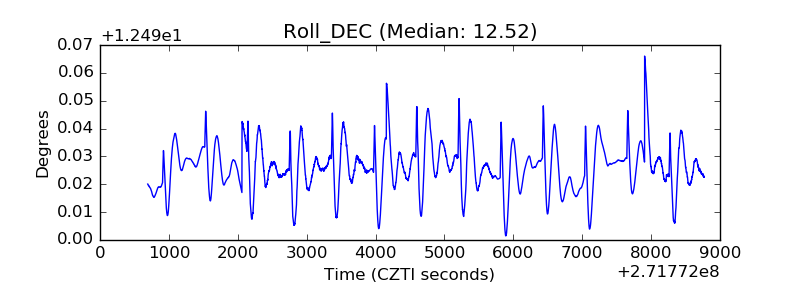 |
| _Roll_RA | 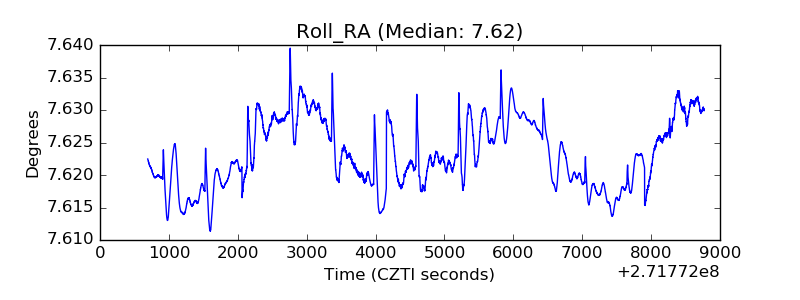 |
| Veto Counter | 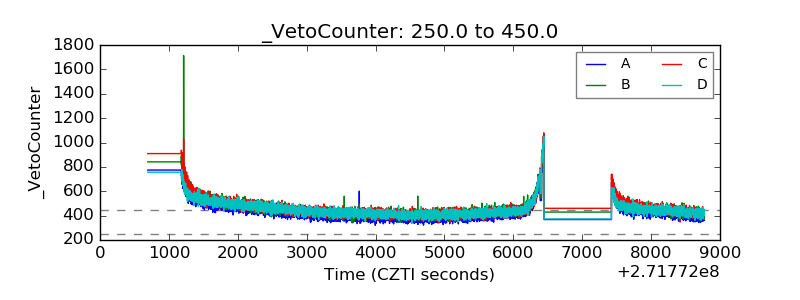 |