| Param | Original file | Final file |
|---|---|---|
| Filename | modeM0/AS1G08_058T09_9000002300_15535cztM0_level2.evt | modeM0/AS1G08_058T09_9000002300_15535cztM0_level2_quad_clean.evt |
| Size (bytes) | 525,905,280 | 83,767,680 |
| Size | 501.5 MB | 79.9 MB |
| Events in quadrant A | 3,602,125 | 517,098 |
| Events in quadrant B | 3,800,834 | 517,271 |
| Events in quadrant C | 3,612,382 | 495,058 |
| Events in quadrant D | 4,406,905 | 489,664 |
| Mode M0 | |||
|---|---|---|---|
| Quadrant | BADHDUFLAG | Total packets | Discarded packets |
| A | 0 | 15388 | 3 |
| B | 0 | 15990 | 2 |
| C | 0 | 15369 | 2 |
| D | 0 | 18080 | 2 |
| Mode M9 | |||
|---|---|---|---|
| Quadrant | BADHDUFLAG | Total packets | Discarded packets |
| A | 0 | 7 | 0 |
| B | 0 | 7 | 0 |
| C | 0 | 7 | 0 |
| D | 0 | 8 | 0 |
| Mode SS | |||
|---|---|---|---|
| Quadrant | BADHDUFLAG | Total packets | Discarded packets |
| A | 0 | 150 | 0 |
| B | 0 | 150 | 0 |
| C | 0 | 150 | 0 |
| D | 0 | 150 | 0 |
| Quadrant | Total seconds | Saturated seconds | Saturation percentage |
|---|---|---|---|
| A | 7437 | 58 | 0.779884% |
| B | 7437 | 105 | 1.411860% |
| C | 7437 | 108 | 1.452198% |
| D | 7437 | 296 | 3.980100% |
Noise dominated data is calculated using 1-second bins in cleaned event files. If a bin has >2000 counts, and if more than 50% of those come from <1% of pixels, then it is considered to be noise-dominated and hence unusable.
| Quadrant | # 1 sec bins | Bins with >0 counts | Bins with >2000 counts | High rate bins dominated by noise | Noise dominated (total time) | Noise dominated (detector-on time) | Marked lightcurve |
|---|---|---|---|---|---|---|---|
| A | 7713 | 7439 | 1 | 1 | 0.01% | 0.01% | 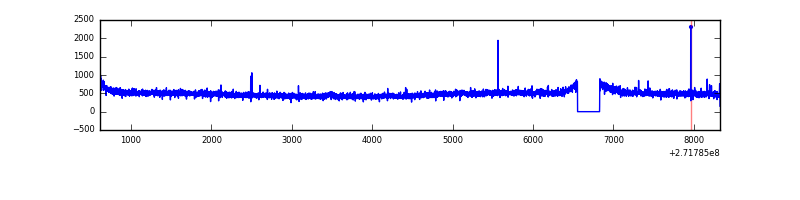 |
| B | 7713 | 7439 | 6 | 6 | 0.08% | 0.08% | 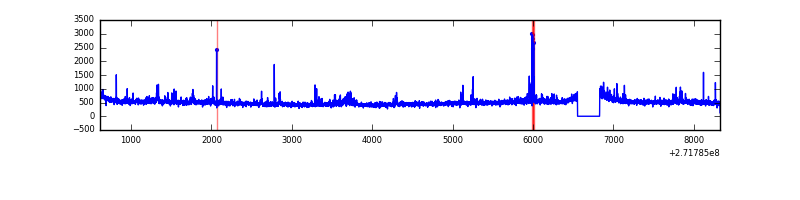 |
| C | 7713 | 7438 | 1 | 1 | 0.01% | 0.01% | 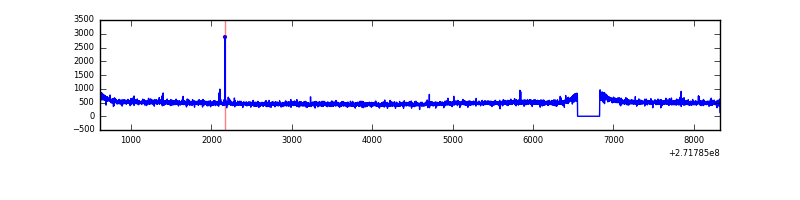 |
| D | 7713 | 7439 | 194 | 194 | 2.52% | 2.61% | 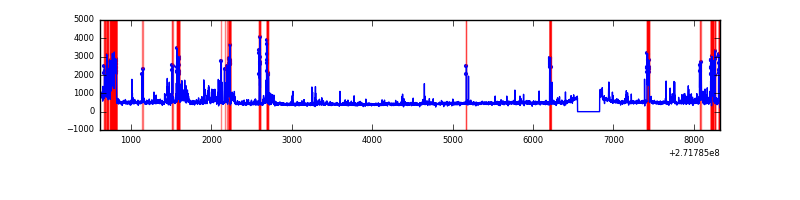 |
Top three noisy pixels from each quadrant. If the there are fewer than three noisy pixels in the level2.evt file, extra rows are filled as -1
| Pixel properties | Quadrant properties | ||||||
|---|---|---|---|---|---|---|---|
| Quadrant | DetID | PixID | Counts | Sigma | Mean | Median | Sigma |
| A | 0 | 253 | 60178 | 319.22 | 917 | 898 | 185.7 |
| A | 0 | 226 | 8105 | 38.81 | 917 | 898 | 185.7 |
| A | 9 | 143 | 7661 | 36.42 | 917 | 898 | 185.7 |
| B | 6 | 36 | 40325 | 223.77 | 912 | 889 | 176.2 |
| B | 0 | 197 | 34892 | 192.94 | 912 | 889 | 176.2 |
| B | 15 | 201 | 30385 | 167.37 | 912 | 889 | 176.2 |
| C | 14 | 238 | 134373 | 652.21 | 872 | 877 | 204.7 |
| C | 3 | 233 | 37529 | 179.07 | 872 | 877 | 204.7 |
| C | 8 | 128 | 12540 | 56.98 | 872 | 877 | 204.7 |
| D | 2 | 33 | 434347 | 2019.69 | 878 | 851 | 214.6 |
| D | 1 | 52 | 330609 | 1536.37 | 878 | 851 | 214.6 |
| D | 5 | 222 | 121847 | 563.73 | 878 | 851 | 214.6 |
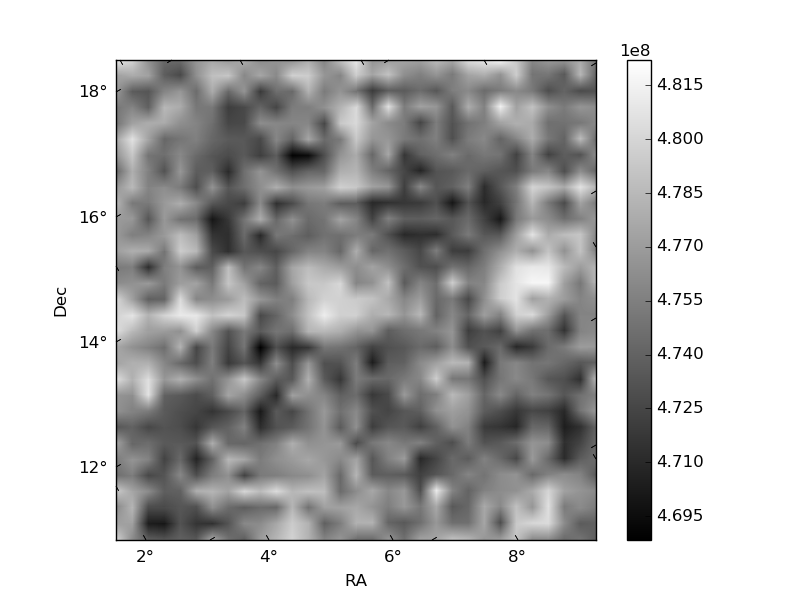
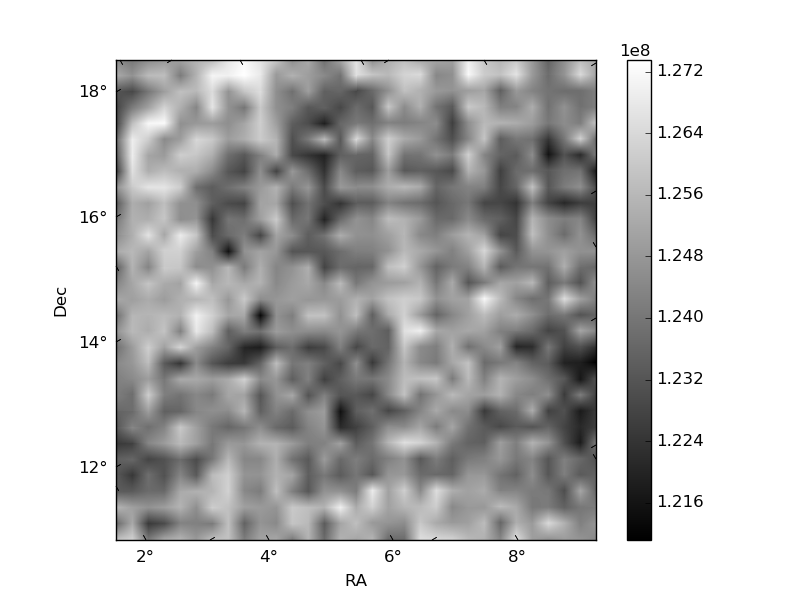
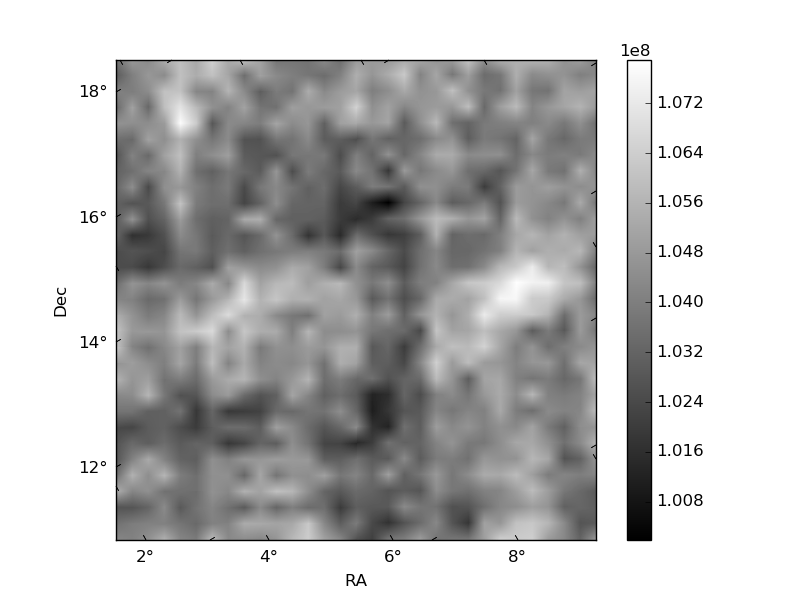
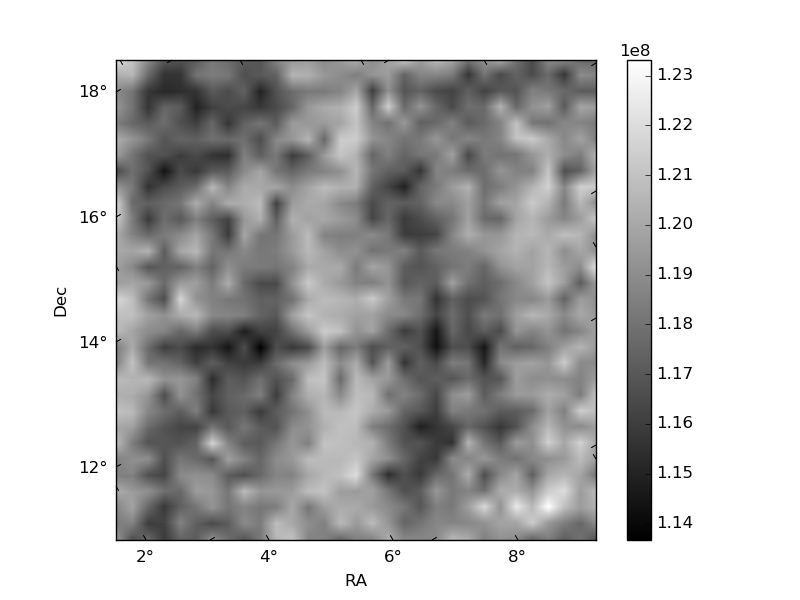
Histogram calculated using DETX and DETY for each event in the final _common_clean file
| Quadrant A | 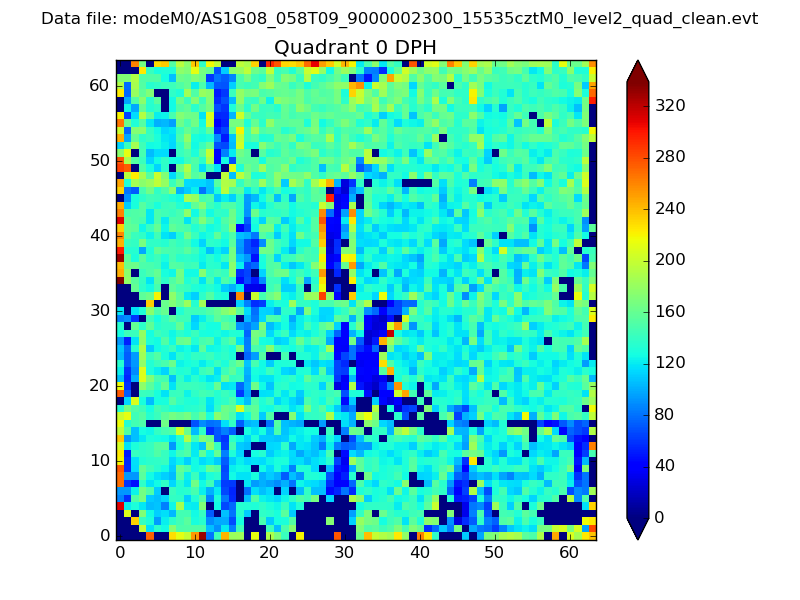 |
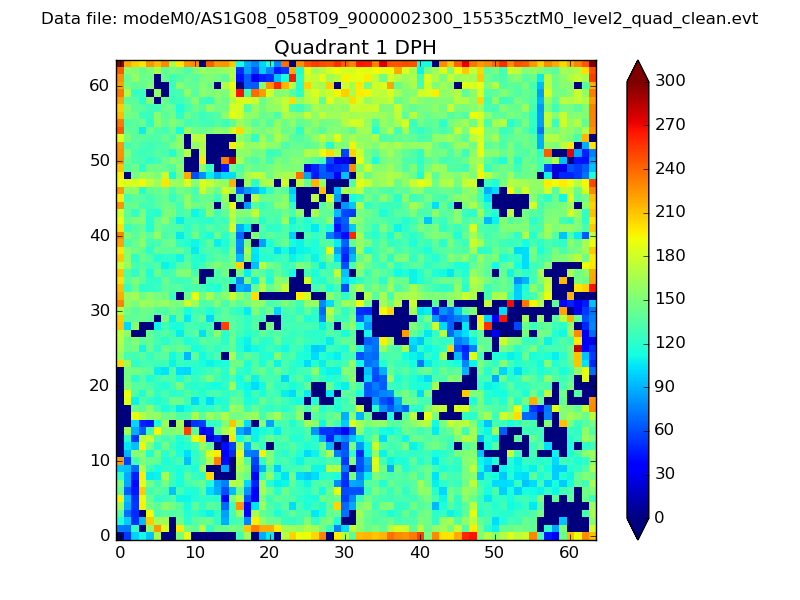 |
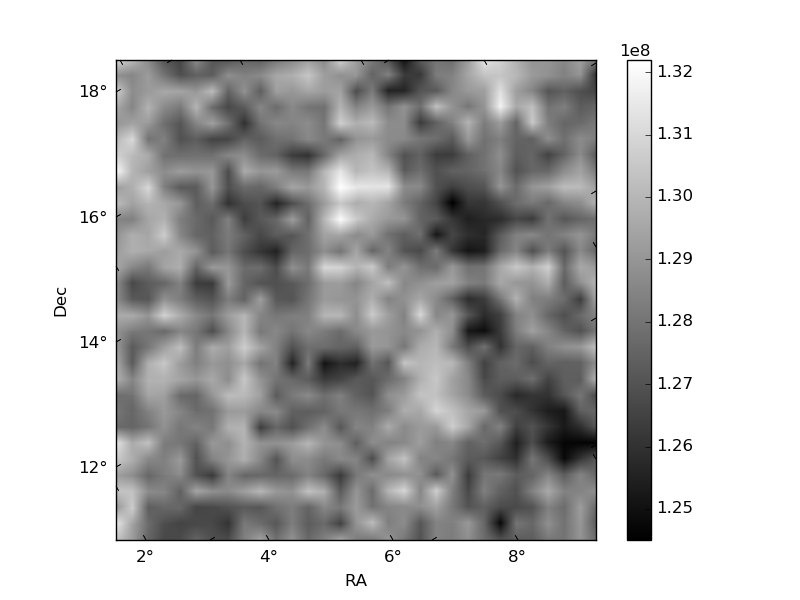
Quadrant B |
|---|---|---|---|
| Quadrant D | 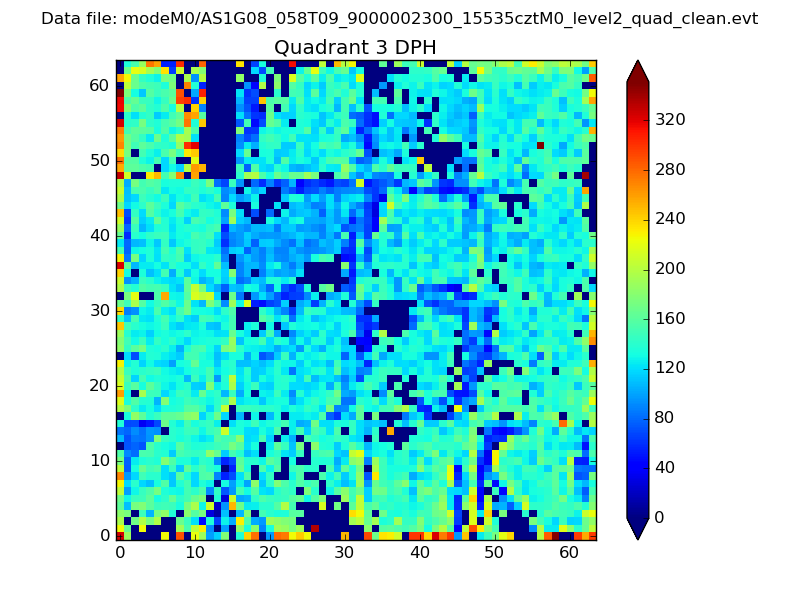 |
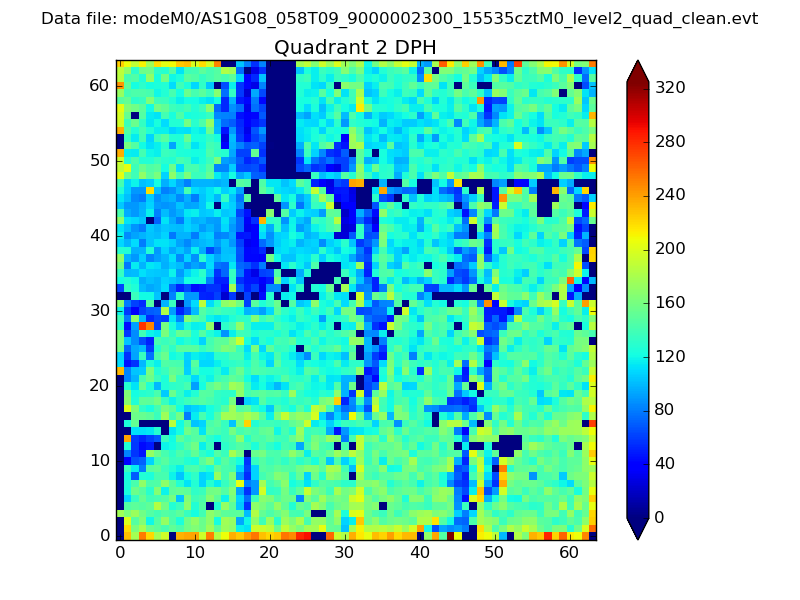 |
Quadrant C |
| Plot type | Count rate plots | Images |
|---|---|---|
| Comparison with Poisson distribution Blue bars denote a histogram of data divided into 1 sec bins. Red curve is a Poisson curve with rate = median count rate of data. |
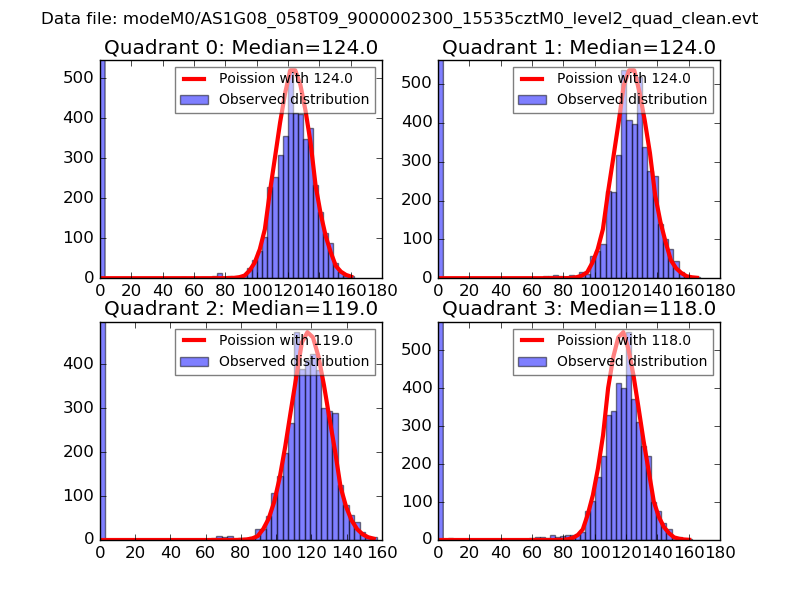 |
 |
| Quadrant-wise count rates Data is divided into 100 sec bins |
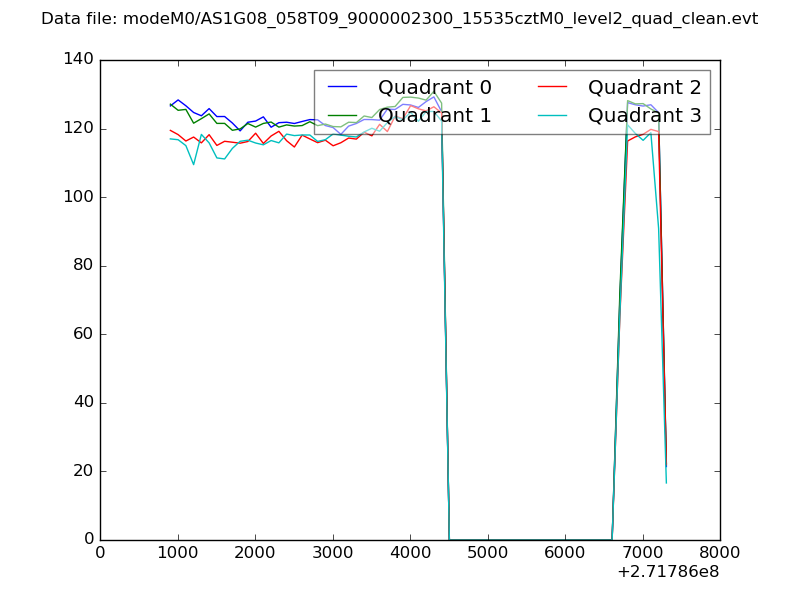 |
|
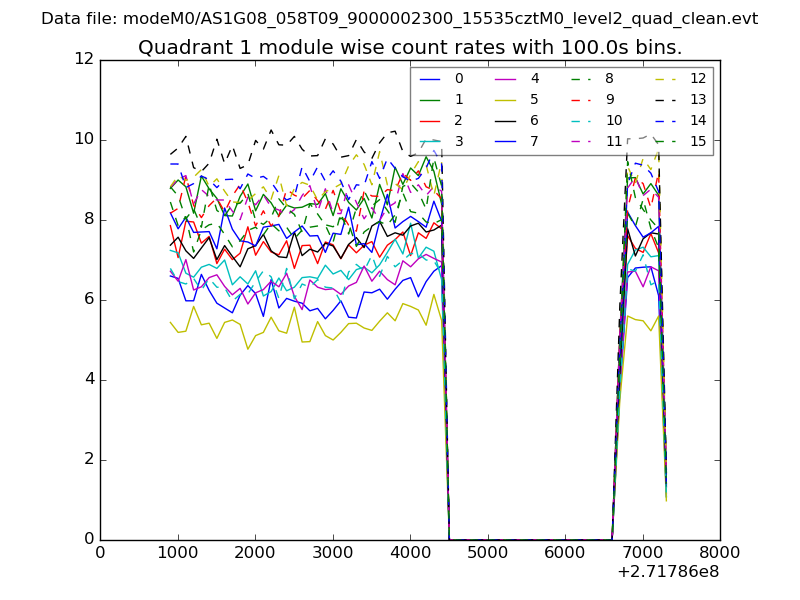
| Module-wise count rates for Quadrant A Data is divided into 100 sec bins |
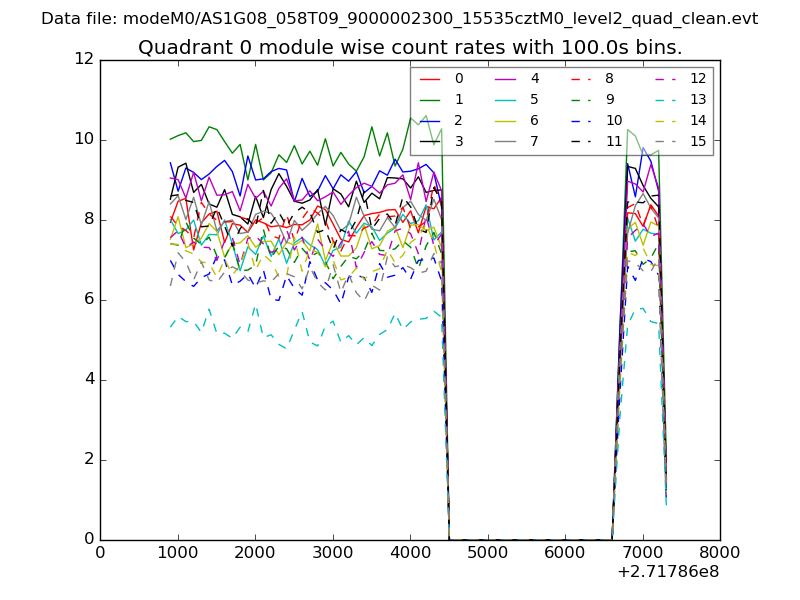 |
 |
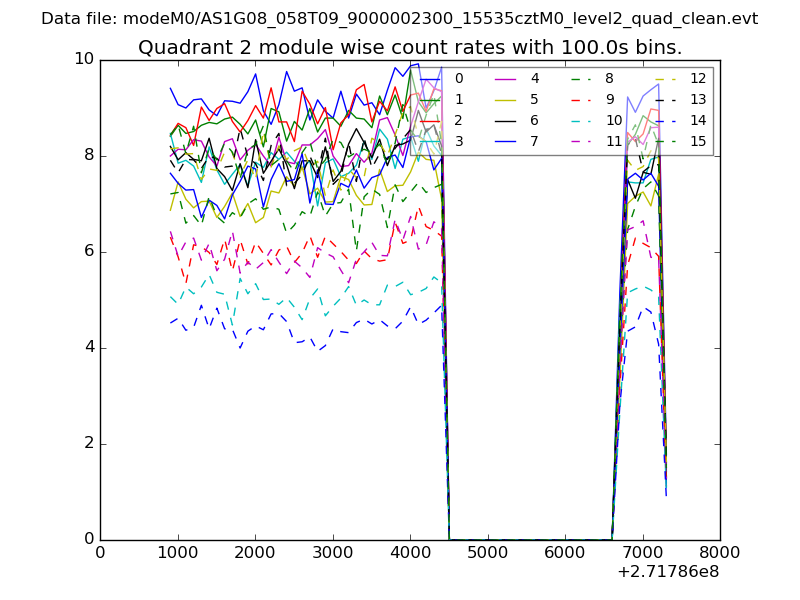
| Module-wise count rates for Quadrant B Data is divided into 100 sec bins |
 |
 |
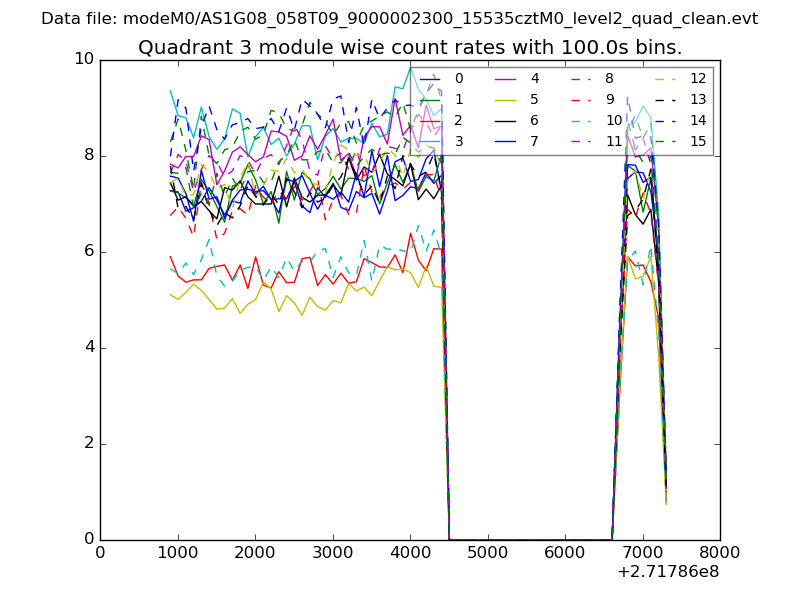
| Module-wise count rates for Quadrant C Data is divided into 100 sec bins |
 |
 |
| Module-wise count rates for Quadrant D Data is divided into 100 sec bins |
 |
 |
| Parameter | Plot |
|---|---|
| CZT HV Monitor | 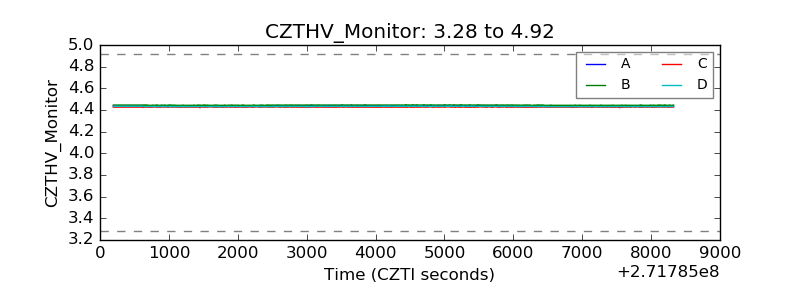 |
| D_VDD | 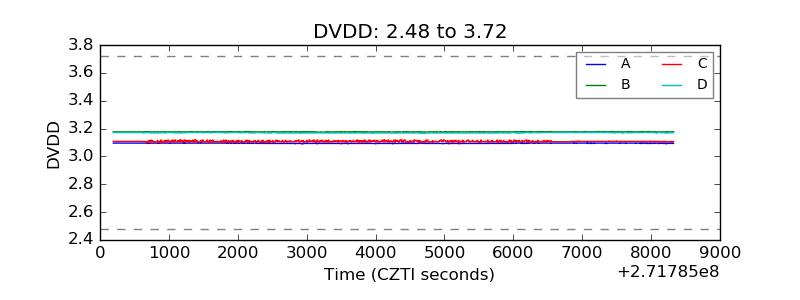 |
| Temperature 1 |  |
| Veto HV Monitor | 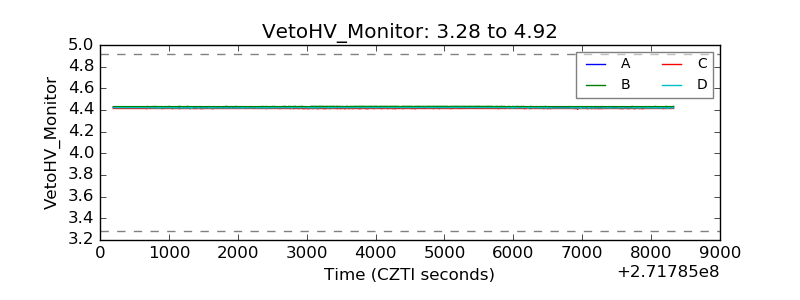 |
| Veto LLD | 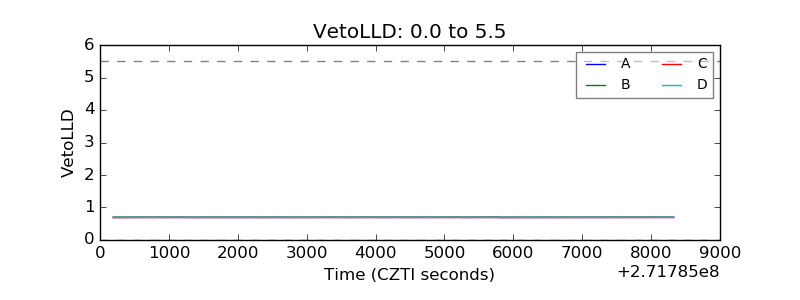 |
| Alpha Counter | 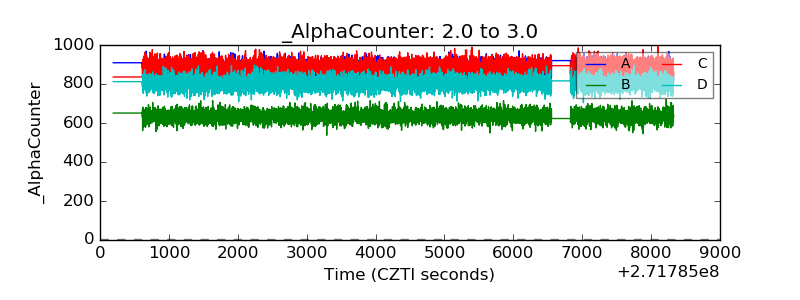 |
| _CPM_Rate | 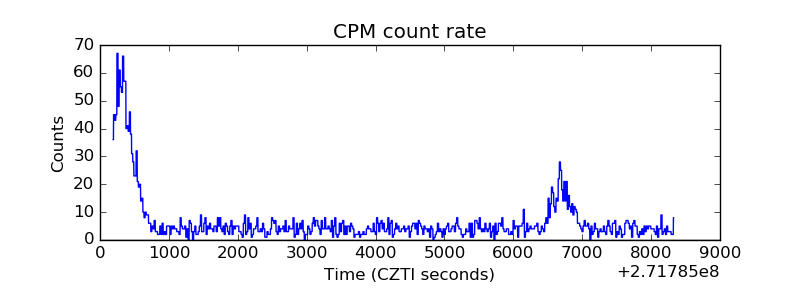 |
| CZT Counter | 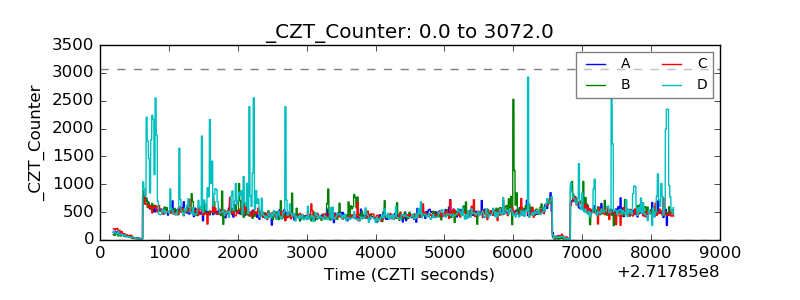 |
| +2.5 Volts monitor |  |
| +5 Volts monitor |  |
| _ROLL_ROT |  |
| _Roll_DEC | 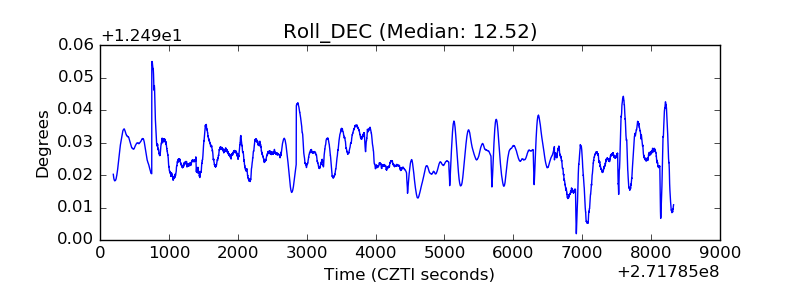 |
| _Roll_RA | 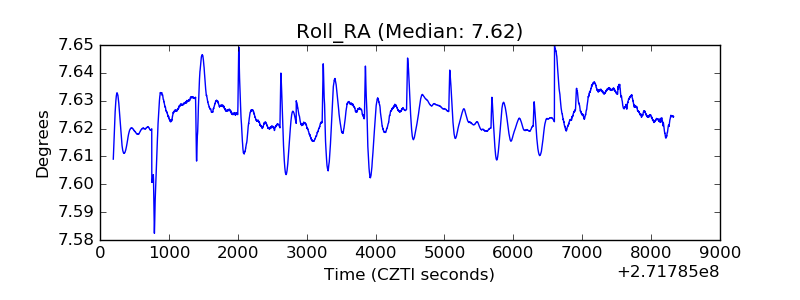 |
| Veto Counter | 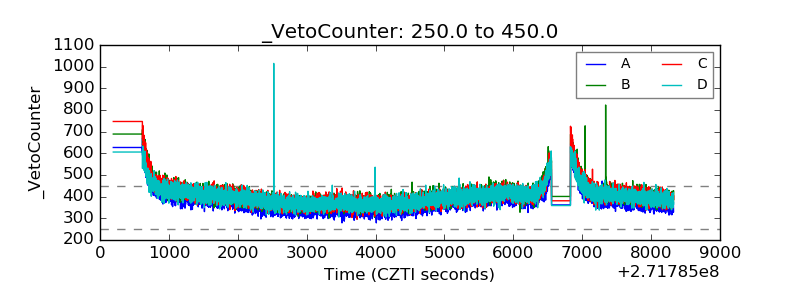 |